
Abstract
Aim
To create longitudinal trajectories and reference percentiles for frequency of participation in family and recreational activities for children with cerebral palsy (CP) by Gross Motor Function Classification System (GMFCS) level.
Methods
708 children with CP 18-months to 12-years of age and their families participated in two to five assessments using the GMFCS and Child Engagement in Daily Life Measure. Data were analyzed using mixed-effects models and quantile regression.
Results
Longitudinal trajectories depict the relatively stable level of frequency of participation with considerable individual variability. Average change in the frequency of participation scores of children from 2-12 years of age by GMFCS level varied from 3.7 (GMFCS level I) to – 9.0 points (GMFCS level V). A system to interpret the magnitude of change in percentiles over time is presented.
Conclusions
Longitudinal trajectories and reference percentiles can inform therapists and families for collaboratively designing services and monitoring performance to support children’s participation in family and recreational activities.
Children with cerebral palsy (CP) participate in daily life activities and routines to a lesser extent than children without disabilities (Chiarello et al., Citation2014; Imms, Citation2008) and participation has become a central focus of pediatric rehabilitation (Carey & Long, Citation2012; Chiarello, Citation2017; Imms et al., Citation2017). Participation is significant because through life experiences children can learn, form friendships, foster their health, and become fulfilled. Research in the last decade has 1). identified reliable and valid measures of participation (Chiarello et al., Citation2014; Coster et al., Citation2012; Khetani et al., Citation2015; King et al., Citation2004; Law et al., Citation2012); 2). illuminated the child, family, and environmental factors associated with participation (Alghamdi et al., Citation2017; Anaby et al., Citation2013; Chiarello et al., Citation2016; Chiarello et al., Citation2012; Hammal et al., Citation2004; Imms et al., Citation2009; King et al., Citation2006; Majnemer et al., Citation2008; Palisano et al., Citation2011; Shikako-Thomas et al., Citation2008); and 3). developed and examined intervention approaches to promote participation (Anaby et al., Citation2015; Law et al., Citation2015; Palisano et al., Citation2012). Research suggests that an individualized, collaborative, goal-directed, ecological intervention approach is effective in supporting children’s participation (Anaby et al., Citation2015; Law et al., Citation2015; Palisano et al., Citation2012). To inform pediatric rehabilitation practice, therapists and families also need information on the developmental course of participation in family and community activities as well as a process for monitoring children’s participation over time to determine when interventions and supports are needed.
Empirical research with parents of children with CP demonstrates that the majority of parents want information for planning for the future (Palisano et al., Citation2010). Data from longitudinal periodic assessments using standardized outcome measures are useful for identification of needs to guide interventions, supports, and future planning. The effect of age on participation in leisure activities is complex and findings have been inconsistent depending on the age range of the children and the dimension of participation being studied (Alghamdi et al., Citation2017). Majnemer and colleagues (Citation2015) evaluated the changes in participation in leisure activities in 38 children from mid childhood (6-12 years of age) and then again during adolescence (12-19 years of age) using the Children’s Assessment of Participation and Enjoyment (CAPE) measure (King et al., Citation2004). Adolescents participated in a reduced number and frequency of recreational, skill-based, and self-improvement activities; whereas participation in social activities was stable. Across the two time-periods, children’s preferences for activities were primarily stable and enjoyment declined. Eighty-two percent of the children in the study were able to walk independently.
Longitudinal data on larger and more diverse samples are needed to create trajectories that provide knowledge of the average path and variability of children’s participation over time and where an individual child is performing relative to his or her peers at similar functional levels. Imms and Adair (Citation2017) followed a cohort of 93 children with CP, 10-12 years of age, over a period of 9 years. As measured with the CAPE, participation in the number and frequency of recreation, active physical, and self-improvement activities decreased over time; skill-based activities remained stable, and social activities increased. However, rate of change was noted to be slow. No changes were found for enjoyment of participation and activity preferences decreased over time except for social activities that remained stable. Due to the relatively small sample size, findings could not be reported for distinct functional groups of children with CP.
Decreased participation in a range of leisure activities, excluding social, for adolescents and young adults with CP (Imms & Adair, Citation2017; Majnemer et al., Citation2015), warrants further research to understand the trajectories of participation for children with CP during early and mid-childhood with a large sample to describe the path for children at distinct functional levels. As the CAPE includes 55 activities, the creation of trajectories and a process for monitoring participation in leisure activities for children with a shorter measure is needed to facilitate inclusion of participation as part of an efficient, clinically feasible, and comprehensive functional assessment of children with CP across multiple domains.
The Child Engagement in Daily Life Measure (Chiarello et al., Citation2014) for children with CP is completed by parent report and comprised of two domains: Participation in Family and Recreational Activities and Self-care Performance. In this paper we focus on frequency of children’s participation in family and recreational activities that is measured across 11 broad categories of activities. Frequency of being part of activities is important because it reflects access to opportunities and attendance, which are the first steps to meaningful engagement. These categories include: family activities at home and in the community, indoor and outdoor play with children and adults, quiet recreation, organized lessons and groups, active physical recreation, entertainment outings, and social activities. The Child Engagement in Daily Life Measure has undergone Rasch analysis and the internal consistency, test-retest reliability, known groups validity, and sensitivity to change over one year for children who have at least some walking ability have been supported (Chiarello et al., Citation2014; Alghamdi et al., Citation2017; Palisano et al., Citation2015).
The objective of the study was to describe variations in frequency of participation in family and recreation activities across children with CP and over time using the Child Engagement in Daily Life Measure. This objective was achieved by modeling longitudinal trajectories and percentile curves for children with five distinct ability levels as determined by the Gross Motor Function Classification System (GMFCS, Palisano et al., Citation2008). Longitudinal trajectories estimate change over time and reference percentiles provide information on the typical distribution of scores at a given age. Similar longitudinal trajectories (Rosenbaum et al., Citation2002) and reference percentiles (Hanna et al., Citation2008) for gross motor function have proved useful for estimation of prognosis and intervention planning, including planning for the future. As gross motor function has been identified consistently as a determinant of participation for children with CP (Alghamdi et al., Citation2017; Chiarello et al., Citation2012, Citation2016; Imms et al., Citation2009; Law et al., Citation2012; Majnemer et al., Citation2008; Palisano et al., Citation2011; Shikako-Thomas et al., Citation2008), we elected to present the trajectories and curves by ability levels for this functional domain. Knowledge of how children progress in participation in family and recreational activities as they age and comparison to other children with similar gross motor function has application for periodic ‘check-ups’ and collaboration with families to monitor children with CP, establish goals, and develop meaningful plans for intervention.
Methods
Design
This study was part of a multisite, prospective cohort study entitled ‘On Track: Monitoring Development of Children with Cerebral Palsy and Gross Motor Delay,’ which aimed to develop longitudinal trajectories and reference percentiles for impairments, health conditions, self-care, and participation in family and recreational activities for children with CP (McCoy et al., Citation2018; McCoy et al., Citation2019). The full study protocol has been reported elsewhere (McCoy et al., Citation2018) and parts of the methodology have been previously reported (Fiss et al., Citation2019) and reproduced here with permission. Institutional Review Boards at all participating institutions and recruitment sites with IRBs reviewed and provided ethics approval. All parents or guardians provided informed consent and children, as appropriate and in compliance with the specific IRB, provided assent.
Participants
A convenience sample of 708 children with CP ages 18-months through 11-years of age at the time of enrollment (2013-2015), GMFCS Levels I-V, and their primary caregivers participated in this study. Children were recruited from six sites across Canada, including British Columbia, Saskatchewan, Manitoba, Ontario, Nova Scotia, and Newfoundland, and four sites of the United States, including areas within and surrounding Georgia, Oklahoma, Pennsylvania, and Washington states. Participating children had a diagnosis of CP by a physician or demonstrated delay in gross motor development in addition to impairments in muscle tone, righting and equilibrium reactions, anticipatory postural movements of the head, trunk, or legs during movement, and active range of motion during movements. The distribution of GMFCS level in this large prospective cohort was comparable to incidence data reported in the literature. Reid and colleagues (Citation2011) reported mean proportions (SD) in each GMFCS level in nine international CP registries: GMFCS I - 34.2% (13.1); GMFCS II – 25.6% (11.6); GMFCS III – 11.5% (2.5); GMFCS IV – 13.6% (4.3); GMFCS V - 15.6% (4.3). The proportion of children in each GMFCS level in our sample was GMFCS I – 32.1%; GMFCS II – 22.7%; GMFCS III – 11.2; GMFCS IV – 18.2%; GMFCS V – 15.7%.
Continued eligibility to participate was confirmed throughout the study so that the final sample represented children with CP. Therapist assessors questioned the eligibility of 71 children either before enrollment or during the study. They provided detailed information on the children’s medical diagnoses and clinical presentation. A physiatrist (JWG) reviewed and made recommendations to the team regarding the eligibility of each of these children, and 11 children were excluded from the final sample as a result of this review. Children were excluded if their parents were unable to speak and understand English, French or Spanish. Attrition was tracked across all study visits and is documented in . (Replicated with permission, McCoy et al., Citation2018). Demographic information of the children and their families is included in . (Replicated with permission, McCoy et al., Citation2018).
Figure 1. On track study participant flow diagram (McCoy et al., Citation2018).
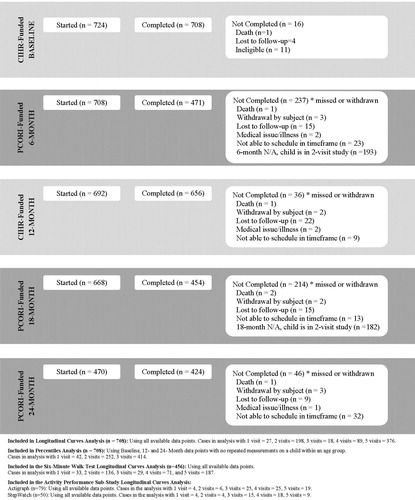
Table 1. Child and parent demographics. Replicated with permission (McCoy et al., Citation2018).
Measures
Child Engagement in Daily Life Measure
Children’s participation was measured using the Participation in Family and Recreational Activities domain of the Child Engagement in Daily Life Measure (Chiarello et al., Citation2014). The description of the measure has been previously reported (Alghamdi et al., Citation2017). The participation in family and recreational activities domain is an 11-item parent-reported measure that asks parents to rate their children’s participation on two dimensions, frequency and enjoyment. Parents score participation on two 5-point Likert scales: how often does your child participate in an activity, i.e. frequency, (5 = very often; 4 = often; 3 = once in a while; 2 = almost never; 1 = never); and how much does your child enjoy the activity, i.e. enjoyment, (5 = a great deal; 4 = very much; 3 = somewhat; 2 = very little; 1 = not at all). Items of the measure represent categories of activities rather than discrete tasks. Examples of items include: family activities at home, outdoor play with children, and organized lessons. Under each item, there is a range of activity/routine examples; however, parents are instructed that these examples are not exhaustive and they can consider other activities in which their children participate. Scores for the participation dimension range from 0-100 based on Rasch analysis. Scores for the enjoyment dimension, calculated as the average raw score for the 11 items range from 1-5. Higher scores indicate greater frequency and enjoyment of participation in family and recreational activities. The measure was originally developed for young children 18 months to 6 years of age and in the context of the On Track study tested for application to children up to 12 years of age.
Reliability and validity of the measure, including creation of an interval scoring system through Rasch analysis for the frequency of participation, have been supported for children with CP 1.5 to 5 years of age (Chiarello et al., Citation2014). Construct validity was established using the known groups methods to determine the variation of participation across age groups and gross motor function levels. It has been reported that young children (17 to 30 months) participate less often and enjoy participation less than older children (43 to 60 months) and children with higher gross motor function have higher participation scores than children with lower gross motor function (Chiarello et al., Citation2014). The internal consistency of the measure is high; Cronbach’s alphas are 0.86 and 0.91 for frequency and enjoyment dimensions, respectively (Chiarello et al., Citation2014). The test-retest reliability for both frequency and enjoyment was found to be acceptable, ICC (2,1) = 0.70, with an average of 23 days between assessments (Chiarello et al., Citation2014). Palisano et al. (Citation2015) investigated the change in participation in family and recreational activities over one year for children 18 months to 5 years of age. The authors reported that the measure is sensitive to change over time for children in GMFCS level I (Cohen’s d = 0.22) and for children in GMFCS levels II-III (Cohen’s d = 0.34) but not for children in GMFCS levels IV-V.
During the On Track study, the measure was revalidated for children with CP 18 months to 12 years of age. Alghamdi et al. (Citation2017) found that children with higher gross motor, manual, and communication function had higher participation scores than children with lower functioning. Additionally, using data from both the Move and Play (Chiarello et al., Citation2014) and On Track studies, test retest reliability, with an average of 23 days between assessments, was ICC = 0.76 (95% CI 0.64-0.84), with SEM 4.9 (95% CI ± 9.6) and MDC95 = 13.6 (Bartlett et al., Citation2018a). The Rasch model of item response analysis (Masters & Wright, Citation1982) was used to determine the hierarchical ordering of the participation items for the frequency scores and to devise an interval scoring system based on the item calibrations. Model fitting was performed with the mixRasch package in R 3.2.4 (Willse, Citation2015). The partial credit model was used to score the 11 items for participation in family and recreational activities. As the “almost never” response was underutilized across the items, “almost never” and “never” were collapsed into a single response, resulting in four response categories. Unidimensionality for the participation items was confirmed. Response levels were ordered as expected for all items. Analysis confirmed acceptable fit of items and stable item calibrations. Person calibrations were re-scaled from the logit scale to scores ranging from 0 to 100, with higher scores indicating greater frequency of participation in family and recreational activities. The interval scores for frequency of participation in family and recreational activities were used for creation of the longitudinal trajectories and reference percentile curves. The Child Engagement in Daily Life Measure (Version 2) and conversion tables are available at https://www.canchild.ca/en/research-in-practice/current-studies/on-track/on-track-measures.
Gross Motor Function Classification System (GMFCS)
The GMFCS is a five-level system to classify children with CP (2-18 years) based on their performance of self-initiated movement during daily life with emphasis on sitting and mobility (Palisano et al., Citation2008; Palisano et al., Citation2008). Distinctions between levels include functional abilities, use of assistive technology, and quality of movement (Palisano et al., Citation2008). Content validity, construct validity, discriminative validity, and inter-rater reliability have been previously supported (Palisano et al., Citation2008; Palisano et al., Citation2008; Rosenbaum et al., Citation2002). The age band descriptions used in this study were 2-4 years, 4-6 years, and 6-12 years. The longitudinal and reference curves were created for each GMFCS level. The GMFCS was selected because it is more reliable than either type of motor disorder or distribution of involvement (Gorter et al., Citation2004) and from a philosophical standpoint, we believe in categorizing children by their motor function classification, building on 20-years of research around the GMFCS.
Procedures
Children participated in two (n = 656) [baseline and approximately 12-months later] to five (n = 424) [baseline and approximately 6, 12, 18, and 24-months later] assessment sessions with a physical or occupational therapist in their home or clinic setting. The therapist completed the GMFCS via consensus with parents (Bartlett et al., Citation2016). The GMFCS was independently completed at baseline by both the therapist and the parent, and then the child’s classification was discussed in attempt to reach consensus. Consensus was reached 97.8% of the time, and all disagreements were within one level (Bartlett et al., Citation2016). Based on study protocol, when there was a disagreement, the classification level provided by the parent was used with specific rules applied to determine if the therapist’s classification should be used instead. Reasons to accept the therapist’s classification included: compelling written descriptions of the child’s capability by the therapist that was lower than the parent-reported performance, use of the incorrect age band for the GMFCS, or therapist providing information that the parent was not ready to discuss reconciliation of disagreements when the therapist classified the child at a less functional level than the parent (Bartlett et al., Citation2016). If the child was under two at baseline, the GMFCS was completed again approximately 12 months later and that classification was used. The therapist then completed several physical assessments with the child. The parents completed eight self-report measures at baseline including the GMFCS classification and the Child Engagement in Daily Life Measure. During the assessment sessions approximately 6- and 18-months later the parents completed four self-report measures. During the assessment sessions approximately 12- and 24-months later the parent completed seven self-report measures. At each assessment session, the Child Engagement in Daily Life Measure was the first self-report measure introduced. Overall assessment time was 60 minutes or less for each session.
Data Analysis
If a child was assessed at a timepoint but did not complete all of the measures, then a score was imputed for that child. Imputations were made using a mixed-effects random forest model that incorporated information about the child’s age and information on other completed measures. For participation frequency scores, 1.6% of the data points were imputed.
Longitudinal Trajectories
To create longitudinal trajectories, describing the average change in the Child Engagement in Daily Life Measure participation domain frequency score with respect to age, five separate linear mixed-effects models (Pinheiro & Bates, Citation2004) were fit for children in each GMFCS level. This approach was used to 1) be consistent with the methodological and clinical tradition established by Rosenbaum et al. (Citation2002), 2) allow for simpler, more easily interpretable models, and 3) enable the discovery of possible different functional forms across the levels which would facilitate clinical application for practitioners. Data were centered around 60 months of age, so the intercept parameter represents the average score at age five. Random effects were fit for the intercept and slope to estimate the variability in the parameters among children. Models were fit using the nlme package (Pinheiro et al., Citation2018). To facilitate comparisons across levels, population-level predictions were made at ages two, five, and 12 years for each model. Confidence intervals were calculated by drawing a sample of 1000 fixed effects estimates from the fitted parameters and their covariance matrix using the multivariate normal distribution.
Reference Percentiles
Child Engagement in Daily Life Measure participation domain frequency score data from the first, 12-month, and 24-month visits were analyzed via quantile regression (QR) to construct cross-sectional reference percentiles for each gross motor function level. To maximize the sample size, the analysis included up to three assessments for each child. The quantregGrowth package in R was used, which uses linear combinations of multiple bases functions to estimate smooth quantiles across the age continuum and constrains the percentiles to be non-crossing (Muggeo et al., Citation2013). These reference percentiles describe the distribution of scores at each age within each GMFCS level.
We determined percentile scores for each age and GMFCS level, using the calculated percentile scores for all children with baseline and 12-month assessments. The amount of change in each child’s percentile score over this 12-month period was calculated by subtracting the baseline percentile score from the 12-month percentile score. The distribution of these 12-month change scores was used to estimate bands that encompass 50% and 80% of changes. Following Hanna et al. (Citation2008), we recommend that children whose percentile changes are within the 80% limits can usually be described as ‘progressing as expected’ for their age and GMFCS levels.
Results
Descriptive data for the frequency of participation in family and recreational activities are presented in . Longitudinal trajectories for participation by GMFCS level are shown in with the accompanying model parameters in . The average score at 60 months of age, shown as the intercept of the fixed effects in , varies from 68.8 (children classified at level I) to 54.2 (children classified at level V). Generally, the mean frequency of participation in family and recreational activities shows little to no change between 2 to 12 years of age by GMFCS level, 3.7 (GMFCS level I) to -9 (GMFCS level V) points. The slopes for trajectories for children in GMFCS levels I-IV were not significantly different than 0. Notably children in GMFCS levels II and V show a slight decline in mean score for frequency of participation as they age, as reflected by the negative slope, and this is more pronounced for children in level V. For children in GMFCS level II, the mean frequency in participation between the ages of 11-12 is slightly lower than the mean frequency for children in GMFCS level III. The estimated participation score at age 12 years was the largest for children at GMFCS Level I and decreased for children in each successive GMFCS level, except for levels II and III. The residual standard deviations, estimates of the average amount of variability in observed scores around a child’s true trajectory, () and the trajectory plots () depict the intra- and interindividual variability of frequency of participation in family and recreational activities.
Figure 2. Longitudinal trajectories by GMFCS Level.
Note. The y axis represents the Rasch scores for frequency of participation in family and recreational activities domain of the Child Engagement in Daily Life Measure. The x axis is age in years.
The body of the graphs depicts the scores over time for the participants in the study based on GMFCS level. The solid line represents the average, the fit of the model.
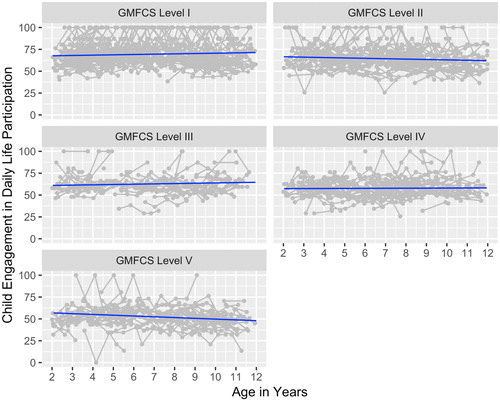
Table 2. Model parameters and estimated population values at age 2, 5 and 12 years for linear trajectories of frequency of participation for children in each GMFCS level.
shows the estimated reference percentiles for each GMFCS level, plotted at the 3rd, 5th, 10th, 25th, 50th, 75th, 90th, 95th, and 97th percentiles. For GMFCS level I we were unable to plot beyond the 75th percentile because a number of children scored 100, indicating a ceiling effect. For all levels there was no floor effect of the measure. Additional versions of these figures and the tabulated percentiles are available on the On Track study website: https://www.canchild.ca/en/research-in-practice/current-studies/on-track. provides the mean and standard deviation of the change in percentile score over a one-year period by GMFCS level, along with the range of the central 50% and 80% of change scores. Mean change in percentile is small and varies from 4 (children classified as level I) to -3 (children classified as level V). Standard deviations are large (22.1 – 24.6). Consequently, the central 80% interval varies from a change of 53 percentiles (level I) to 71 percentiles (level III). The following describes the interpretation of change in reference percentile based on the 80% interval. For children classified as level III, the percentile change for the 80% interval is 71 percentiles, −40 (10th percentile) to +31 (90th percentile). A percentile change between -40 and +31, therefore, suggests progress is ‘as expected’. A decrease greater than -40 percentiles suggests a child is “progressing less than expected’ while an increase greater than 31 percentiles suggests a child is “progressing better than expected”.
Figure 3. Reference Percentiles by GMFCS Level.
Note. The y axis represents the Rasch scores for frequency of participation in family and recreational activities domain of the Child Engagement in Daily Life Measure. The x axis is age in years.
The body of the graphs depicts the percentiles for the scores based on GMFCS level.
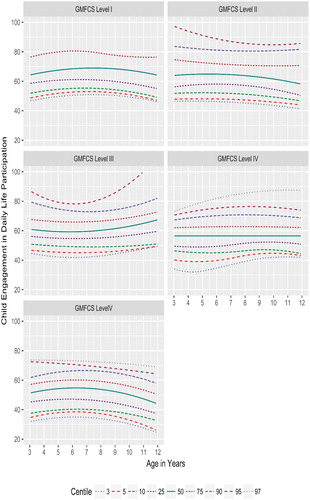
Table 3. Mean and standard deviation of change in percentile score over a one-year period by GMFCS level.
Discussion
The longitudinal trajectories and reference percentile curves are data that physical and occupational therapists can share with families to evaluate and monitor children’s frequency of participation in family and recreational activities. As participation is an individualized experience, influenced by many factors, these trajectories and curves can serve as a guide to inform therapists and families for collaboratively establishing meaningful goals, designing services, selecting interventions, and monitoring performance to support children’s participation. Video examples of using and sharing the data during collaborative discussions with a parent and youth are available online at https://www.canchild.ca/en/research-in-practice/current-studies/on-track/publications-and-presentations.
The longitudinal trajectories provide evidence for therapists and families to discuss how often children are participating in family and recreational activities in relationship to the average values of other children with CP of similar gross motor function and age and to anticipate what is expected in the future. The finding that the average trajectories are relatively stable is positive, illustrating that the frequency of participation in family and recreational activities is steady for children with CP 2-12 years of age. Because the Child Engagement in Daily Life Measure participation domain measures categories of family and recreational activities, it is important for therapists to discuss with children and families the specific activities they currently participate in and revisit this as children age as preferences and environmental contexts may change. We recommend that the measure be utilized to describe and monitor participation frequency and be complemented with children’s individualized goals for performance and engagement in family and recreational activities to document meaningful outcomes.
The level of the average trajectories did vary slightly across the GMFCS levels, with level I being the highest and level V the lowest. The estimated population values at 12 years of age reflect that children in level I are participating in family and recreational activities often to very often, children in levels II-IV often, and children in level V once in a while. It is important for therapists and families to proactively consider the supports and advocacy that may be needed to address participation restrictions for children whose self-initiated mobility is significantly limited (GMFCS level V). However, children at each GMFCS level showed similar variability on the measure, which underscores that participation is a personal experience influenced by multiple factors. Because of this variability, the longitudinal trajectories need to be used as a guide for children’s frequency in participation. With frequency of participation expected to be steady over time, but variable among individual children, therapists have a role to optimize opportunities and options for all children. It is important for therapist to collaborate with families and community programs to ensure children’s access and ability to participate in family and recreational activities.
The slight decrease of frequency in participation over time for children in level V requires further examination to understand if it is clinically meaningful, the determinants associated with the decline, and if the decline continues further in adolescence, as might be suggested based on previous research that has documented that frequency of participation in recreational, active physical, and self-improvement decreased as children with CP aged from 10 to 18 years of age (Imms & Adair, Citation2017). The decline from 2-12 years in our current study does not reach the minimal detectable change at the 95% confidence interval so this may not represent actual change. However, for children in GMFCS level V, a 9-point drop, from age 2 to 12 years, in frequency of participation, approximates a change from participating often to once in a while. How age may influence participation in family and recreational activities is complex and most likely depends on a multitude of child, family, and environmental factors (Alghamdi et al., Citation2017). Our accompanying study data on health conditions (Bartlett et al., Citation2018b) found that children, except for those in GMFCS level III, were likely to experience greater impact of health conditions on their daily life as they got older, and this was most prominent for children in GMFCS levels II and V. The impact of health conditions may be a plausible explanation for the possible decline found in frequency of participation for children in levels II and V.
The reference percentiles indicate how a child’s frequency of participation compares with peers of the same gross motor function level and age. A single assessment permits an understanding of a child’s individual strengths and restrictions related to participation. The reference percentiles might be useful in identifying participation as a primary focus for intervention to improve participation in family and recreational activities or to utilize their strengths in participation to optimize other health related areas such as fitness.
Completing a second assessment later in time provides an understanding of change in relative ranking of participation frequency among other children with CP. This comparison of percentiles enables therapists and families to determine if an individual child with CP is demonstrating participation frequency scores that are progressing ‘as expected,’ ‘more than expected,’ or ‘less than expected’ over time, depending on their functional ability levels. Relative percentile standing can be more variable than the measured changes in ability that underlie them, and large changes in percentiles can occur over 12 months, but still be categorized as progressing ‘as expected’. Because percentiles represent a relative standing at a moment in time, decisions about services also require an analysis of the child’s participation via examination of actual scores and conversations with the child and family about the context of their family life and the child’s overall health that may be impacting their participation.
Case Scenario
To illustrate the application of these data to practice, consider Caden (pseudonym), a study participant, classified as GMFCS level III, Manual Ability Classification System level II (Eliasson et al., Citation2006), and Communication Functional Classification System level II (Hidecker et al., Citation2011). Caden has a sibling. He was assessed at age 8 years 9 months and then again at age 9 years 6 months. At the first assessment, his score for frequency of participation in family and recreational activities was 66.1, which for his age and GMFCS level was slightly above the average on the longitudinal trajectory. This suggests that participation is an area of strength and based on the average trajectory we may expect his participation to remain steady. From review of the Child Engagement in Daily Life Measure participation domain items, Caden participates in quiet recreation, organized groups, social activities, and play with children very often; active physical recreation often; and play with adults once in a while. He enjoys family activities and outings, organized groups, social activities, and quiet recreational activities but only somewhat enjoys informal play with adults or other children. His manual and communication abilities were recognized as strengths to enable him to engage with objects and people. From supplemental information we learned that Caden is involved in three community recreation programs, a gym program with a therapist involved, a sports program, and a scouting club. Using the percentile graph, his participation score was at the 65th percentile. This percentile indicates that his score was higher than the scores of 65% of children in level III at this age and also corresponds to his score’s position above the average on the longitudinal trajectory.
At his second visit, Caden’s participation score was 55.1, which corresponds to the 20th percentile. Therefore, an 11-point drop in the participation score translated to a percentile change of – 45. This negative percentile change places him lower than the middle 80% of children at his age and GMFCS (-40 to +31; ), suggesting that he is progressing ‘less than expected’. However, it is acknowledged that the 11-point decline does not meet the MDC at the 95% confidence interval. Visual inspection of scores for individual items indicates that he now participates less frequently in quiet recreation, organized lessons, entertainment and social outings, and outdoor play with children. As children get older, we might expect them to focus more intently on fewer activities of interest; however, the reduction in this range of family and recreational activities clinically would be judged as meaningful and potentially concerning. Using all this information, it is important for the therapist to have a genuine discussion with Caden and his family to identify and understand what factors may be contributing to this change and then to collaboratively determine if a modification for his intervention plan is warranted. Based on knowledge of determinants of participation (Alghamdi et al., Citation2017; Anaby et al., Citation2013; Imms et al., Citation2009; Majnemer et al., Citation2008; Palisano et al., Citation2011; Shikako-Thomas et al., Citation2008), plausible explanations for this change may include Caden’s preference to focus more on homework, a decrease in Caden’s gross motor abilities, increase in parental stress, and reduced access to supportive community recreational programs. Using the Child Engagement in Daily Life Measure to monitor Caden’s participation in family and recreational activities over time can inform and facilitate collaborative decisions regarding goals and services to support meaningful outcomes.
Limitations and Implications for Research
The convenience sample used in this study presents a potential limitation; however, the GMFCS distribution of this cohort sample is comparable to incidence data reported in the literature, supporting the generalizability of the findings (Reid et al., Citation2011). Our sample, though, may not be representative of the demographics of the population of children with CP and their families in the US and Canada. The frequency dimension of the participation domain of the Child Engagement in Daily Life Measure for some children in GMFCS level I had a ceiling effect. Though the majority of children in level I did not reach the maximum score, some children are participating frequently across all the categories of activities. This limits the interpretation of the children’s true plateau and the tool can only monitor that participation frequency remains stable. This limitation also suggests that for children in level I a different measure, that perhaps includes smaller clusters of activities, be used to allow for further differentiation of frequency of participation in family and recreational activities. Additionally, as previously noted for young children with CP in GMFCS levels IV-V over a period of one year (Palisano et al., Citation2015), the measure may not be sensitive to change. Therefore, the potential decline of frequency of participation in family and recreational activities for children in GMFCS level V requires further study, perhaps with measures that differentiate participation at home, school, and community settings, to determine if the decline is real and to understand the context.
The trajectories and curves in this study only reflect frequency of participation in family and recreational activities for subgroups of children with CP based on motor function. Caution is needed when using the findings to monitor participation and guide intervention planning as there is no intent to imply that higher frequency of a greater range of activity types is better. Further research is needed to identify how children’s engagement in activities progresses over time. Engagement or extent of involvement is a more challenging dimension to measure (Granlund, Citation2013; Imms et al., Citation2016), but perhaps more meaningful. A recent study by Williams and colleagues (Citation2019) found that for young children with disabilities the association between complexity of activities and level of involvement was higher than the association between complexity of activities and frequency of participation. Finally, in this study we describe participation in family and recreational activities for children with CP over time for distinct subgroups based on gross motor function. Future research is warranted to describe participation over time for subgroups based on other characteristics such as communication function.
Conclusion
Therapists and families can expect that on average frequency of participation in family and recreation activities will remain steady between 2 to 12 years of age with a slight decline for children in GMFCS levels II and V. Percentile changes over a 12-month period within the 80% limit are wide. Longitudinal trajectories and reference percentiles are different for children at various gross motor function ability levels. Variability within each level highlights the need for therapists to ensure that frequency of participation in family and recreational activities is aligned with children’s interest and not constrained by modifiable factors that can be changed. When used appropriately to monitor frequency in participation and change over time for children with CP, the longitudinal trajectories and reference percentiles can inform therapists and families for collaboratively designing services. Knowledge of the pattern and timing of participation may assist therapists and families to envision the possibilities and to intervene to potentially improve the future course of participation for children with CP.
Acknowledgements
We acknowledge additional On Track Study Team members including academic researchers: Doreen Bartlett, Sally Westcott McCoy, Lynn Jeffries, Alyssa Fiss, and Jan Willem Gorter; Canadian project coordinator Barb Galuppi; US project coordinator Monica Smersh; and parent researchers: Lisa Diller, Paula Drew, Nancy Ford, Marquitha Gilbert, tina hjorngaard, Kimberly Rayfield, and Barbara Sieck Taylor. We thank the participating children and families, whose continued involvement made this study possible. We also acknowledge the important contributions of the regional coordinators as well as the 90 therapists across North America who assessed children during the course of the study.
Disclosure statement
No potential conflict of interest was reported by the author(s).
Additional information
Funding
Notes on contributors
Lisa A. Chiarello
Lisa A. Chiarello, PT, PhD, FAPTA, is a Physical Therapist, Professor in the Department of Physical Therapy and Rehabilitation Sciences at Drexel University, and an Associate Member of CanChild.
Robert J. Palisano
Robert J. Palisano, PT, ScD, FAPTA is a Distinguished Professor in the Department of Physical Therapy and Rehabilitation Sciences at Drexel University, and a Scientist at CanChild.
Lisa Avery
Lisa Avery, MSc is Statistics Lecturer at the University of Otago.
Steven Hanna
Steven E. Hanna, PhD is a Professor in the Department of Health Research Methods, Evidence, and Impact at McMaster University.
References
- Alghamdi, M., Chiarello, L. A., Palisano, R., & McCoy, S. (2017). Understanding participation of children with cerebral palsy in family and recreational activities. Research in Developmental Disabilities, 69, 96–104. https://doi.org/10.1016/j.ridd.2017.07.006
- Anaby, D., Law, M., Teplicky, R., & Turner, L. (2015). Focusing on the environment to improve youth participation. International Journal of Environmental Research and Public Health, 12(10), 13388–13398. https://doi.org/10.3390/ijerph121013388
- Anaby, D., Hand, C., Bradley, L., DiRezze, B., Forhan, M., DiGiacomo, A., & Law, M. (2013). The effect of the environment on participation of children and youth with disabilities: a scoping review. Disability and Rehabilitation, 35(19), 1589–1598. https://doi.org/10.3109/09638288.2012.748840
- Bartlett, D. J., Galuppi, B., Palisano, R. J., & McCoy, S. W. (2016). Consensus classifications of gross motor, manual ability, and communication function classification systems between therapists and parents of children with cerebral palsy. Developmental Medicine & Child Neurology, 58(1), 98–99. https://doi.org/10.1111/dmcn.12933
- Bartlett, D. J., Gorter, J. W., Jeffries, L. M., Avery, L., Hanna, S. E., McCoy, W., Chiarello, L., Palisano, R., Fiss, A., Galuppi, B., Smersh, M., Diller, L., Drew, P., Ford, N., Gilbert, M., Hjorngaard, T., Rayfield, K., & Taylor, S., On Track Study Team. (2018b). Longitudinal trajectories and reference centiles for the impact of health conditions on daily activities of children with cerebral palsy. Developmental Medicine & Child Neurology, 61(4), 469–476. https://doi.org/10.1111/dmcn.14080
- Bartlett, D., McCoy, S., Chiarello, L. A., Avery, L., & Galuppi, B., On Track Study Team. (2018a). A collaborative approach to decision making through developmental monitoring to provide individualized services for children with cerebral palsy. Physical Therapy, 98(10), 865–875. https://doi.org/10.1093/ptj/pzy081
- Carey, H., & Long, T. (2012). The pediatric therapist’s role in promoting and measuring participation in children with disabilities. Pediatric Physical Therapy, 24, 163–170.
- Chiarello, L. A. (2017). Excellence in promoting participation: Striving for the 10 Cs. Pediatric Physical Therapy, 29, S16–S22. https://doi.org/10.1097/PEP.0000000000000382
- Chiarello, L. A., Bartlett, D., Palisano, R., McCoy, S., Fiss, A., Jeffries, L., & Wilk, P. (2016). Determinants of participation in family and recreational activities of young children with cerebral palsy. Disability and Rehabilitation, 38(25), 2455–2468. https://doi.org/10.3109/09638288.2016.1138548
- Chiarello, L. A., Palisano, R. J., McCoy, S. W., Bartlett, D. J., Wood, A., Chang, H.-J., Kang, L.-J., & Avery, L. (2014). Child Engagement in Daily Life: A measure of participation for children with cerebral palsy. Disability and Rehabilitation, 36(21), 1804–1816. https://doi.org/10.3109/09638288.2014.882417
- Chiarello, L. A., Palisano, R., Orlin, M., Chang, H., Begnoche, D., & An, M. (2012). Understanding participation of young children with cerebral palsy. Journal of Early Intervention, 34(1), 3–19. https://doi.org/10.1177/1053815112443988
- Coster, W., Law, M., Bedell, G., Khetani, M., Cousins, M., & Teplicky, R. (2012). Development of the participation and environment measure for children and youth: conceptual basis. Disability and Rehabilitation, 34(3), 238–246. https://doi.org/10.3109/09638288.2011.603017
- Eliasson, A. C., Krumlinde-Sundholm, L., Rösblad, B., Beckung, E., Arner, M., Öhrvall, A. M., & Rosenbaum, P. (2006). The Manual Ability Classification System (MACS) for children with cerebral palsy: scale development and evidence of validity and reliability. Developmental Medicine & Child Neurology, 48(7), 549–554. https://doi.org/10.1017/S0012162206001162
- Fiss, A. L., McCoy, S. W., Bartlett, D., Avery, L., & Hanna, S., On Track Study Team. (2019). Developmental trajectories for the early clinical assessment of balance by gross motor function classification system level for children with cerebral palsy. Physical Therapy, 99(2), 217–228. https://doi.org/10.1093/ptj/pzy132
- Gorter, J. W., Rosenbaum, P. L., Hanna, S. E., Palisano, R. J., Bartlett, D. J., Russell, D. J., Walter, S. D., Raina, P., Galuppi, B. E., & Wood, E. (2004). Limb distribution, type of motor disorder and functional classification of cerebral palsy: How do they relate? Developmental Medicine & Child Neurology, 46(07), 461–467. https://doi.org/10.1017/S0012162204000763
- Granlund, M. (2013). Participation—challenges in conceptualization, measurement and intervention. Child: Care, Health and Development, 39(4), 470–473. https://doi.org/10.1111/cch.12080
- Hammal, D., Jarvis, S. N., & Colver, A. F. (2004). Participation of children with cerebral palsy is influenced by where they live. Developmental Medicine & Child Neurology, 46(5), 292–298. https://doi.org/10.1017/S0012162204000489
- Hanna, S. E., Bartlett, D. J., Rivard, L. M., & Russell, D. J. (2008). Reference curves for the Gross Motor Function Measure: percentiles for clinical description and tracking over time among children with cerebral palsy. Physical Therapy, 88(5), 596–607. https://doi.org/10.2522/ptj.20070314
- Hidecker, M. J. C., Paneth, N., Rosenbaum, P. L., Kent, R. D., Lillie, J., Eulenberg, J. B., Chester Jr, K. E. N., Johnson, B., Michalsen, L., Evatt, M., & Taylor, K. (2011). Developing and validating the Communication Function Classification System (CFCS) for individuals with cerebral palsy. Developmental Medicine & Child Neurology, 53(8), 704–710. https://doi.org/10.1111/j.1469-8749.2011.03996.x
- Imms, C., & Adair, B. (2017). Participation trajectories: impact of school transitions on children and adolescents with cerebral palsy. Developmental Medicine & Child Neurology, 59(2), 174–182. https://doi.org/10.1111/dmcn.13229
- Imms, C. (2008). Children with cerebral palsy participate: A review of the literature. Disability and Rehabilitation, 30(24), 1867–1884. https://doi.org/10.1080/09638280701673542
- Imms, C., Adair, B., Keen, D., Ullenhag, A., Rosenbaum, P., & Granlund, M. (2016). Participation”: a systematic review of language, definitions, and constructs used in intervention research with children with disabilities. Developmental Medicine & Child Neurology, 58(1), 29–1104. https://doi.org/10.1111/dmcn.12932
- Imms, C., Granlund, M., Wilson, P. H., Steenbergen, B., Rosenbaum, P. L., & Gordon, A. M. (2017). Participation, both a means and an end: A conceptual analysis of processes and outcomes in childhood disability. Developmental Medicine & Child Neurology, 59, 16–25. https://doi.org/10.1111/dmcn.13237
- Imms, C., Reilly, S., Carlin, J., & Dodd, K. J. (2009). Characteristics influencing participation of Australian children with cerebral palsy. Disability and Rehabilitation, 31(26), 2204–2215. https://doi.org/10.3109/09638280902971406
- Khetani, M. A., Graham, J. E., Davies, P. L., Law, M. C., & Simeonsson, R. J. (2015). Psychometric properties of the Young Children’s Participation and Environment Measure. Archives of Physical Medicine and Rehabilitation, 96(2), 307–316. https://doi.org/10.1016/j.apmr.2014.09.031
- King, G., Law, M., Hanna, S., King, S., Hurley, P., Rosenbaum, P., Kertoy, M., & Petrenchik, T. (2006). Predictors of the leisure and recreation participation of children with physical disabilities: A structural equation modeling analysis. Children's Health Care, 35(3), 209–234. https://doi.org/10.1207/s15326888chc3503_2
- King, G., Law, M., King, S., Hurley, P., Hanna, S., Kertoy, M., Rosenbaum, P., & Young, N. (2004). Children’s Assessment of Participation and Enjoyment (CAPE) and Preferences for Activities of Children (PAC). Harcourt Assessment.
- Law, M., Anaby, D., Imms, C., Teplicky, R., & Turner, L. (2015). Improving the participation of youth with physical disabilities in community activities: an interrupted time series design. Australian Occupational Therapy Journal, 62(2), 105–115. https://doi.org/10.1111/1440-1630.12177
- Law, M., King, G., Petrenchik, T., Kertoy, M., & Anaby, D. (2012). The assessment of preschool children’s participation: internal consistency and construct validity. Physical & Occupational Therapy in Pediatrics, 32(3), 272–287. https://doi.org/10.3109/01942638.2012.662584
- Majnemer, A., Shevell, M., Law, M., Birnbaum, R., Chilingaryan, G., Rosenbaum, P., & Poulin, C. (2008). Participation and enjoyment of leisure activities in school-aged children with cerebral palsy. Developmental Medicine & Child Neurology, 50(10), 751–758. https://doi.org/10.1111/j.1469-8749.2008.03068.x
- Majnemer, A., Shikako-Thomas, K., Schmitz, N., Shevell, M., & Lach, L. (2015). Stability of leisure participation from school-age to adolescence in individuals with cerebral palsy. Research in Developmental Disabilities, 47, 73–79. https://doi.org/10.1016/j.ridd.2015.08.009
- Masters, G. N., & Wright, B. D. (1982). Rating scale analysis: Rasch measurement. Mesa Press.
- McCoy, S. W., Bartlett, D., Smersh, M., Galuppi, B., Hanna, S, Collaboration Group: On Track Study Team. (2018). Monitoring development of children with cerebral palsy: the On Track study. Protocol of a longitudinal study of development and services. Retrieved December 26, 2018, from https://www.canchild.ca/en/resources/294-monitoring-development-of-children-with-cerebralpalsy-the-on-track-study-protocol-of-a-longitudinal-study-of-development-and-services.
- McCoy, S., Bartlett, D., Palisano, R., Chiarello, L. A., Jeffries, L., Fiss, A., …Taylor, B. S. (2019). Understanding the development of children with cerebral palsy and how therapy may affect patient-centered outcomes. Washington, DC: Patient-Centered Outcomes Research Institute (PCORI). https://doi.org/10.25302/7.2019.CE.12115321
- Muggeo, V., Sciandra, M., Tomasello, A., & Calvo, S. (2013). Estimating growth charts via nonparametric quantile regression: a practical framework with application in ecology. Environmental and Ecological Statistics, 20(4), 519–531. https://doi.org/10.1007/s10651-012-0232-1
- Palisano, R. J., Almarsi, N., Chiarello, L. A., Orlin, M. N., Bagley, A., & Maggs, J. (2010). Family needs of parents of children and youth with cerebral palsy. Child: Care, Health and Development, 36(1), 85–92. https://doi.org/10.1111/j.1365-2214.2009.01030.x
- Palisano, R. J., Chiarello, L. A., Orlin, M., Oeffinger, D., Polansky, M., Maggs, J., Bagley, A., & Gorton, G., and the Children’s Activity and Participation Group. (2011). Determinants of intensity of participation in leisure and recreational activities by children with cerebral palsy. Developmental Medicine & Child Neurology, 53(2), 142–149. https://doi.org/10.1111/j.1469-8749.2010.03819.x
- Palisano, R. J., Rosenbaum, P. L., Walter, S., Russell, D., Wood, E., & Galuppi, B. (2008). Development and reliability of a system to classify gross motor function in children with cerebral palsy. Developmental Medicine & Child Neurology, 39(4), 214–223. https://doi.org/10.1111/j.1469-8749.1997.tb07414.x
- Palisano, R., Chiarello, L. A., King, G., Novak, I., Stoner, T., & Fiss, A. (2012). Participation-based therapy for children with physical disabilities. Disability and Rehabilitation, 34(12), 1041–1052. https://doi.org/10.3109/09638288.2011.628740
- Palisano, R., Chiarello, L. A., McCoy, S., Bartlett, D., & An, M. (2015). Use of the Child Engagement in Daily Life and Ease of Caregiving for Children to measure change in young children with cerebral palsy. Physical & Occupational Therapy in Pediatrics, 35(3), 280–295. https://doi.org/10.3109/01942638.2014.907221
- Palisano, R., Rosenbaum, P., Bartlett, D., & Livingston, M. (2008). Content validity of the expanded and revised Gross Motor Function Classification System. Developmental Medicine & Child Neurology, 50(10), 744–750. https://doi.org/10.1111/j.1469-8749.2008.03089.x
- Pinheiro, B., & Bates, D. (2004). Mixed-Effects Models in S and S-Plus. Springer.
- Pinheiro, J., Bates, D., DebRoy, S., Sarkar, D., Core Team, R. (2018). nlme: Linear and Nonlinear Mixed Effects Models, R package version 3.1-137. https://CRAN.R-project.org/package=nlme.
- Reid, S. M., Carlin, J. B., & Reddihough, D. S. (2011). Using the Gross Motor Function Classification System to describe patterns of motor severity in cerebral palsy. Developmental Medicine & Child Neurology, 53(11), 1007–1012. https://doi.org/10.1111/j.1469-8749.2011.04044.x
- Rosenbaum, P. L., Walter, S. D., Hanna, S. E., Palisano, R. J., Russell, D. J., Raina, P., Wood, E., Bartlett, D. J., & Galuppi, B. E. (2002). Prognosis for gross motor function in cerebral palsy; creation of motor development curves. Journal of the American Medical Association, 288(11), 1357–1363. https://doi.org/10.1001/jama.288.11.1357
- Shikako-Thomas, K., Majnemer, A., Law, M., & Lach, L. (2008). Determinants of participation in leisure activities in children and youth with cerebral palsy: systematic review. Physical & Occupational Therapy in Pediatrics, 28(2), 155–169. https://doi.org/10.1080/01942630802031834
- Williams, U., Law, M., Hanna, S., & Gorter, J. W. (2019). Using the Young Children’s Participation and Environment Measure (YC-PEM) to describe young children’s participation and relationship to disability and complexity. Journal of Developmental and Physical Disabilities, 31(1), 135–148. October 22, https://doi.org/10.1111/cch.12621
- Willse, J. T. (2015). Mixture Rasch Models with JMLE. https://cran.rproject.org/web/packages/mixRasch/mixRasch.pdf.