
Abstract
Purpose: MR temperature imaging (MRTI) was employed for visualizing the spatiotemporal evolution of the exotherm of thermoembolization, an investigative transarterial treatment for solid tumors.
Materials and methods: Five explanted kidneys were injected with thermoembolic solutions, and monitored by MRTI. In three nonselective experiments, 5 ml of 4 mol/l dichloroacetyl chloride (DCA-Cl) solution in a hydrocarbon vehicle was injected via the main renal artery. For two of these three, MRTI temperature data were compared to fiber optic thermal probes. Another two kidneys received selective injections, treating only portions of the kidneys with 1 ml of 2 mol/l DCA-Cl. MRTI data were acquired and compared to changes in pre- and post-injection CT. Specimens were bisected and photographed for gross pathology 24 h post-procedure.
Results: MRTI temperature estimates were within ±1 °C of the probes. In experiments without probes, MRTI measured increases of 30 °C. Some regions had not reached peak temperature by the end of the >18 min acquisition. MRTI indicated the initial heating occurred in the renal cortex, gradually spreading more proximally toward the main renal artery. Gross pathology showed the nonselective injection denatured the entire kidney whereas in the selective injections, only the treated territory was coagulated.
Conclusion: The spatiotemporal evolution of thermoembolization was visualized for the first time using noninvasive MRTI, providing unique insight into the thermodynamics of thermoembolization.
Précis
Thermoembolization is being investigated as a novel transarterial treatment. In order to begin to characterize delivery of this novel treatment modality and aid translation from the laboratory to patients, we employ MR temperature imaging to visualize the spatiotemporal distribution of temperature from thermoembolization in ex vivo tissue.
Introduction
The incidence and mortality rate of hepatocellular carcinoma in the 21st century continue to present significant challenges to modern medicine [Citation1,Citation2]. It is an aggressive disease that frequently is diagnosed at an inoperable stage and responds poorly overall to pharmacologic intervention [Citation3,Citation4]. The Barcelona Clinic Liver Cancer algorithm is perhaps the most commonly used method to guide treatment decisions for patients with intermediate stage hepatocellular carcinoma [Citation5,Citation6]. For those with multifocal disease but preserved liver function and no evidence of vascular invasion, transarterial chemoembolization provides a survival benefit and is considered the standard of care [Citation7,Citation8]. In this procedure, a catheter is advanced into the hepatic artery somewhat upstream from the target lesion or lesions and a combination of cytotoxic drugs and an embolic agent are delivered. This causes ischemia and nutrient deprivation while also leaving a high local dose of chemotherapy. Unfortunately, incomplete treatment frequently leads to recurrence and the need for additional procedures provided the patient can tolerate further intervention. Complete necrosis rates with current embolization methods are inadequate, with residual tumor in up to 90% of cases documented in livers removed from patients who received liver transplants [Citation9]. Incomplete treatment can also incite an aggressive tumor response [Citation10,Citation11]. Recently, there have been reports of clinicians combining ablation and embolization procedures in the same patient [Citation12,Citation13]. Despite the risks and costs from two procedures, this effort has demonstrated very modest additional survival benefit [Citation14]. Notwithstanding a modest positive impact, existing minimally invasive therapies thus leave a significant gap in treatment.
Thermoembolization is a procedure in which an exothermic chemical reaction is delivered via transarterial catheter. Recent investigations into the biological effects of this technique indicate that it might offer unique advantages versus current techniques [Citation15–17]. An exothermic reaction, such as hydrolysis of an acid chloride, could offer a number of different avenues for local tissue destruction based on the distribution of the resulting heat and reaction product(s). For such a treatment strategy to successfully translate to the clinic, it is necessary to understand and characterize the spatiotemporal evolution of the therapy under different doses and delivery protocols. For initial feasibility and development work, the vascular network of the liver does not lend itself well to use as an ex vivo delivery model. Explanted pig kidneys have been previously shown to be excellent tissue models for this type of delivery [Citation18,Citation19] owing to the simple nature of the blood supply, ease of cannulation of the renal artery, and ready availability of tissues.
Proton resonance frequency (PRF) based magnetic resonance temperature imaging (MRTI) is a noninvasive technique capable of measuring the spatiotemporal temperature changes in tissue [Citation20]. We applied MRTI as a tool to investigate the thermal component of thermoembolization. We took effort to corroborate the MRTI’s fidelity, given MRTI has never been applied in the context of thermoembolization. Using MRTI, we report the spatiotemporal heating due to thermoembolization in an explanted kidney.
Materials and methods
Overview
Thermoembolization was accomplished by injection of a solution of dichloroacetyl chloride (DCA-Cl Sigma-Aldrich, St. Louis, MO, USA, used as supplied) dissolved in mineral oil (purchased locally) into the renal arteries of five kidneys. The mineral oil provides an inert solvent for the DCA-Cl. The reagent underwent exothermic hydrolysis in situ, releasing heat energy and producing 2 equivalents of acid (). All kidneys received a transarterial, sequential injection over 25 s consisting of the following: first, 100 μL of mineral oil; second, a reactive aliquot of DCA-Cl dissolved in mineral; and third, 1 ml of mineral oil (). The injected DCA-Cl concentration and volume is described below. Effects were observed via MR, CT, temperature probe, and gross pathology. lists injection conditions. Experiments were conducted on fresh tissue acquired at necropsy from another protocol and Institutional Animal Care and Use Committee approval was not required.
Figure 1. Diagrams of in situ hydrolysis reaction and injection protocol. Upon injection, the DCA-Cl undergoes hydrolysis in the kidney (a). The exothermic reaction produces dichloroacetic acid and HCl and releases -93 kJ/mol of energy. Additionally, a diagram shows the injection sequence (b). The dose of the reactive aliquot, in red, is varied with nonselective or selective injection. DCA-Cl: dichloroacetyl chloride; HCl: hydrochloric acid; kJ: kilojoule; l: liter; mol: mole.
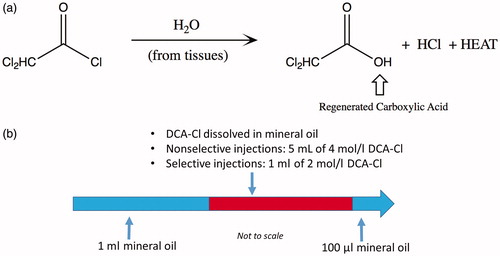
Table 1. Summary of experiments and corresponding Figures.
MR temperature imaging of thermoembolization in five kidneys
MRTI measurements were performed on a 3.0 T MR scanner (750 W, GE Healthcare Technologies, Waukesha, WI, USA) using the body coil for signal excitation with a 32-channel phased-array cardiac coil. Temperature estimation was based on the water proton resonance frequency (PRF) shift of water [Citation22], provided by a 2 D multiple fast gradient-recalled echoes (MFGRE) sequence [Citation23,Citation24] set to output real and imaginary data at each echo time. Parameters for 2 D MFGRE were as follows: time of repetition (TR)/First echo time (TE)/Last TE = 100/1.50/10 ms; 15 total echoes in 3 shots of 5 echoes; echo spacing = 0.604 ms; parallel imaging acceleration factor = 1.5; flip angle = 25°; acquisition matrix = 96 × 96; reconstructed matrix = 256 × 256; field of view = 180 × 180 mm2; number of slices = 5; slice spacing and thickness = 5 mm; receiver bandwidth = ±83.3 kHz; spectral bandwidth = 165 kHz or 13.0 parts per million (ppm); the time per dynamic frame ranged from 20.46 s to 25.94 s in the five experiments.
Validation of MRTI via temperature probes in two kidneys
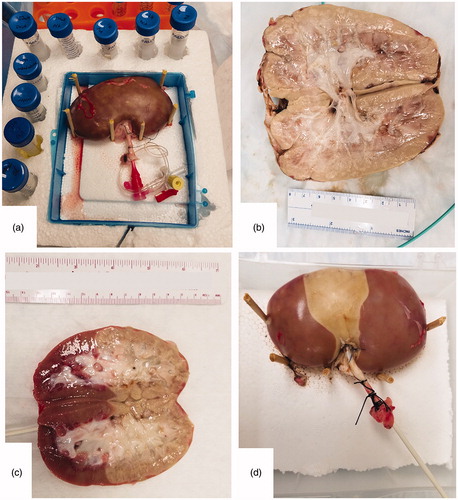
Two experiments were performed with kidneys to correlate MRTI to a fiber optic temperature probe (m3300, Luxtron Corporation, Santa Clara, CA, USA) placed into each kidney’s cortex. For each, the main renal artery of a freshly explanted, heparinized and flushed porcine kidney was cannulated. The kidney was surrounded in a stabilization jig of expanded polystyrene by 15 ml reference vials filled with mineral oil or water (). A pretreatment 3 D T1-weighted (T1W) acquisition was acquired for probe localization (TR/TE/Time of inversion = 6.24/2.49/450 ms; flip angle = 10°; imaged slab = 256 × 256 × 50.4 mm3; acquisition matrix = 256 × 256 × 36; reconstructed matrix = 512 × 512 × 72). To enable access, the experimental setup was momentarily moved out of the magnet bore.
Figure 2. Experimental setup and gross pathology at 24 h. The experimental setup of the kidney and reference vials is shown before a thermoembolization experiment (a). The renal artery is cannulated with a catheter (a). The gross pathology of a nonselective injection experiment is demonstrated in (b), 24 h post-injection. 24 h after injection, gross pathology images for the two selective injection experiments are shown in (c) and (d). (c) shows a bivalve kidney whereas surface damage is visible in (d).
Both kidneys received a transarterial, sequential injection over 25 s consisting of 100 μl of mineral oil, then a reactive aliquot of 5 ml of 4 mol/l DCA-Cl dissolved in mineral oil, and finally 1 ml of mineral oil. The injections were nonselective – i.e., the injected material entered the main renal artery and was not directed to any particular arterial branch. Injections were completed over a period of 25 s. For each, the experimental setup was returned to the magnet isocenter and MRTI commenced. In one case, the MRTI began 35 s after heating was first detected in the temperature probe and was terminated after acquiring 700 s (11.7 min or 27 frames). For the other case, MRTI began 165 s (2.8 min) after heating was detected in the probe and was terminated after acquiring 736 s (12.3 min or 29 frames). At 24 h post-procedure, the kidneys were bisected to reveal the extent of tissue damage and photographed for gross pathology. By approximately one hour post-injection, the kidneys were stored in a 4 °C refrigerator between injection and bisection.
Three kidney experiments monitored by continuous MRTI and pre-/post-injection CT
For three kidney experiments, MRTI began before the reactive injection, in order to establish a baseline phase measurement of material at a homogeneous temperature. For the first of these experiments, the injection was the same as the previous two – nonselective with a reactive aliquot of 5 ml of 4 mol/l DCA-Cl. For the remaining two, a selective cannulation approach directed the injection to one half of the kidney and the volume was reduced to 1 ml of 2 mol/l DCA-Cl. The two selective injection cases were monitored for 1117 s (18.6 min or 50 frames) and 1125 s (18.8 min or 55 frames). The nonselective case was monitored for 777 s (13.0 min or 38 frames).
Additionally, one of the selective injection kidneys was scanned prior to and 45 min post-injection using computed tomography (CT) on a SOMATOM Definition Force (Siemens Healthineers, Forchheim Germany) to visualize distribution of material. Dual-source acquisition parameters for CT imaging were as follows: peak tube voltage = 80/Sn150 kVp and tube current = 632/316 mA for tube A and B, respectively; rotation time = 0.285 s; pitch = 0.6; collimation = 128 × 0.6; CTDIvol=12.5 mGy. By approximately two hours post-injection, the kidneys were stored in a 4 °C refrigerator, then bisected and photographed at 24 h post-injection for gross pathology.
MR and CT image post-processing
The real and imaginary data output by the MFGRE were saved as DICOM and processed offline in MATLAB 2018a (Mathworks, Natick, MA, USA). Using a single-peak auto-regressive moving average model and solved via the Steiglitz-McBride algorithm [Citation23,Citation25–27], the frequency shift of the water peak at each pixel and time point was calculated by fitting a single peak to the data. Next, a baseline reference frequency map was created using the peak at the first time point. A frequency difference map was then generated for each successive time point by calculating difference images between the dynamic time point frequency map and the baseline frequency map. A temperature map at each time point could then be generated from the frequency difference map using the temperature coefficient for water, α= −0.01 parts per million (ppm)/°C [Citation23]. This PRF-based MRTI method requires a baseline time frame for comparison to later times; any measured temperature changes are relative measurements, referenced to the temperature at the baseline frame. A 2 × 2 voxel region-of-interest (ROI) from MRTI was spatially-matched to the temperature probe’s location for temperature accuracy comparison. In both experiments, MRTI temperature precision was characterized by the standard deviation of temperature at each time frame of a 10 × 10 voxel ROI from an unheated reference vial. Additionally, the phase data underpinning the MRTI exhibited a phase drift due to gradient heating that was approximately linear in space and time for our magnet. The change in this drift over time was on the order of the main magnet field specification provided by the vendor. A linear fit of the phase drift in time and the ‘z-axis’ of the magnet – i.e., the axis in and out of the bore – was applied to correct for this effect [Citation28,Citation29]. Drift correction is further explained in the Supplementary Appendix.
The CT data were reconstructed at slice thickness = 0.6 mm; slice interval = 0.6 mm; kernel = Br40d; and ADMIRE strength = 2. The images were post-processed to generate a synthesized conventional CT image (‘mixed’, M = 0.5) and reformatted into coronal projections with an image thickness of 5 mm. The reformatted images had a minimum intensity projection filter with inverted grayscale to identify low HU values.
Results
Validation of MRTI via temperature probes in two kidneys
The nonselective injection resulted in coagulation of the entire kidney () in both specimens. For both cases, the 2 × 2 voxel ROI comparing MRTI and temperature showed excellent agreement (). Throughout each MRTI acquisition, the standard deviation (σ) of the unheated reference’s 10 × 10 voxel ROI never exceeded 0.21 °C; consequently, ±2σ was always less than 1 °C. The difference of the probe and the spatially-matched MRTI never exceeded 1 °C through the entire acquisition; further characterization of MRTI-to-probe accuracy and precision are shown in .
Figure 3. MRTI vs. thermal probe. Left (a) is a coronal T1-weighted image of the kidney before injection, surrounded by the reference vials. The blue arrow indicates the location of the thermal probe in the renal cortex. Right (b) compares the temperature probe data (black line) with a spatially-matched 2 × 2 voxel region of interest (ROI) from the MRTI (green). The plotted ROI temperature (b) data in has ±2σ error bars where σ is the standard deviation of temperature of a 10 × 10 voxel region of a reference vial, at each time point. The location of the noise ROI is at the red square (a). MRTI: magnetic resonance thermal imaging; ROI: region-of-interest; and σ: standard deviation.
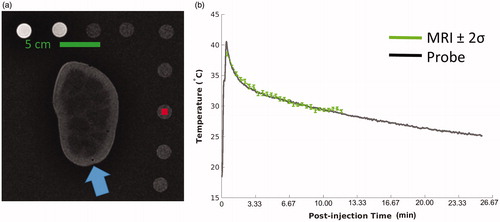
Table 2. Comparison of MRTI and fiber optic temperature probe data.
Three kidney experiments monitored by continuous MRTI and pre-/post-injection CT
In these three cases, the injection occurred during the third and fourth time frames of the dynamic MRTI. The two selective injections caused a clearly demarcated partial, segmental coagulation of the kidney (), whereas the nonselective injection again produced complete coagulation. The asymmetry of the selective injections was recapitulated in the MRTI ( and ) and the pre-/post-treatment CT images (). By the end of the MRTI acquisition, and show that the temperature in each kidney was still elevated and unlikely that it had peaked before monitoring had ceased. demonstrates that the heating occurs diffusely and distally first and manifests in the larger vasculature later.
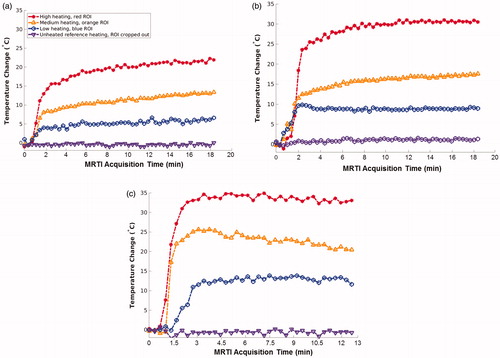
Figure 4. Selected ROI locations. MRTI data are shown from the three experiments with homogeneous baseline temperatures. Each image is a coronal temperature map of the kidney after injection, at a late time point and has three colored circles (indicated by white arrows) denoting the locations of three 2 × 2 voxel ROIs. The ROI temperature histories are plotted in , and ROI points are color-matched to the data points of . The surrounding reference vials are cropped. MRTI: magnetic resonance temperature imaging; ROI: region-of-interest.
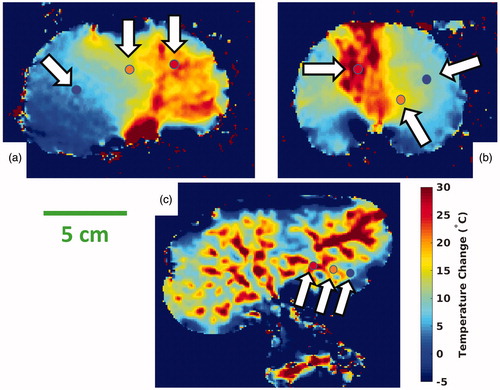
Figure 5. Time elapsed MRTI. From an experiment with a homogeneous baseline temperature, a single coronal slice demonstrates the time evolution of temperature. Every other time frame image is displayed to simplify presentation. The heating is diffuse initially at 1.5 min. Heating intensifies in the small vessels of the renal cortex, during the interval of 2.2–4.5 min. Finally, heating appears in the larger upstream vessels extending proximally back toward the main renal artery, at 5.2 min and later. MRTI: magnetic resonance thermal imaging.
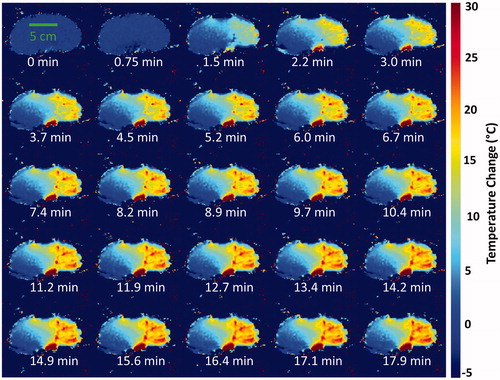
Figure 6. Comparison of CT and MRTI. The pre- (a) and 45-min post-injection (b) CT images of a selective injection experiment are juxtaposed. Both coronal reformatted CT images are inverted grayscale minimum intensity projections that are 5 mm thick. Window/level settings are 168/33. The CT minimum intensity projection and intensity inversion depict the post-injection presence of the mineral oil associated with the heating indicated on MRTI. CT: Computed tomography; MRTI: magnetic resonance thermal imaging.
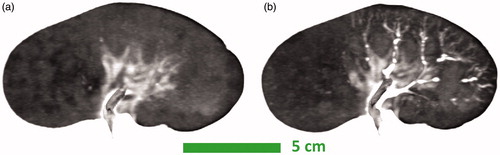
Figure 7. Selected ROI plots. These three plots show temperature data at the locations indicated by the color-matched ROI locations in ; an ROI is a 2 × 2 voxel region. The ROI locations of correspond with (a), etc. The purple data points are from unheated reference vials, which are cropped out of the images in . The rapid and large temperature rise is clearly shown, along with the unexpected result that cooling had not occurred at termination of data collection in each case. MRTI: magnetic resonance temperature imaging; ROI: region-of-interest.
Discussion
The spatiotemporal distribution of heating during thermoembolization was investigated for the first time using an established noninvasive PRF-based method, MRTI. Thermoembolization is a novel approach to solid tumor therapy and potentially has several acute and longitudinal tissue insults: (1) embolization/ischemia, (2) heat, (3) lower local pH, (4) a high local osmolar tissue environment, (5) covalent modification of glycoproteins, and (6) the acid of the acid-chloride can be selected to have anti-tumor drug effects—namely, dichloroacetate has been studied as a drug to inhibit aerobic glycolysis or Warburg metabolism [Citation30,Citation31]. Characterizing the temperature response for different treatment delivery paradigms is an important element for further development of thermoembolization as a therapeutic modality. Therefore, this work we specifically focused on the induced spatiotemporal distribution of heating, which was measured noninvasively using PRF-based MRTI. We validated the MFGRE acquisitions with temperature probes and used this same sequence to track temperature changes during thermoembolization.
The observation of sustained heating coming from the vasculature containing the thermoembolic agent that lasted in excess of 15 min was an unexpected result. Consequently, this led to careful reconsideration and retesting of our MRTI acquisition to verify this result was indeed the case. The MFGRE pulse sequence relies on the temperature sensitivity of the chemical-shift of water protons that are measured using relative shifts in the water resonance over time. To ensure the fidelity of our results, we considered the impact of non-thermal sources of PRF-shift that could confound an accurate temperature measurement, due to non-thermal magnetic field changes on either microscopic or macroscopic scales. Potential confounding mechanisms that were considered include: (1) main magnetic field drift over the acquisition duration, (2) the susceptibility change from the motion of the injected material, and (3) pH changes due to the acidic reaction products.
In order to rule out the impact of these various effects and establish accuracy of the temperature estimates in the presence of thermoembolization, we obtained multiple, independent lines of corroborating evidence suggesting the MFGRE accurately measures temperature. Regarding the main magnetic field drift, correction was necessary. In these experiments, linear spatiotemporal fits [Citation28,Citation29] of the temperature drift in the thermally isolated reference vials were sufficient to reduce temperature drift errors to <0.5 °C versus baseline; drift data are available in the Supplementary Figure A2. Regarding the deleterious potential of susceptibility effects, the congruence of the two temperature probes’ data—which tended to be in the periphery—and MRTI is the strongest evidence of robust temperature accuracy for MFGRE. Meanwhile, the two selective injections were recapitulated in gross pathology, CT, and MRTI. Regarding PRF-shift due to pH change, available NMR literature has record of water protons experiencing a PRF shift of -0.002 ppm/unit of pH change versus the PRF shift temperature coefficient of α = −0.01 ppm/°C [Citation21]. Therefore, an extreme pH shift from 7.5 to 1 would only represent about 1.3 °C of error, a relatively small error in context of a > 10 °C change. Therefore, pH shift is unlikely a significant variable in this context.
Additionally, there were several limitations of the experimental design. Practical constraints with the temperature probes in the initial required that the injection occur outside the magnet, thus MRTI began after a delay in the two probe experiments. As a consequence, the referenced-based MRTI measurement began in the midst of a heterogeneously heated environment. However, for a fixed spatial position, the subsequent temperature measurements were accurate, based on agreement with the temperature probe by temporally registering the probe and MRTI data. To address this, in the second group of three experiments, injections were performed with the experiment at isocenter. These three experiments’ limitations were the absence of a temperature probe and a CT-MR multi-modality imaging fiducial for registration between the various CT and MR acquisitions. In all five experiments, the temporal duration of heating is not known because MRTI and probe measurements had to be terminated before the temperatures returned to the ambient temperature.
For the three experiments with homogenous baseline temperature, the sequence of heating events () yields some qualitative insights into the physical chemistry of thermoembolization, uniquely provided by MRTI. We believe the DCA-Cl hydrolysis reaction is not immediately completed following injection. Our data shows heating for many minutes for the quantities injected, suggesting a diffusion-limited reaction. As such, the DCA-Cl hydrolysis rate may be dependent on the vascular surface area available to the injection. In , the heating is initially diffuse and in the cortex. Later, the heating increases near larger vessels proximally toward the main renal artery. The temporal order of this heating is consistent with the surface area of the tissue interface available to interact with the DCA-Cl. Namely, the immediate hydrolysis is greatest in the subvoxel distal vasculature – i.e., the diffuse heating – and then manifests in the spatially resolved vasculature, first in smaller cortical vasculature and followed later by larger vessels. Accepting the speculation that DCA-Cl hydrolysis continues over a time scale of minutes, the temporally protracted reaction explains why the heating of thermoembolization lasts much longer than other thermal ablation treatment modalities after ceasing application (e.g., radiofrequency ablation). In order to shift from a qualitative hypothesis to a quantitative understanding, future work is required.
MRTI was an effective tool for measuring the heat distribution to characterize thermoembolization delivery in this initial study. In future work, the primary objectives will be understanding distribution of the embolic agent, the heat distribution, and the resulting ablation in an in vivo model. For a perfused in vivo thermoembolization, the heating dynamics are expected to be different than this work’s unperfused ex vivo kidney experiments. However, prior work has demonstrated the acute and durable termination of perfusion of in vivo porcine liver [Citation17], suggesting the exothermic injection will remain in the vessel and heat adjacent tissue. While a robust means of predicting damage attributed to thermoembolization is not yet proposed, MRTI makes modeling treatment outcomes more plausible. In future work, the application of existing thermal dose models should be investigated – i.e., cumulative effective minutes at 43 °C (CEM43) or Arrhenius models. The theory and practice of thermal damage of tissue is sufficiently generalized as to be broadly useful [Citation32–35]. However, we are unaware of a dose model combining heat and pH and salt, which is the context of thermoembolization. The combination has been studied in limited contexts [Citation36–38]. If existing thermal dose models are unsuccessful, it may be possible to modify a thermal damage model by accounting for both pH and osmotic stress, and thereby predict dose-response relationships in thermoembolization. Creating such a model necessitates imaging a volume through time, which MRTI uniquely provides. Motion correction in MRTI is another important issue that will also need to be addressed in future work if this technique is to be employed [Citation39–44], to characterize thermoembolization in vivo.
Thermoembolization is a new potential therapy inspired by previous transarterial interventions in liver and kidney. The exotherm produced by the hydrolysis reaction in thermoembolization was successfully visualized in multiple 2 D slices and over time, PRF based thermometry demonstrated sustained heating emanating from the vasculature, persisting in excess of 15 min and reaching maximum temperature increases of >30 °C. MRTI is an effective method for monitoring thermoembolization.
Supplemental Material
Download PDF (431.1 KB)Disclosure statement
No authors have financial interest with this work. RR Layman receives research support from Siemens Healthineers for unrelated effort.
Additional information
Funding
References
- Massarweh NN, El-Serag HB. Epidemiology of hepatocellular carcinoma and intrahepatic cholangiocarcinoma. Cancer Control. 2017;24:107327481772924.
- Torre LA, Bray F, Siegel RL, et al. Global cancer statistics, 2012. CA: A Cancer Journal for Clinicians. 2015;65:87–108.
- Cabrera R. Systemic targeted therapy beyond sorafenib. Clin Liver Dis. 2012;1:212–216.
- Kim DW, Talati C, Kim R. Hepatocellular carcinoma (HCC): beyond sorafenib—chemotherapy. J Gastrointest Oncol. 2017;8:256–265.
- Forner A, Llovet JM, Bruix J. Hepatocellular carcinoma. Lancet. 2012;379:1245–1255.
- Mokdad AA, Singal AG, Yopp AC. Advances in local and systemic therapies for hepatocellular cancer. Curr Oncol Rep. 2016;18:9.
- Lencioni R, de Baere T, Soulen MC, et al. Lipiodol transarterial chemoembolization for hepatocellular carcinoma: a systematic review of efficacy and safety data. Hepatology. 2016;64:106–116.
- Soydal C, Arslan MF, Kucuk ON, et al. Comparison of survival, safety, and efficacy after transarterial chemoembolization and radioembolization of Barcelona Clinic Liver Cancer stage B-C hepatocellular cancer patients. Nuclear Med Commun. 2016;37:646–649.
- Marin HL, Furth EE, Olthoff K, et al. Histopathologic outcome of neoadjuvant image-guided therapy of hepatocellular carcinoma. J Gastroint Liver Dis. 2009;18:169–176.
- Ahmed M, Kumar G, Moussa M, et al. Hepatic radiofrequency ablation-induced stimulation of distant tumor growth is suppressed by c-Met inhibition. Radiology. 2015;279:150080.
- Moussa M, Goldberg SN, Kumar G, et al. Radiofrequency ablation–induced upregulation of hypoxia-inducible factor-1α can be suppressed with adjuvant bortezomib or liposomal chemotherapy. J Vasc Intervent Radiol. 2014;25:1972–1982.
- Lee H-j, Kim JW, Hur YH, et al. Combined therapy of transcatheter arterial chemoembolization and radiofrequency ablation versus surgical resection for single 2–3 cm hepatocellular carcinoma: a propensity-score matching analysis. J Vasc Intervent Radiol. 2017;28:1240–1247.e3.
- Yang W-Z, Jiang N, Huang N, et al. Combined therapy with transcatheter arterial chemoembolization and percutaneous microwave coagulation for small hepatocellular carcinoma. World J Gastroenterol. 2009;15:748–752.
- Peng Z-W, Zhang Y-J, Chen M-S, et al. Radiofrequency ablation with or without transcatheter arterial chemoembolization in the treatment of hepatocellular carcinoma: a prospective randomized trial. J Clin Oncol. 2013;31:426–432.
- Cressman ENK, Guo C. Feasibility study using tissue as reagent for cancer therapy: endovascular ablation via thermochemistry. Converg Sci Phys Oncol. 2018;4:025003.
- Cressman ENK, Guo C. First in vivo test of thermoembolization: turning tissue against itself using transcatheter chemistry in a porcine model. Cardiovasc Intervent Radiol. 2018;41:1611–1617.
- Cressman ENK, Guo C, Karbasian N. Image-guided chemistry altering biology: an in vivo study of thermoembolization. Plos One. 2018;13:e0200471.
- Dondelinger RF, Ghysels MP, Brisbois D, et al. Relevant radiological anatomy of the pig as a training model in interventional radiology. Eur Radiol. 1998;8:1254–1273.
- Evan AP, Connors BA, Lingeman JE, et al. Branching patterns of the renal artery of the pig. Anat Rec. 1996;246:217–223.
- Rieke V, Butts Pauly K. MR thermometry. J Magn Reson Imaging. 2008;27:376–390.
- Wishart D, Bigam C, Yao J, et al. 1H, 13C and 15N chemical shift referencing in biomolecular NMR. J Biomol Nmr. 1995;6:135–140.
- Ishihara Y, Calderon A, Watanabe H, et al. A precise and fast temperature mapping using water proton chemical shift. Magn Reson Med. 1995;34:814–823.
- Taylor BA, Hwang K-P, Elliott AM, et al. Dynamic chemical shift imaging for image-guided thermal therapy: analysis of feasibility and potential. Med Phys. 2008;35:793–803.
- Taylor BA, Hwang K-P, Hazle JD, et al. Autoregressive moving average modeling for spectral parameter estimation from a multigradient echo chemical shift acquisition. Med Phys. 2009;36:753–764.
- Candy JV. Model-based signal processing. Hoboken, NJ: IEEE Press; 2006. pp. 677.
- Steiglitz K, McBride L. A technique for the identification of linear systems. IEEE Trans Automat Contr. 1965;10:461–464.
- Stoica P, Soderstrom T. The Steiglitz-McBride identification algorithm revisited–Convergence analysis and accuracy aspects. IEEE Trans Automat Contr. 1981;26:712–717.
- MacLellan CJ, Fuentes D, Prabhu S, et al. A methodology for thermal dose model parameter development using perioperative MRI. Int J Hyperthermia. 2018;34:687–696.
- Salomir R, Viallon M, Kickhefel A, et al. Reference-free PRFS MR-thermometry using near-harmonic 2-D reconstruction of the background phase. IEEE Trans Med Imaging. 2012;31:287–301.
- Kankotia S, Stacpoole PW. Dichloroacetate and cancer: New home for an orphan drug? Biochimica et Biophysica Acta (BBA) - Reviews on Cancer. 2014;1846:617–629.
- Michelakis ED, Webster L, Mackey JR. Dichloroacetate (DCA) as a potential metabolic-targeting therapy for cancer. Br J Cancer. 2008;99:989–994.
- Dewey WC. Arrhenius relationships from the molecule and cell to the clinic. Int J Hyperthermia. 1994;10:457–483.
- Dewhirst MW, Viglianti BL, Lora-Michiels M, et al. Basic principles of thermal dosimetry and thermal thresholds for tissue damage from hyperthermia. Int J Hyperthermia. 2003;19:267–294.
- Pearce JA. Comparative analysis of mathematical models of cell death and thermal damage processes. Int J Hyperthermia. 2013;29:262–280.
- Sapareto SA, Dewey WC. Thermal dose determination in cancer therapy. Int J Radiat Oncol Biol Phys. 1984;10:787–800.
- Byron B, Hendrix M, Wharton PS. The effect of variation of pH upon the process of heat denaturation of egg albumin. J Biol Chem. 1934;105:633–642.
- Ho QT, Murphy KM, Drapala KP, et al. Effect of pH and heat treatment on viscosity and heat coagulation properties of milk protein concentrate. Int Dairy J. 2018;85:219–224.
- Raaphorst GP, Azzam EI. A comparison of the fixation of X-ray or heat damage in chinese hamster cells exposed to anisotonic salt solutions. Int J Radiat Biol Relat Stud Phys Chem Med. 1981;39:689–695.
- Rieke V, Instrella R, Rosenberg J, et al. Comparison of temperature processing methods for monitoring focused ultrasound ablation in the brain. J Magn Reson Imaging. 2013;38:1462–1471.
- Andreychenko A, Denis de Senneville B, Navest RJM, et al. Respiratory motion model based on the noise covariance matrix of a receive array. Magn Reson Med. 2018;79:1730–1735.
- Bour P, Ozenne V, Marquet F, et al. Real-time 3D ultrasound based motion tracking for the treatment of mobile organs with MR-guided high-intensity focused ultrasound. Int J Hyperthermia. 2018;34:1225–1235.
- Diodato A, Cafarelli A, Schiappacasse A, et al. Motion compensation with skin contact control for high intensity focused ultrasound surgery in moving organs. Phys Med Biol. 2018;63:035017.
- Fuentes D, Yung J, Hazle JD, et al. Kalman filtered MR temperature imaging for laser induced thermal therapies. IEEE Trans Med Imaging. 2012;31:984–994.
- Roujol S, de Senneville BD, Hey S, et al. Robust adaptive extended Kalman filtering for real time MR-thermometry guided HIFU interventions. IEEE Trans Med Imaging. 2012;31:533–542.