
Abstract
Heat shock proteins (HSP) have been associated with a range of persistent inflammatory disorders; however, little research has been conducted on the involvement of HSP in the development of ankylosing spondylitis (AS). The research aims to identify a diagnostic signature based on HSP-related genes and determine the molecular subtypes of AS. We gathered the transcriptional data of patients with AS from the GSE73754 dataset and conducted a literature search for HSP-related genes (HRGs). The logistic regression model was utilized for the identification of hub HRGs associated with AS. Subsequently, these HRGs were employed in the construction of a nomogram prediction model. We employed a consensus clustering approach to identify novel molecular subgroups. Subsequently, we conducted functional analyses, encompassing GO, KEGG, and GSEA, to elucidate the underlying mechanisms between these subgroups. To assess the immunological landscape, we employed the xCell algorithm. Through logistic regression analysis, the four core HRGs (CCT2, HSPA6, DNAJB14, and DNAJC5) were confirmed as potential biomarkers for AS. Subsequent stratification revealed two distinct molecular phenotypes, designated as Cluster 1 and Cluster 2. Notably, Cluster 2 was characterized by the upregulation of pathways pertinent to immune response and inflammation. Our research suggests that the CCT2, HSPA6, DNAJB14, and DNAJC5 exhibit potential as effective blood-based diagnostic biomarkers for AS. These findings contribute to a deeper comprehension of the underlying mechanisms involved in the development of AS and offer potential targets for personalized therapeutic interventions.
Introduction
Ankylosing spondylitis (AS) is a chronic inflammatory rheumatic disease primarily affecting the axial skeleton, leading to pain and progressive spinal stiffness in affected individuals [Citation1,Citation2]. Progressive joint ankylosis can occur as a consequence of this, leading to a significant impact on the patient’s quality of life. An early diagnosis of ankylosing spondylitis is essential in order to alleviate the patient’s burden [Citation3]. Despite advances in understanding the etiology of AS, the precise pathogenic mechanisms remain elusive. The role of genetic predisposition is well-established, with HLA-B27 positivity being a significant risk factor [Citation4,Citation5]. However, not all individuals with this genetic marker develop AS, indicating that other factors, including environmental triggers and additional genetic contributions, play crucial roles in disease development [Citation6,Citation7].
Heat shock proteins (HSP) are highly conserved molecules that primarily function as molecular chaperones to assist in the proper folding of other proteins [Citation8]. Emerging evidence implicates HSP in the pathogenesis of various autoimmune and inflammatory diseases due to their involvement in immune response modulation and antigen presentation [Citation9,Citation10]. In rheumatoid arthritis, it has been observed that HSP exhibit immunoregulatory properties owing to their immunogenic nature [Citation11]. Notably, HSP27, 60, 70, and 90 have been implicated in this process [Citation12]. Several investigations have provided evidence of their involvement in mitigating inflammation. The ability of HSP to suppress arthritis can be attributed to their capacity to promote the release of the anti-inflammatory factor [Citation13,Citation14]. Their potential role in AS, however, has been relatively unexplored. Given the stress-induced nature of HSP expression and the stress-associated pathophysiology of inflammatory diseases, investigating the involvement of HSP-related genes (HRGs) in AS could provide novel insights into the disease’s pathogenesis.
Our study focuses on delineating the contribution of HRGs to AS development. By leveraging bioinformatics approaches and the extensive transcriptional data available from the GSE73754 dataset, we aimed to identify a set of HRGs that could serve as a diagnostic signature for AS. The application of logistic regression models facilitated the identification of hub HRGs with a strong association with AS, offering potential as diagnostic biomarkers. Furthermore, the heterogeneity of AS suggests the existence of distinct molecular subtypes with unique pathogenic pathways and clinical outcomes. We applied consensus clustering to the identified HRGs to unravel these subtypes, hypothesizing that such classification could lead to personalized therapeutic strategies. Functional analyses, including Gene Ontology (GO) enrichment, Kyoto Encyclopedia of Genes and Genomes (KEGG), and Gene Set Enrichment Analysis (GSEA), provided the framework for understanding the biological differences between the molecular subtypes identified. The immunological landscape of AS was also investigated using the xCell algorithm. Through this approach, we aimed to enrich our understanding of the immune cell interactions and pathways that underlie the identified molecular subtypes.
In summary, our research presents a comprehensive analysis of HRGs in the context of AS, offering new perspectives on its pathogenesis and highlighting potential blood-based biomarkers for diagnosis. The discovery of molecular subtypes within AS patients provides a stepping stone toward personalized medicine, guiding future research toward targeted therapeutic interventions that cater to the specific molecular characteristics of AS subgroups.
Methods
Dataset collection and data processing
The GSE73754 dataset, downloaded from the NCBI GEO public database, consisted of a cohort of 20 individuals in the healthy control (HC) group and 52 individuals in the AS group. Prior to the analytical process, the raw matrix files underwent extraction and standardization utilizing the “affy” software package. Subsequently, the gene expression matrix was obtained from the probe expression matrix by employing the annotations from the GPL10558 microarray platform. In addition, we initially amassed a compilation of 97 genes associated with HSP from the relevant literature [Citation15,Citation16].
Differential expression analysis of HRGs
The differential expression analysis between the AS and HC groups was conducted using the limma package in R software, with a significance threshold of p.adj < 0.05. The heatmap and box plot visualizations of the HRGs associated with differential expression were generated using the pheatmap package and ggplot2 package. Furthermore, the significance of each gene’s importance was determined through Friends analysis performed using the R package GOSemSim.
Functional enrichment analysis
We utilized the clusterprofler package to conduct Kyoto Encyclopedia of Genes and Genomes (KEGG) and Gene Ontology (GO) enrichment analyses for the identified HRGs or DEGs. This analysis allowed us to gain valuable insights into the functional annotations and pathways associated with these genes.
Construction and evaluation of the predictive nomogram
HRGs were further refined through a logistic regression analysis utilizing the rms package. In addition, the nomogram was constructed using the rms package. To assess the diagnostic efficacy of both the nomogram and the gene in predicting AS, a Receiver Operating Characteristic (ROC) curve was constructed.
Consensus cluster analysis
To thoroughly investigate the association between HSP and AS, we utilized the ConsensusClusterPlus tool to execute a cluster analysis on AS patients, focusing on their HRGs expression profiles. Classification was accomplished by utilizing the most suitable “k” value obtained from the Cumulative Distribution Function (CDF) curve. Moreover, we conducted a comparative analysis of these subtypes by employing the limma package. Subsequently, the ggplot2 and ComplexHeatmap packages were utilized to generate a visually volcano plot and heatmap, respectively.
Gene set enrichment analysis (GSEA)
To explore the molecular mechanism of AS subgroups, we utilized GSEA to compare differential signaling pathways between the two subgroups. To perform this analysis, we utilized the clusterprofler package. To obtain the gene set information, we downloaded the subset “h.all.v7.4.symbols.gmt” from the Molecular Signatures Database. A statistical significance threshold of p < 0.05 was considered.
Immune microenvironment analysis
xCell was utilized in this study to quantify the infiltration level of immune cells based on gene expression profiles [Citation17]. To evaluate the discrepancy in the proportion of infiltrating immune cells between the two subgroups, ComplexHeatmap and ggplot2 packages were employed to generate a visually heatmap and box plot. Additionally, the relationship between the expression of core HRGs and the infiltration of immune cells was investigated using the ggplot2 package.
Collection of clinical blood samples to validate core gene expression
A total of 14 individuals, including 7 healthy subjects and 7 individuals diagnosed with AS, were recruited for blood sample collection at the First Affiliated Hospital of Heilongjiang University of Traditional Chinese Medicine. Informed consent was obtained from all participants prior to sample collection, ensuring compliance with ethical guidelines. Furthermore, the study procedures were approved by the Ethics Committee at the First Affiliated Hospital of Heilongjiang University of Traditional Chinese Medicine.
Blood samples were subjected to RNA extraction using TRIzol reagent (ThermoFisher, USA). To perform qRT-PCR analysis, the SYBR qPCR Master Mix (Bio-Rad) was utilized. The expression of the primary core HRGs was assessed using the Roche LC480 Real-Time PCR System (Roche). β-actin was used as a reference gene for mRNA normalization. Therelative mRNA expression levels were quantified using the 2–ΔΔCt method.
Results
Identification of HRGs in as
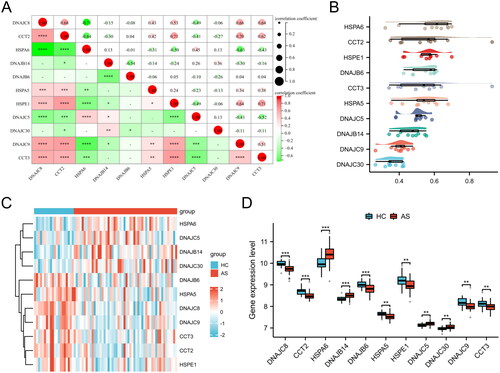
A total of 11 HRGs were identified. To elucidate the interrelationship among these 11 HRGs, a correlation analysis was conducted (). The findings demonstrated a strong synergistic effect between CCT2 and HSPE1 (R = 0.71), while DNAJC8 and HSPA6 exhibited a clear antagonistic action (R = −0.71). The Friends analysis revealed a descending arrangement of genes based on their mean similarity values with other genes. The gene at the topmost position, HSPA6, exhibited the highest level of similarity with other genes, thus indicating its significance as a key gene (). Furthermore, the expression levels of HSPA6, DNAJB14, DNAJC5, and DNAJC30 were found to be significantly elevated in AS blood samples compared to HC blood samples, while the expression levels of DNAJC8, CCT2, DNAJB6, HSPA5, HSPE1, DNAJC9, and CCT3 were significantly reduced in AS blood samples compared to HC blood samples ().
Figure 1. Identification of HRGs in AS. (A) The correlation heatmap of HRGs. Significant positive correlations are indicated by red circles, while significant negative correlations are marked by green circles. The size of the circle and the numeric value within correspond to the strength of the correlation coefficient, with statistical significance annotated by asterisks (*p < 0.05, **p < 0.01, ***p < 0.001, ****p < 0.0001). (B) Friends analysis of HRGs. To demonstrate the differential expression of HRGs between the HC and AS groups, we utilized a heatmap (C) and box plots (D). (**p < 0.01, ***p < 0.001).
Enrichment analysis of HRGs
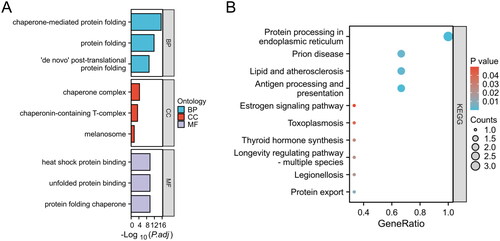
The molecular biological functions of HRGs in AS were determined using GO terms and KEGG pathways (). In the biological process (BP) category, enrichment was observed in chaperone-mediated protein folding and protein folding. The cellular component (CC) category showed enrichment in the chaperone complex and chaperonin-containing T-complex. In the molecular function (MF) category, enrichment was observed in heat shock protein binding and unfolded protein binding. KEGG pathway analysis revealed significant enrichment in pathways such as protein processing in endoplasmic reticulum, prion disease, and lipid and atherosclerosis.
Figure 2. Enrichment analysis of HRGs. (A) GO term enrichment for BP, CC, and MF categories. Enrichment significance is represented as -Log10(P.adj), where P.adj denotes the adjusted p-value for multiple testing corrections. (B) KEGG pathway enrichment analysis. The size of each bubble indicates the count of genes associated with the pathway, while the color corresponds to the p-value. The x-axis, labeled as GeneRatio, represents the ratio of the number of differentially expressed genes involved in a given pathway to the total number of genes that make up that pathway.
Construction and evaluation of the nomogram
By conducting logistic regression analysis on the 11 HRGs, we identified four key genes, namely CCT2, HSPA6, DNAJB14, and DNAJC5, with p values < 0.05. These findings indicate that these genes possess the potential to serve as biomarkers for patients with AS (). In order to enhance the accuracy of predicting the progression of AS, we have constructed a nomogram that integrates four signature genes (CCT2, HSPA6, DNAJB14, and DNAJC5) (). The evaluation of this nomogram using ROC curve analysis yielded an impressive AUC value of 0.87, indicating a good predictive capacity (). The AUC values obtained for the signature genes were the following: CCT2-AUC: 0.809, HSPA6-AUC: 0.788, DNAJB14-AUC: 0.81, and DNAJC5-AUC: 0.718 (). These promising AUC values indicate the good predictive capabilities of the four candidate biomarkers for AS.
Figure 3. Evaluation of predictive biomarkers and model performance for AS risk assessment. (A) Nomogram for predicting the probability of disease risk based on the expression levels of four biomarkers: CCT2, HSPA6, DNAJB14, and DNAJC5. (B) ROC curve for the predictive model. (C) ROC curves for individual biomarkers CCT2, HSPA6, DNAJB14, and DNAJC5.
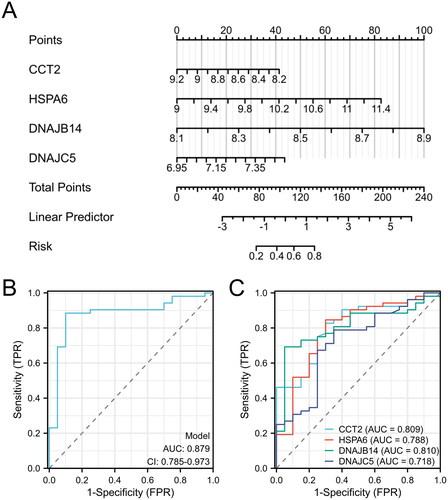
Table 1. The results of logistic regression analysis.
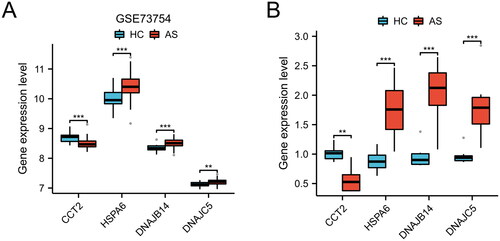
Furthermore, we conducted an analysis of marker gene expression levels in the GSE73754 dataset. As depicted in , the AS group exhibited decreased expression of CCT2 in comparison to the HC group, whereas the AR group demonstrated increased expression of HSPA6, DNAJB14, and DNAJC5 (p < 0.01 or p < 0.001). These findings were further corroborated in the clinical blood samples collected ().
Figure 4. Differential expression of candidate genes between HC and AS. Boxplot representation of gene expression levels for CCT2, HSPA6, DNAJB14, and DNAJC5 in GSE73754 dataset (A) and clinical samples (B), comparing HC and AS (**p < 0.01, ***p < 0.001).
Clustering analysis and differential gene expression profiling of as samples
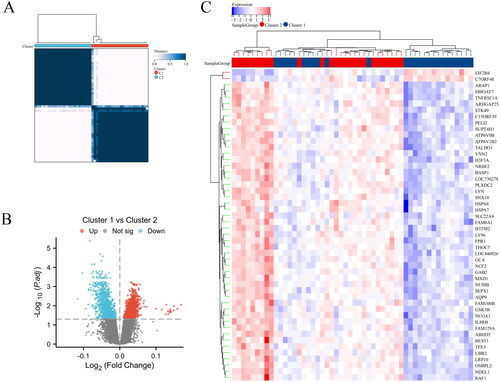
As shown in , a heatmap generated from a hierarchical clustering analysis of HRGs expression data, revealing two main clusters of AS samples, Cluster 1 and Cluster 2. As shown in , a volcano plot that highlights the differential expression between Cluster 1 and Cluster 2. 958 genes that are upregulated in Cluster 1 relative to Cluster 2 are shown in red, whereas 887 genes downregulated are in blue. Genes not exhibiting statistically significant changes are colored grey. presents an additional heatmap focused on the most significantly differentially expressed genes between the two clusters. Overall, this analysis summarizes the clustering of AS samples based on HRGs expression profiles and identifies key genes with significant differential expression that may be critical for understanding the biological differences between the clusters.
Figure 5. Clustering analysis and differential gene expression profiling of AS samples. (A) Heatmap with hierarchical clustering based on gene expression data of HRGs, illustrating two distinct clusters (Cluster 1 and Cluster 2) of AS samples. (B) Volcano plot depicting the differential expression between Cluster 1 and Cluster 2. (C) Heatmap of the top 50 differentially expressed genes between the two clusters, arranged by hierarchical clustering.
Functional and pathway enrichment analysis of differentially expressed genes in different clusters of as
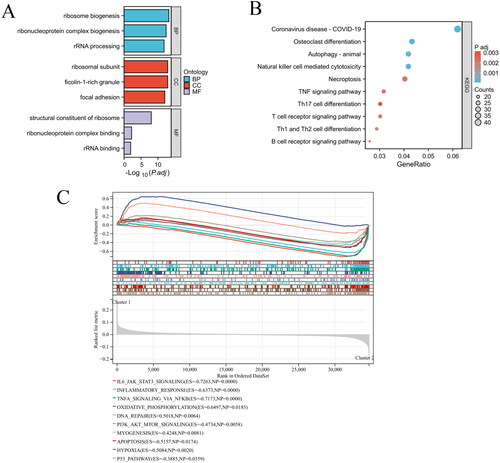
The molecular biological functions of differentially expressed genes in different clusters of AS were determined using GO terms and KEGG pathways. As shown in , key enriched terms include ribosome biogenesis, ribonucleoprotein complex biogenesis, and rRNA processing for BP; ribosomal subunit and ficolin-1-rich granule for CC; and structural constituent of ribosome, ribonucleoprotein complex binding, and rRNA binding for MF. KEGG pathway analysis revealed significant enrichment in pathways such as osteoclast differentiation, autophagy, natural killer cell mediated cytotoxicity, necroptosis, TNF signaling pathway, etc (). Furthermore, the GSEA analysis findings indicated significant disparities in signaling pathways, specifically IL6 JAK STAT3 signaling, inflammatory response, TNFA signaling via NFKB, PI3K AKT MTOR signaling, apoptosis, and hypoxia (). These findings provide a deeper understanding of the biological processes differentiating the AS clusters.
Figure 6. Functional and pathway enrichment analysis of differentially expressed genes in different clusters of AS. (A) GO term enrichment for BP, CC, and MF categories. (B) KEGG pathway enrichment analysis. (C) GSEA results visualized as enrichment plots for selected pathways.
Immune infiltration analysis
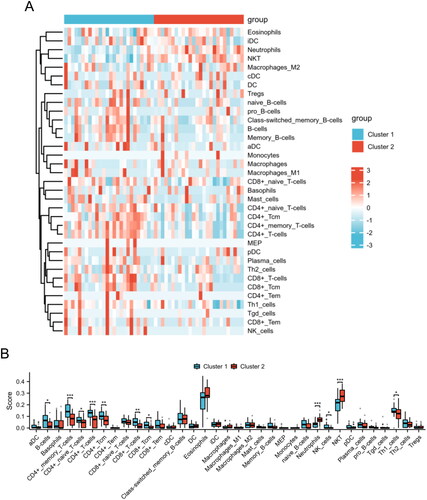
To further explore the immune profiles in different subgroups of AS, we employed the xCell algorithm to calculate the proportions of distinct immune cell subsets in AS. displays a heatmap with hierarchical clustering representing the relative abundance of various immune cell types across two distinct groups, Cluster 1 and Cluster 2. Moreover, the Cluster 2 group demonstrated significantly elevated levels of neutrophils and NKT cells in comparison to the Cluster 1 group. Conversely, the Cluster 2 group exhibited diminished levels of B cells, CD4+ memory T cells, CD4+ naive T cells, CD4+ T cells, CD4+ Tcm cells, CD8+ T cells, CD8+ Tcm cells, NK cells, and Th1 cells (). The results provide insights into the immune landscape of the two HSP-related clusters, highlighting specific differences in immune cell composition that may be relevant for understanding the immune responses or pathological states associated with AS.
Figure 7. The immunological landscape of HSP-related clusters. (A) The distribution of immune cell subpopulations between Cluster 1 and Cluster 2 groups is presented in the heat map. (B) The levels of immune cell subpopulations between Cluster 1 and Cluster 2 groups are displayed in the box plot. *p < 0.05, **p < 0.01, ***p < 0.001.
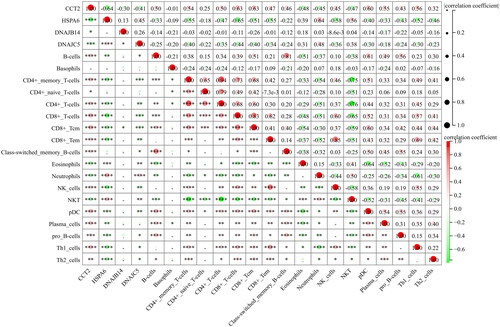
In addition, the displays a correlation matrix showing the relationship between the expression levels of specific genes (CCT2, HSPA6, DNAJB14, and DNAJC5) and various immune cell types’ abundance. For example, HSPA6 and DNAJC5 expression shows a significant positive correlation with the abundance of neutrophils, as indicated by the large red circle with four asterisks. In contrast, CCT2 shows a significant negative correlation with the abundance of neutrophils and NKT, as indicated by the large green circle with four asterisks.
Figure 8. The correlations between key genes and immunological characteristics in AS. Red circles indicate positive correlation, while green circles indicate negative correlation. The intensity of the color and the size of the circle correspond to the strength of the correlation, with a color gradient from light to dark representing increasing correlation strength from low to high. *p < 0.05, **p < 0.01, ***p < 0.001, ****p < 0.0001.
Discussion
AS is a chronic inflammatory disorder characterized by inflammation of the axial skeleton, leading to progressive fusion of the spine [Citation18]. In recent years, there has been growing interest in the role of HSP in chronic and aging inflammatory diseases [Citation19]. However, there is limited research investigating the involvement of HSP in the pathogenesis of AS. In this study, we aimed to identify a diagnostic signature based on HSP-related genes (HRGs) and determine the molecular subtypes of AS, providing new insights into the underlying mechanisms of the disease.
Through the analysis of transcriptional data from AS patients using the GSE73754 dataset, we identified four core HRGs (CCT2, HSPA6, DNAJB14, and DNAJC5) that were significantly associated with AS. These HRGs have shown potential as effective blood-based diagnostic biomarkers for AS. CCT2, functioning as a specialized autophagy receptor for aggregated proteins, may represent a critical therapeutic target in the amelioration of pathologies associated with proteostasis dysfunction [Citation20]. CCT2 may be regarded as an independent prognostic biomarker across a spectrum of neoplasms, wherein the expression profile of CCT2 varies considerably among different tumor types and is indicative of divergent prognostic implications [Citation21]. HSPA6, a member of the HSP70 chaperone family, exhibits partial evolutionary conservation across mammalian species. Recent research has elucidated that HSPA6 is implicated not only in oncogenesis and the progression of neoplastic conditions but also in the pathogenesis of various non-neoplastic disorders [Citation22]. HSPA6 enhances the growth of gastric cancer through the Hippo signaling pathway, serving as a new predictive marker for prognosis and a possible target for treatment [Citation23]. DNAJB14 is a constituent of the type II transmembrane Hsp40 protein family, exerting a pivotal role in modulating the activity of Hsp70 ATPase on the intracellular side of the endoplasmic reticulum membrane [Citation24]. DNAJC5 plays a critical role in maintaining the proper functioning of nerve tissues. When DNAJC5 is mutated or removed in organisms such as mice, drosophila, and worms, it results in impaired synaptic activity, degenerative changes in the nervous system, and a decrease in lifespan [Citation25,Citation26]. Furthermore, there is a strong correlation between DNAJC5 mutations and the development of various human diseases [Citation27,Citation28]. Our findings suggest that these HRGs may play a crucial role in the development and progression of AS.
AS is a type of rheumatic disease characterized by immune-mediated inflammation [Citation29]. AS disease activity can be effectively monitored by the systemic immune-inflammation index, which has shown a significant increase in AS patients [Citation30]. Further functional analysis revealed that Cluster 2, one of the identified molecular subtypes, exhibited upregulation of pathways related to immune response and inflammation. This finding indicates that Cluster 2 may represent a more inflammatory subtype of AS, potentially providing insight into the pathogenesis of the AS. The identification of these molecular subtypes in AS may have important clinical implications. By stratifying AS patients into different subgroups based on their molecular profiles, it may be possible to develop personalized therapeutic interventions. For example, patients in Cluster 2, characterized by heightened immune response and inflammation, may benefit from targeted anti-inflammatory therapies. On the other hand, patients in Cluster 1, which displayed a distinct molecular phenotype, may require different treatment approaches. This personalized approach could lead to improved outcomes and better management of AS patients.
AS is a chronic inflammatory autoimmune disease that affects the spine and other joints [Citation31]. In contrast to other systemic autoimmune disorders, AS displays a prominent involvement of the innate immune system. This is evident through the abnormal functioning of various innate and innate-like immune cells, including mucosal-associated invariant T cells, neutrophils, T cells, and mast cells, within the susceptible areas associated with the disease [Citation2]. The mutual interaction between CD4 + T cells and human leukocyte antigen B27 results in a series of cytokines and chemokines, triggering inflammatory reactions and causing erosion of the bones in AS [Citation32]. According to a recent research, individuals in the active stage of AS exhibit an immune system imbalance in terms of frequency, encompassing a variety of immune cell types such as B cells, CD4 + T cells, Tregs, CD8 + T cells, and Th cells [Citation33]. In the present study, we employed the xCell algorithm to evaluate the immunological landscape associated with AS. The Cluster 2 group demonstrated significantly elevated levels of neutrophils and NKT cells in comparison to the Cluster 1 group. Conversely, the Cluster 2 group exhibited diminished levels of B cells, CD4+ memory T cells, CD4+ naive T cells, CD4+ T cells, CD4+ Tcm cells, CD8+ T cells, CD8+ Tcm cells, and Th1 cells. This analysis provided further insights into the immune cell composition and functional differences between the identified molecular subtypes. Understanding the immunological landscape of AS can aid in the development of novel therapeutic strategies and the identification of potential targets for intervention.
Conclusions
In conclusion, our study identified four core HSP-related genes (CCT2, HSPA6, DNAJB14, and DNAJC5) as potential blood-based diagnostic biomarkers for AS. These genes can be used in a nomogram prediction model for improved diagnosis. We also discovered two distinct molecular subgroups in AS, with Cluster 2 showing upregulation of immune response and inflammation pathways. Our findings provide valuable insights into the development of AS and offer potential targets for personalized therapeutic interventions.
Ethics approval and consent to participate
The study was approved by the Ethics Committee of the First Affiliated Hospital of Heilongjiang University of Traditional Chinese Medicine.
Consent for publication
Not applicable.
Authors’ contributions
Geqiang Wang wrote the manuscript. Yongji Li, Jiaxing Liu, Qian Zhang, and Weixin Cai analyzed the data and produced the figures. Xiaodong Li reviewed and edited the manuscript.
Acknowledgment
Not applicable.
Disclosure statement
No potential conflict of interest was reported by the author(s).
Data availability statement
All data used in the present study were available from the GEO database (https://www.ncbi.nlm.nih.gov/geo/). The accession number is as follows: GSE73754).
Additional information
Funding
References
- Hanson A, Brown MA. Genetics and the causes of ankylosing spondylitis. Rheum Dis Clin North Am. 2017;43(3):1–12. doi: 10.1016/j.rdc.2017.04.006.
- Mauro D, Thomas R, Guggino G, et al. Ankylosing spondylitis: an autoimmune or autoinflammatory disease? Nat Rev Rheumatol. 2021;17(7):387–404. doi: 10.1038/s41584-021-00625-y.
- Bond D. Ankylosing spondylitis: diagnosis and management. Nurs Stand. 2013;28(16-18):52–59; quiz 60. doi: 10.7748/ns2013.12.28.16.52.e7807.
- Chen B, Li J, He C, et al. Role of HLA-B27 in the pathogenesis of ankylosing spondylitis (review). Mol Med Rep. 2017;15(4):1943–1951. doi: 10.3892/mmr.2017.6248.
- Khan MA, Yong SB, Wei JC. Ankylosing spondylitis: history, epidemiology, and HLA-B27. Int J Rheum Dis. 2023;26(3):413–414. doi: 10.1111/1756-185X.14547.
- Pedersen OB, Svendsen AJ, Ejstrup L, et al. Ankylosing spondylitis in Danish and Norwegian twins: occurrence and the relative importance of genetic vs. environmental effectors in disease causation. Scand J Rheumatol. 2008;37(2):120–126. doi: 10.1080/03009740701824613.
- Liao HT, Tsai CY, Lai CC, et al. The potential role of genetics, environmental factors, and gut dysbiosis in the aberrant non-coding RNA expression to mediate inflammation and osteoclastogenic/osteogenic differentiation in ankylosing spondylitis. Front Cell Dev Biol. 2021;9:748063. doi: 10.3389/fcell.2021.748063.
- Zininga T, Ramatsui L, Shonhai A. Heat shock proteins as immunomodulants. Molecules. 2018;23(11):2846. doi: 10.3390/molecules23112846.
- Keijzer C, Wieten L, van Herwijnen M, et al. Heat shock proteins are therapeutic targets in autoimmune diseases and other chronic inflammatory conditions. Expert Opin Ther Targets. 2012;16(9):849–857. doi: 10.1517/14728222.2012.706605.
- Tukaj S, Zillikens D, Kasperkiewicz M. Heat shock protein 90: a pathophysiological factor and novel treatment target in autoimmune bullous skin diseases. Exp Dermatol. 2015;24(8):567–571. doi: 10.1111/exd.12760.
- Spierings J, van Eden W. Heat shock proteins and their immunomodulatory role in inflammatory arthritis. Rheumatol. 2017;56(2):198–208. doi: 10.1093/rheumatology/kew266.
- Fouani M, Basset CA, Mangano GD, et al. Heat shock proteins alterations in rheumatoid arthritis. Int J Mol Sci. 2022;23(5):2806. doi: 10.3390/ijms23052806.
- Ulmansky R, Landstein D, Moallem E, et al. A humanized monoclonal antibody against heat shock protein 60 suppresses murine arthritis and colitis and skews the cytokine balance toward an anti-inflammatory response. J Immunol. 2015;194(11):5103–5109. doi: 10.4049/jimmunol.1500023.
- Lorenzo N, Barberá A, Domínguez MC, et al. Therapeutic effect of an altered peptide ligand derived from heat-shock protein 60 by suppressing of inflammatory cytokines secretion in two animal models of rheumatoid arthritis. Autoimmunity. 2012;45(6):449–459. doi: 10.3109/08916934.2012.697592.
- Klimczak M, Biecek P, Zylicz A, et al. Heat shock proteins create a signature to predict the clinical outcome in breast cancer. Sci Rep. 2019;9(1):7507. doi: 10.1038/s41598-019-43556-1.
- Tong Q, Zhou J. Construction of a 12-gene prognostic model for colorectal cancer based on heat shock protein-related genes. Int J Hyperthermia. 2024;41(1):2290913. doi: 10.1080/02656736.2023.2290913.
- Aran D, Hu Z, Butte AJ. xCell: digitally portraying the tissue cellular heterogeneity landscape. Genome Biol. 2017;18(1):220. doi: 10.1186/s13059-017-1349-1.
- Taurog JD, Chhabra A, Colbert RA. Ankylosing spondylitis and axial spondyloarthritis. N Engl J Med. 2016;374(26):2563–2574. doi: 10.1056/NEJMra1406182.
- Gomez CR. Role of heat shock proteins in aging and chronic inflammatory diseases. Geroscience. 2021;43(5):2515–2532. doi: 10.1007/s11357-021-00394-2.
- Zhang Z, Klionsky DJ. CCT2, a newly identified aggrephagy receptor in mammals, specifically mediates the autophagic clearance of solid protein aggregates. Autophagy. 2022;18(7):1483–1485. doi: 10.1080/15548627.2022.2083305.
- Lv W, Shi L, Pan J, et al. Comprehensive prognostic and immunological analysis of CCT2 in pan-cancer. Front Oncol. 2022;12:986990. doi: 10.3389/fonc.2022.986990.
- Song B, Shen S, Fu S, et al. HSPA6 and its role in cancers and other diseases. Mol Biol Rep. 2022;49(11):10565–10577. doi: 10.1007/s11033-022-07641-5.
- Zhang L, Zhuo HQ, Hong ZJ, et al. HSPA6, a novel prognostic and therapeutic biomarker, associated with ming classification in gastric cancer. J Clin Lab Anal. 2023;37(1):e24763. doi: 10.1002/jcla.24763.
- Sopha P, Meerod T, Chantrathonkul B, et al. Novel functions of the ER-located Hsp40s DNAJB12 and DNAJB14 on proteins at the outer mitochondrial membrane under stress mediated by CCCP. Mol Cell Biochem. 2023 Oct 18. doi: 10.1007/s11010-023-04866-1.
- Nieto-González JL, Gómez-Sánchez L, Mavillard F, et al. Loss of postnatal quiescence of neural stem cells through mTOR activation upon genetic removal of cysteine string protein-α. Proc Natl Acad Sci U S A. 2019;116(16):8000–8009. doi: 10.1073/pnas.1817183116.
- Lopez-Ortega E, Ruiz R, Tabares L. CSPα, a molecular co-chaperone essential for short and Long-Term synaptic maintenance. Front Neurosci. 2017;11:39. doi: 10.3389/fnins.2017.00039.
- Wang H, Luo J, Tian X, et al. DNAJC5 promotes hepatocellular carcinoma cells proliferation though regulating SKP2 mediated p27 degradation. Biochim Biophys Acta Mol Cell Res. 2021;1868(6):118994. doi: 10.1016/j.bbamcr.2021.118994.
- Roosen DA, Blauwendraat C, Cookson MR, et al. DNAJC proteins and pathways to parkinsonism. Febs J. 2019;286(16):3080–3094. doi: 10.1111/febs.14936.
- Raychaudhuri SP, Deodhar A. The classification and diagnostic criteria of ankylosing spondylitis. J Autoimmun. 2014;48-49:128–133. doi: 10.1016/j.jaut.2014.01.015.
- Wu J, Yan L, Chai K. Systemic immune-inflammation index is associated with disease activity in patients with ankylosing spondylitis. J Clin Lab Anal. 2021;35(9):e23964. doi: 10.1002/jcla.23964.
- Rezaiemanesh A, Abdolmaleki M, Abdolmohammadi K, et al. Immune cells involved in the pathogenesis of ankylosing spondylitis. Biomed Pharmacother. 2018;100:198–204. doi: 10.1016/j.biopha.2018.01.108.
- Han Y, Zhou Y, Li H, et al. Identification of diagnostic mRNA biomarkers in whole blood for ankylosing spondylitis using WGCNA and machine learning feature selection. Front Immunol. 2022;13:956027. doi: 10.3389/fimmu.2022.956027.
- Yang M, Lv Q, Wei Q, et al. TNF-α inhibitor therapy can improve the immune imbalance of CD4+ T cells and negative regulatory cells but not CD8+ T cells in ankylosing spondylitis. Arthritis Res Ther. 2020;22(1):149. doi: 10.1186/s13075-020-02226-8.