
ABSTRACT
Accumulating evidence suggests that ultrasound visual feedback increases the treatment efficacy for persistent speech sound errors. However, the available evidence is mostly from English. This is a feasibility study of ultrasound visual feedback for treating distortion of Finnish [r]. We developed a web-based application for auditory-perceptual judgement. We investigated the impact of listener’s experience on perceptual judgement and the intra-rater reliability of listeners. Four boys (10–11 years) with distortion of [r], otherwise typical development, partook in eight ultrasound treatment sessions. In total, 117 [r] samples collected at pre- and post-intervention were judged with visual analogue scale (VAS) by two listener groups: five speech and language therapists (SLTs) and six SLT students. We constructed a linear mixed-effects model with fixed effects for time and listener group and several random effects. Our findings indicate that measurement time had a significant main effect on judgement results, χ2 = 78.82, p < 0.001. Effect of listener group was non-significant, but a significant main effect of interaction of group × time, χ2 = 6.33, p < 0.012 was observed. We further explored the effect of group with nested models, and results revealed a non-significant effect of group. The average intra-rater correlation of the 11 listeners was 0.83 for the pre-intervention samples and 0.92 for post-intervention showing a good or excellent degree of agreement. Finnish [r] sound can be evaluated with VAS and ultrasound visual feedback is a feasible and promising method in treatment for distortion of [r], and its efficacy should be further assessed.
Introduction
Speech sound errors refers to difficulty acquiring the sound of the ambient language. Speech sound errors may significantly impede speech intelligibility and are among the most common reasons for seeking speech and language therapy (Wren et al., Citation2016). Even a mild distortion of a speech sound may affect social relationships, emotional development and success at school (Hitchcock et al., Citation2015; Savinainen-Makkonen & Kunnari, Citation2012). Previous studies have suggested that ultrasound visual feedback may be a crucial factor in sound learning, especially if traditional treatment methods have been previously unsuccessful (Sugden et al., Citation2019). More evidence from different languages is needed because the phonetic properties vary across languages. There is a great difference between Finnish [r] and English [ɹ] sound pronunciation. Finnish [r] is an alveolar tremulant, whereas in most English varieties [ɹ] is pronounced as an approximant or flap tensing up the tongue without necessarily touching the alveolar ridge (Sajavaara & Dufva, Citation2001). The current study aimed to develop a web-based application with a visual analogue scale (VAS) to investigate the feasibility of auditory-perceptual judgement of place and manner of articulation as an evaluation method for ultrasound treatment for distortion of Finnish [r].
Distortion of Finnish [r]
Finnish is a Uralic, typologically agglutinative language. Accurate production of Finnish [r] is typically achieved at the age of five, and distortion of [r] is the most common speech sound error in Finnish because of the difficult motor functions required to produce it (Savinainen-Makkonen & Kunnari, Citation2012). Finnish [r] has several variants, appearing especially in children, which differ in both their manner of articulation and acoustic characteristics (Aulanko, Citation2005). Across languages, rhotics such as [r] have similar characteristics, involving multiple constrictions at the tip and root of the tongue, and the lips (Boyce et al., Citation2016; Namasivayam et al., Citation2020). Similarities between rhotic distortions across languages are less studied (Boyce et al., Citation2016). The information on tongue root retraction for Finnish [r] has not been studied, but according to a previous study of [r] in Catalan, production of [r] involves predorsum lowering and a high degree of tongue dorsum constriction (Recasens & Pallarès, Citation1999). There may be some small variation in the location of apico-alveolar closure as a consequence of vowel-dependent changes in tongue dorsum raising. This supports the notion that tongue body is required to be stabilised during the production of [r] (Recasens & Pallarès, Citation1999). However, more research is needed to investigate how exactly this applies to Finnish [r].
Ultrasound visual feedback
Ultrasound tongue imaging enables accurate, real-time visual feedback of tongue shape and movement, and precise instructions to modify articulation (Bernhardt et al., Citation2005; Cleland et al., Citation2015, Citation2019, Citation2018; Sugden et al., Citation2019). Previous evidence for ultrasound visual feedback consists mostly of single-case experimental designs, case series and case studies (Sugden et al., Citation2019). The outcome of ultrasound intervention ranges from mixed results (some participants responded to the intervention, but others did not) to positive results for all participants (Sugden et al., Citation2019). In previous literature, ultrasound is cited as being effective in the acquisition of motor learning stages as recognising the anatomical structures and motor functions of the tongue, and to distinguish between correct and atypical articulation (McAllister Byun, Harel et al., Citation2016; Sugden et al., Citation2019). Any vowel or lingual consonant can be visualised using ultrasound, and visual feedback seems particularly beneficial if the place and manner of articulation of the target sound are difficult to see or describe (Cleland et al., Citation2018; McAllister Byun, Harel et al., Citation2016; Sugden et al., Citation2019).
In ultrasound intervention, a pre-practice phase aims to practice correct articulatory gestures for distorted speech sounds (Cleland et al., Citation2018). In the practice phase, the target sound is practised at high dosage with ultrasound visual feedback in order to be automated and stabilised (Cleland et al., Citation2018). Previous ultrasound studies have described that in English rhotic distortions, children typically implement two of the three constrictions in the vocal tract to facilitate sound production (Adler-Bock et al., Citation2007; Klein et al., Citation2013). These differences in motor production are reflected in the acoustic properties of the sound and can be perceived audibly and measured acoustically (Aulanko, Citation2005; Munson et al., Citation2012, Citation2017; Strömbergsson et al., Citation2015; Wolfe et al., Citation2003).
Auditory-perceptual judgement of speech
Perceptual judgement is the primary tool that speech and language therapists (SLTs) use in assessing speech, and it is typically performed using phonetic transcription. Speech sound variants between phonetic categories are common in children’s speech because their anatomy as well as motor and linguistic skills are still developing (Macken & Barton, Citation1980; Meyer & Munson, Citation2021; Munson & Carlson, Citation2016). These subtle variants, covert contrasts (Macken & Barton, Citation1980), are often not captured using phonetic transcription because listeners tend to assign segments to phonemic categories within their own system. Indeed, research suggests that phonetic symbols do not cover all the variants and the reliability of the evaluations has varied (Munson et al., Citation2010, Citation2017).
Covert contrasts can be perceived by adults in perceptual judgement tasks by using a continuous variable scale such as VAS (Julien & Munson, Citation2012; Meyer & Munson, Citation2021; Munson & Carlson, Citation2016; Munson et al., Citation2012; Strömbergsson et al., Citation2015). Results of judgements using VASs also correlate with acoustic analysis (Munson & Carlson, Citation2016; Munson et al., Citation2010, Citation2012, Citation2017; Strömbergsson et al., Citation2015). In the VAS, the endpoints of the scale are defined as different phonemes and listeners rate samples by the degree to which they perceive them to be closest to a particular category (Munson et al., Citation2012). In this way listeners can rate speech samples as either belonging to one or another contrasting phoneme, or as being intermediate. Speech sound evaluations with the VAS have shown high internal reliability of the subjects and indicated accurate correspondence of sound production (Lee et al., Citation2020; Munson & Carlson, Citation2016; Munson et al., Citation2012; Strömbergsson et al., Citation2015). Thus far, there is a lack of research in the perceptual judgement of the Finnish language sounds.
A few studies have investigated the influence of listener’s experience on perceptual judgement of erred speech sounds using rating scales. In some studies, SLTs have been more accurate than SLT students and naive listeners, and SLT students have been more accurate than naive listeners (Harel et al., Citation2017; McAllister Byun, Harel et al., Citation2016; Munson et al., Citation2012; Wolfe et al., Citation2003), suggesting that familiarity with disordered speech matters. In addition, SLTs judgements have been more consistent with the acoustic characteristics of speech sounds (Munson et al., Citation2012). Moreover, clinical experience seemed to improve the accurate judgement of English [ɹ] sound variants when the evaluations of SLTs and clinically inexperienced SLT students were compared (Klein et al., Citation2012).
Experience as an SLT may increase the degree of agreement of judgements (McAllister Byun et al., Citation2015; Munson et al., Citation2012). Previous evidence suggests that high agreement between listeners (indicated by ICC > 0.8) reflects an adequate number of listeners (Harel et al., Citation2017; Shriberg et al., Citation2010). The clinical experience seems to influence the number of raters required, and a smaller number of raters may suffice as a confident estimate can be achieved with fewer experienced raters (McAllister Byun, Buchwald et al., Citation2016; McAllister Byun et al., Citation2015). At least nine naive or three experienced listeners have been considered sufficient in a VAS task (McAllister Byun, Buchwald et al., Citation2016; McAllister Byun et al., Citation2015). On the other hand, experience may not influence the accuracy of the evaluation but may affect the way the VAS is used such that experienced evaluators may use end values of the scale even when the sound belongs acoustically in the middle of the scale (Meyer & Munson, Citation2021). In summary, differences between the differently experienced listeners reported in the accuracy of judgements have been varying (Meyer & Munson, Citation2021).
In most previous studies perceptual judgements were collected in formal research facilities with audio samples presented over speakers or headphones. Recently, various web-based applications allow perceptual judgement experiments to be conducted online (see e.g. Harel et al., Citation2017; Meyer & Munson, Citation2021). Online participation is more cost-effective, and it is possible regardless of the distance, which may help reach more potential participants. Conducting VAS experiments over online platforms may be a cost-effective and accurate way of determining the correctness of sound productions from children, yet the use of VAS has been underexplored in the literature on speech sound error treatment effectiveness. Recently a small number of studies have investigated the possibility of using VAS for measuring covert contrasts in online crowdsourcing studies, and the validity and reliability have been promising (Harel et al., Citation2017; McAllister Byun et al., Citation2015).
The current study aimed to provide preliminary evidence for the feasibility of ultrasound visual feedback for treating distortion of Finnish [r] and to develop a web-based application for perceptual judgement of speech sound samples using a VAS. We hypothesised that the time of measurement would have a statistically significant effect on the perceptual judgement results, and the judgements would be closer to Finnish [r] sound at post-intervention measurement (Sugden et al., Citation2019). In light of the mixed previous findings, either positive influence of a listener’s experience on perceptual judgement or no experience could be expected (Klein et al., Citation2012; Meyer & Munson, Citation2021; Munson et al., Citation2012; Wolfe et al., Citation2003). We also hypothesised a high degree of agreement in perceptual judgements between listeners for the [r] sound samples at pre- and post-intervention when evaluated with a VAS (Lee et al., Citation2020; Munson et al., Citation2012; Strömbergsson et al., Citation2015).
Materials and methods
Study design
A case series design with pre- and post-intervention probes was conducted. At pre- and post-intervention, the children read an untreated probe list of 54 words to measure the generalisation of the target sound (Munson et al., Citation2017; Strömbergsson et al., Citation2015; Sugden et al., Citation2019). The design is unbalanced as there was unequal number of sound samples from the children. Estimating the feasibility of ultrasound visual feedback for treating Finnish [r] sound was needed even though previous case studies of the subject have been conducted as the treatment protocol differs considerably from English ones.
Ultrasound intervention
Participants
Four Finnish-speaking boys aged 10–11 years took part in ultrasound intervention for distortion of [r]. The children’s language skills were within typical range, confirmed with the TOKEN test (DiSimoni, Citation1978; De Renzi & Faglioni, Citation1978), the Finnish version of the Boston Naming Test (Kaplan et al., Citation1983; Laine et al., Citation1997) and the Phonology Test (Kunnari et al., Citation2012). They did not have other diagnoses as neuropsychiatric disorders, etc., affecting the treatment response. One of the children had also distortion of [l], which was not treated. Parents reported all children had normal hearing and had received previous speech therapy for [r]. At the beginning of the intervention children 1 and 4 distorted [r] to a uvular [ʀ] and children 2 and 3 to a lateral /r/.
Intervention
The intervention consisted of 10 sessions that lasted 60 min each over 5 weeks, implemented by SLT students at the University of Helsinki under the supervision of the last author. All the students were trained in ultrasound and guided through intervention. A non-stabilised Seemore PI 7.5 M ultrasound device was used with Telemed Medical Systems Wave II application. The intervention was designed according to an ultrasound resource manual for speech sound errors (Cleland et al., Citation2018) adapted to treatment protocol for distortion of Finnish [r]. The mean, standard deviation, median and range of time used for ultrasound at each session and production trials (i.e. target sound in drills of syllables or words) are summarised in . In previous studies the production trials have varied between 60 and 366 (Sugden et al., Citation2019). Time was measured as the time of concentrated practising of production trials.
Table 1. Descriptive statistics of ultrasound time and sound production trials.
The aim of intervention was to practise the correct place and manner of articulation with visual feedback following the typical treatment protocol for distortion of Finnish [r]. The protocol bases broadly on Van Riper’s theories (Van Riper, Citation1978; Van Riper & Irwin, Citation1958) and has a long tradition in Finland as the [r] sound is typically learned along this continuum in Finnish. The protocol follows three stages of sound learning (see ). The treatment progresses using successive approximation from rapid [d] productions, through to a fricative [ð͇] and finally towards a correct trilled [r] sound. The fricative [ð͇] is an important intermediate stage in learning the tremulant sound. [ð͇] place of articulation is the alveolar ridge, as is the correct [r], and thus is observable with ultrasound visual feedback. Tongue shape and movement were imaged using both the coronal and mid-sagittal view as needed, because the coronal view shows ascending sides of the tongue in the lateral /r/, and the sagittal view the shape and position of the tongue (Cleland et al., Citation2018). The sagittal view is suitable for observing uvular [ʀ], fricative [ð͇] and the Finnish [r].
Figure 1. Treatment protocol for distortion of Finnish [r].
![Figure 1. Treatment protocol for distortion of Finnish [r].](/cms/asset/4f9bd588-be27-4d9f-b36d-aea25e94561e/iclp_a_2118079_f0001_oc.jpg)
Practice was performed at the level in which over 80% of the trials succeeded. Two to three unsuccessful subsequent trials led to returning to a lower level. During syllable and word level practice, parts, movements and positions of the tongue were observed, especially raising of the tip of the tongue, and lowering and stabilisation of tongue dorsum and root. The children were instructed to pay attention to the difference between an atypical and correct [r] sound, and to change the position and shape of the tongue based on the observations. The children were encouraged to make observations from the ultrasound image and to consciously combine visual feedback with auditory and somatosensory feedback. For the rest of the time, [r] was practised based on auditory and motor feedback without ultrasound.
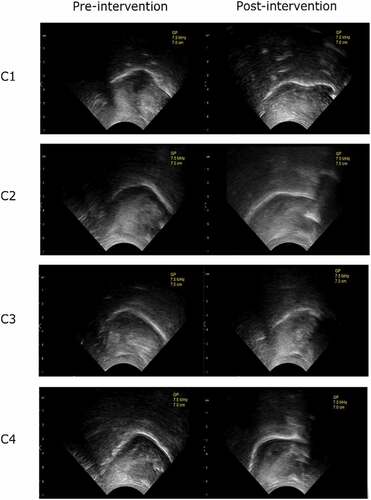
Instructions for home practice in short time intervals (e.g. 5 min) for two to three times per day were given to support the content of treatment session, but this was not controlled. Also practising the target sound during continuous speech (e.g. during board games) was performed in intervention and guided for home. In the beginning, the children learned to recognise the parts of the tongue and their own /r/ variants in the ultrasound image. All the children achieved the fricative [ð͇] in the second session, after which [d] and fricative [ð͇] trials were practised in parallel at syllable and word levels. presents ultrasound images of the children’s /r/ sounds at pre- and post-intervention.
Figure 2. Ultrasound images of children 1–4 labelled as C1–C4. /r/-sounds from the pre- and post-intervention measurements. Mid-sagittal view, the tip of the tongue on the right.
Perceptual judgement
Listeners
Listeners in the perceptual judgement tasks were recruited by email to SLTs in private and public health care and SLT students at the University of Helsinki. Listeners were asked to confirm with a questionnaire to have normal hearing, and to be native Finnish speakers and amount of experience as an SLT prior to performing the task. Eleven listeners (five SLT and six SLT students) completed the task from a total of 29 listeners that participated in the study within an 18-day recruitment period. The use of headphones was recommended and controlled.
Materials
Sound samples were recorded with either a Zoom H2 sound recorder or Sony CX625 camcorder. Separate audio recording with a digital audio recorder was captured in Audacity using uncompressed 16-bit PCM WAV at 44,100 Hz. If there were technical issues with the recording (as was the case due to multiple-stage microphone preamplifier setup), as a fallback the video clip audio was stereo AC-3 format with 48,000 Hz sampling rate, compressed at 384 kbps rate. For post-data collecting and editing, the video soundtrack was exported as 16-bit uncompressed PCM WAV at 48,000 Hz and the sound samples were exported from there. This difference in source format led to a difference in the to-be-rated sound samples, as we did not change the sampling rate during the editing: 20% of the samples were of 44,100 Hz, and the majority were of 48,000 Hz.
Audio files were segmented into roughly word-level samples using the detectSpeech function (https://se.mathworks.com/help/audio/ref/detectspeech.html) in MATLAB R2020a (MathWorks, Natick, MA, USA), with parameters windowDuration = 0.1, percentOverlap = 30 and mergeDuration = 0.2. Due to the short duration of the samples and the sometimes-deficient signal-to-noise ratio, the duration of the extracted samples was extended by 100 ms in both directions to hear the beginning and end of the audio sample clearly. The intensity of the single sound samples was normalised.
The children read an untreated probe word list of 54 words containing [r] in different word and syllable positions to measure the generalisation of the target sound (Munson et al., Citation2017; Strömbergsson et al., Citation2015; Sugden et al., Citation2019). Six words were excluded from the analyses because /r/ production was too short for segmentation. The inclusion criteria for samples were good quality of sound and articulation, and the /r/ sound occurring in different sound combinations, with successful vowel productions preceding and following the /r/ (Strömbergsson et al., Citation2015). Samples were annotated and segmented with Praat 6.1.24 software (Boersma & Weenink, Citation2019) to consist of the /r/ attempt and 150 ms from the preceding or following vowel (Strömbergsson et al., Citation2015). A total of 144 samples (36 samples/child, mean duration 0.35 s, range 0.13–1.00 s, SD 0.12 s) were selected on the grounds of sufficient /r/ production length and quality. Following the more fine-grained manual segmentation, the sounds were again normalised and 5-ms fade-in and fade-out was applied to prevent clicks. The samples were presented three times with 3-s silence between at a data transfer rate of 192 kbps in mp3 format (full presentation: 1 s silence + sample + 3 s silence + sample + 3 s silence + sample + 1 s silence).
A visually and functionally customised Embody PHP code template (https://version.aalto.fi/gitlab/eglerean/embody) was used as a web-based application and transferred to a dedicated virtual server managed by the University of Helsinki. The web-based application was available to the listeners under a regular web browser address. The data from the application were transferred to the server under a pseudoanonymised number in sample-specific simple text files, accessible only by server administrators. The text files were transferred to a local computer, where a custom MATLAB code collected the judgement results into an Excel spreadsheet.
Perceptual judgement task
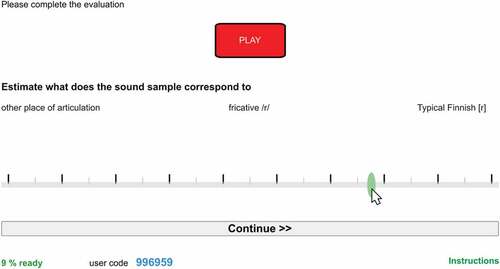
The instructions for the perceptual judgement followed Julien and Munson (Citation2012). Listeners were informed that the task examined how adults perceive children’s speech, specifically [r] sound. The instruction was to estimate using a VAS how close the samples were to the Finnish [r]. They were not informed that the data is collected in the treatment for distortion of [r] as the information may bias the results (McAllister Byun et al., Citation2015). The VAS consisted of 100 degrees (Lee et al., Citation2020; Strömbergsson et al., Citation2015, note that in these studied VAS consisted of 101 degrees). VAS was designed to represent the typical treatment protocol for Finnish [r]. Judgements were collected as integers between 1 (‘other articulation place’) and 100 (‘Finnish [r] sound’; ). The degree 50 was labelled as ‘fricative [ð͇]’. The numbers were invisible to the listeners. Furthermore, VAS did not require accurate recognition of the atypical articulation type.
Figure 3. Illustration of the web-based application.
Listeners made their judgements by moving the cursor to the desired location. Interrupting the task and resuming later was possible. Judgements could not be changed, and it was only possible to move on to the next sample after the judgement was given. In total, 169 samples were presented. First five practice samples were judged, next 144 experimental samples, and finally, 20 control samples were judged second time to calculate intra-rater reliability (Munson et al., Citation2012; Strömbergsson et al., Citation2015). The order of samples was randomised for each listener within each part of the task. In total, 137 samples were included in analyses (59 from pre-, 58 post-intervention, and 20 control samples). Five practice samples and 27 samples collected at mid-intervention were excluded.
Illustration of the VAS in web-based application for a single sample evaluation (here translated to English, originally in Finnish) is shown in . The ‘PLAY’ button on top was upon page loading green, and the evaluation controls inaccessible and dimmed. Playback was only possible once, and the playback button changed colour to indicate disabling multiple playbacks. The evaluation was allowed after automated playback of the sample three times. There was no programmed time limit for the evaluation. However, after completing the slider movement (by ending mouse button press or lifting the finger on touch screen) the application stored the response to the server and moved automatically to the next sample, allowing rapid progression after familiarisation of the web application function.
Analyses
Data were analysed and visualised in the RStudio (version 1.2.5033; Rstudio Team, Citation2020; ggplot2, Wickham, Citation2016). The variance between and within the children, listeners, samples (i.e. probe words) and listener groups may have had an effect on the judgement results. To take these variances into account and perform analysis as suitable as possible to our data, we used a linear mixed model (LMM). Word and listener were modelled as random effects and time and listener group as fixed effects. Modelling was created with lme4 and lmerTest (Bates et al., Citation2015; Kuznetsova et al., Citation2017). The advantages of using an LMM are its capability to handle missing values and unbalanced data and take into account the variability within and between the subjects (Brown, Citation2021). First, we performed a complex model with all effects considered as described above. The results were further explored with a mixed-design analysis of variance. The significance of results was explored with the log-likelihood comparison (chi-square test). Secondly, we made nested LMMs for subsets of the data of two measurements to investigate whether the listener group has an effect on judgement results. The procedure of the mixed-design analysis of variance and chi-square test was completed for nested models. Finally, we analysed the results of control samples with a separate LMM, mixed-design analysis of variance and chi-square test.
The degree of agreement between the listeners was investigated using the intra-class correlation (ICC2 implementation in R, two-way random effects, average measure, 95% CI), which is suitable for multiple measurements when listeners are randomly selected and have performed the same tasks (Koo & Li, Citation2016). ICC2 was defined as the average of all 11 listeners, and the higher the ICC value (range 0–1.0) the higher the consistency in the judgements of the same listener group (Koo & Li, Citation2016). Previous research has suggested 0.80 as an acceptable level of agreement in the perceptual judgement of atypical speech (Shriberg et al., Citation2010).
Ethics
The ethical pre-evaluation of the study has been carried out by the Ethical Pre-Evaluation Committee for the Humanities of the University of Helsinki, and the study was conducted in accordance with the Helsinki Declaration for Human Studies. Children and their guardians gave written informed consent, and they were informed it was possible to withdraw the consent at any time. The processing of personal data was done in accordance with existing legislation. All participants, both the children and the listeners, were treated as subject-coded, making it impossible to identify individual data from the results of this study or other documents. The listeners participated in the study anonymously through the internet and no contact information was collected from them. The listeners’ originating IP addresses were not stored alongside the collected data, they were only stored temporarily at different location at the server and later overwritten by log rotation. Only members of the research team have access to the password protected data.
Results
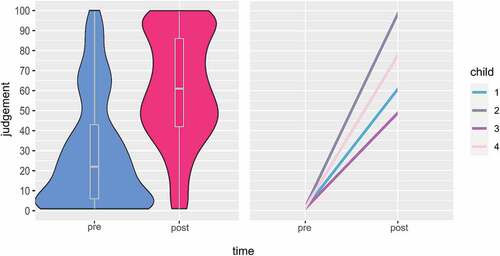
The judgements were distributed over the whole scale including minimum and maximum values (1–100), higher values indicating the correct production of [r] sound. At pre-intervention the distribution of judgements had a mean of 28.6, median of 22, standard deviation of 27.5 and range of 1–100. At post-intervention the distribution of judgements had a mean of 59.8, median of 61, standard deviation of 27 and range of 1–100. Judgement results across measurements are illustrated in .
Figure 4. Violin box plot illustrating the distribution of the perceptual judgement data at pre- (blue) and post-intervention (red) in all children (on the left), and regression lines illustrating children’s judgement results across measurements.
Effects of time, listener group and interaction of listener group × time
The results of fixed effects predicting the VAS judgements are presented in . All effects are reported as significant at p < 0.05. The linear mixed-model yielded positive main effect of time on judgement results (t = 9.092, p < 0.001), suggesting that children’s /r/ attempts were rated closer to adult-like [r] post-treatment compared to pre-treatment. Effect of listener group was non-significant (t = −1.77, p = 0.108). However, the model revealed a positive main effect of interaction between listener group × time (t = 0.012, p = 0.012). Estimates of fixed effects are illustrated in .
Figure 5. Estimates and significance level of fixed effects, *p < 0.05, ** p < 0.01, *** p < 0.001.
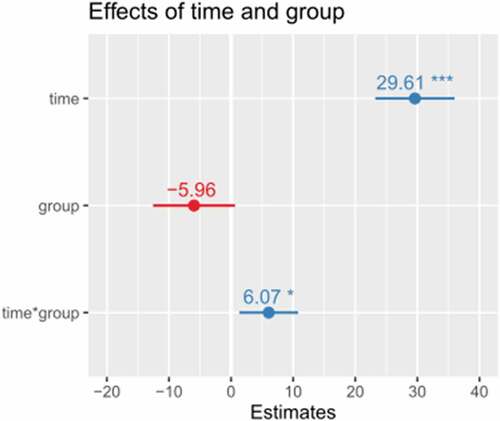
Table 2. Fixed effects for model predicting VAS judgement results.
The mixed-design analysis of variance revealed a positive significant main effect of time on judgement results, F = 113.15, p < 0.001. A non-significant effect was found for listener group, F = 0.87, p = 038. We found a significant main effect of interaction between listener group × time, F = 6.34, p = 0.012. To test significance of established effects, log-likelihood comparison (chi-square) was performed. There was a positive significant main effect of the measurement time, χ2 = 78.82, p < 0.001. The model did not reveal an effect of listener group, χ2 = 0. However, there was a significant main effect of interaction of listener group × time, χ2 = 6.33, p < 0.012. Thus the effect of listener group was further explored separately for each timepoint with nested models.
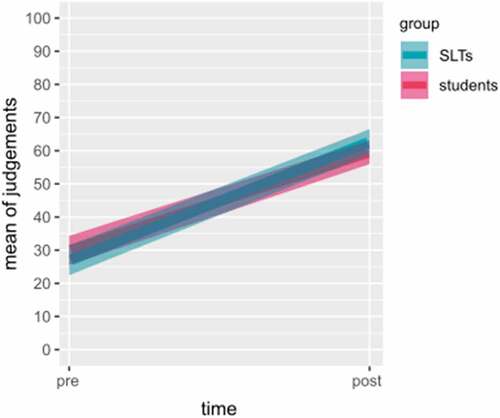
The means of judgement results between the listener groups (95% CI) are illustrated in . The mixed design analysis of variance for nested models showed a non-significant effect of listener group on judgement results at pre-intervention, F = 1.95, p = 0.20, and likewise at post-intervention, F = 0.0007, p = 0.98. Log-likelihood comparison confirmed the results, as a non-significant effect of the listener group was found at pre-intervention, χ2 = 2.05, p < 0.15, and at post-intervention, χ2 = 0, p = 0.98.
Figure 6. The means of judgement results between the listener groups with 95% confidence.
Finally, we explored the variance in control samples. At first listening, VAS judgement results showed a mean of 47.1, standard deviation of 31.0 and median of 45.5. At second listening, results revealed a mean of 47.0, standard deviation of 30.1 and median of 47.0. Mixed model showed that the effect of listening time on judgements was non-significant (estimate −0.00094, std. error 7.046, df 38.03, t = 0.000, p > 0.99) likewise in results of mixed-design analysis of variance (F = 0, p > 0.99), and in log-likelihood comparison (χ2 = 0, p > 0.99) as expected.
Agreement between the listeners
A good or excellent degree of agreement was observed between the 11 listeners (ICC2 > 0.75, see ). Also, the ICC2 values were rated as good or excellent agreement when SLTs and SLT student’s judgements were analysed as separate sub-groups (ICC2 > 0.75, ) except one value (pre-intervention, SLTs) ranked as moderate agreement (ICC2 ≈ 0.72, p < 0.001).
Table 3. ICC2 values, confidence interval (CI, 95%) and p-values.
Discussion
Overall, the results were consistent with our hypothesis. Linear mixed-effects model revealed a main effect of time on judgement results, suggesting that children’s /r/ attempts were rated closer to adult-like [r] post-treatment compared to pre-treatment. The second major finding was a non-significant effect of the listener group. The good or excellent degree of agreement was found between the listeners, suggesting that VAS ratings for perceptual judgement can be considered as a good method for assessing ultrasound intervention efficacy, and indeed possibly other interventions for distorted sounds. Furthermore, this pilot study provides first evidence that ultrasound treatment for distortion of Finnish [r] was feasible to deliver. The study was not defined as an efficacy trial, but these first, important results were promising and in line with previous findings. These results extend previous results by displaying that ultrasound treatment can be considered as a complementary treatment of Finnish [r], which differs largely from English [ɹ] by its place and manner of articulation and treatment protocol.
Main effect of measurement time
In the current study, we found that measurement time had a main effect on perceptual judgement results. The judgements were rated closer to the other place of articulation at pre-intervention and closer to the Finnish [r] sound at post-intervention. These results indicate that VAS rating can capture the differences in place and manner of articulation sound at various stages of treatment protocol for distortion of Finnish [r]. Generally, VAS has been used to assess the listeners’ capability to assess the place of articulation only (see Munson et al., Citation2012). However, Finnish [r] sound treatment consists of practices, in which the place and manner of articulation are modified simultaneously as the children typically produce /r/ variants with incorrect place and/or manner of articulation. Thereby, the evaluation method used needs to consider these both dimensions of sound production. Our results indicate that VAS can be applied for measuring two dimensions of sound production with one linear scale.
Our preliminary results are also in line with previous ultrasound studies as all children appeared to benefit from the intervention. As in previous studies from English, ultrasound visual feedback seemed to be useful in learning the correct place and manner of articulation for target speech sounds and in developing new, more accurate motor plans (Cleland et al., Citation2018; McAllister Byun, Harel et al., Citation2016; Preston et al., Citation2017; Sugden et al., Citation2019). However, further studies on the current topic are required.
Effect of experience on perceptual judgements
Another important finding was that our results did not detect evidence for effect of listeners experience on perceptual judgement results. Previous studies have demonstrated that SLT students may find it difficult to recognise atypically produced speech sounds (Klein et al., Citation2012; Munson et al., Citation2012; Wolfe et al., Citation2003). SLTs learn to perceive and recognise the acoustic characteristics of speech sound variants, and experience may guide perceptual judgements (Munson et al., Citation2012). However it should be noted that in the groups of SLTs and SLT students, the degree of agreement ICC > 0.8 was not achieved at all the measurements and the sample size was small. Therefore, more research is needed as the separate evaluation results of the listener groups may not be considered completely reliable.
Degree of agreement in perceptual judgement results
A good or excellent degree of agreement was observed in the correlation analysis which indicates that the listeners could reliably rate the sounds using the VAS. This finding is consistent with the results of previous studies, in which a good or excellent level of agreement was achieved with a scale of 100 degrees (Lee et al., Citation2020; Strömbergsson et al., Citation2015). In contrast, the agreement between listeners in the current study was higher than in studies where a finer pixel-based scale of, for instance, 400–500 degrees has been used (Munson et al., Citation2012, Citation2017; Schellinger et al., Citation2017). Analysis based on higher degree ratings is more accurate but may lead to increased deviation in the results and affect the reliability. Notably, fewer degrees than 100 may also lead to a high degree of agreement (e.g. Klein et al., Citation2013; Meyer & Munson, Citation2021), but gives rougher information of the articulation.
We examined intra-rater reliability with 20 control samples presented twice. Based on these results, the samples were evaluated very similarly indicating the internal reliability of the perceptual judgement. In previous studies, control samples have been used rarely and apparently not analysed similarly (see e.g. Strömbergsson et al., Citation2015). Although other ways of establishing not only reliability but validity of the ratings are reported, as catch trials to confirm that listeners are performing the task properly (see, i.e. McAllister Byun et al., Citation2015). However, our listeners can be considered as mid- to highly experienced, and therefore a catch trial was not conducted. Overall, the results indicate that the web-based application for perceptual judgement performs reliably as an evaluation method for the [r] sound and its variants.
Limitations and further research
Similarly to previous online studies (see e.g. Harel et al., Citation2017; McAllister Byun et al., Citation2015; Meyer & Munson, Citation2021) the current application for perceptual judgement proved to be a practical data collection method: it was independent of time and place, and the listeners performed the task independently without specific resources, such as the time of the experimenter or research room, using their personal computers and headphones. Technically, the web-based application worked reliably as there was no loss of data, and importantly data was stored in secured environment hosted by the University of Helsinki.
In the current study, the sample size of children was small. Thus, this study determined the feasibility of VAS as an evaluation method rather than treatment efficacy of ultrasound visual feedback. Although the intervention effect derived from our data cannot be interpreted as direct clinical evidence of the ultrasound treatment, it does suggest that it is applicable for using treatment of [r], which is different from most previous studies. Studies from English have shown that ultrasound visual feedback is a useful tool in learning the correct place and manner of articulation for target speech sounds and in developing new, accurate motor plans (Cleland et al., Citation2018; McAllister Byun, Harel et al., Citation2016; Preston et al., Citation2017; Sugden et al., Citation2019). In the future, study designs with more experimental components such as multiple baselines across participants, larger sample size and detailed analysis of ultrasound data, combined with acoustic and perceptual analyses, are required.
Conclusions
Results of this study provide evidence that the web-based application for perceptual judgement using VAS was suitable for measuring changes of the [r] sound. The results suggest that VAS was applicable to measure the phases of treatment protocol for distortion of Finnish [r] because the place and manner of articulation could be included on one scale following the continuum of learning the target sound. The judgements accurately described fine-grained differences in articulation before and after treatment. This study also provides preliminary evidence of treating distortion of alveolar tremulant, Finnish [r], with ultrasound visual feedback and clinical efficacy should be evaluated in a larger study.
Acknowledgements
We wish to thank the children and families that participated in our study and speech and language therapists and students providing the treatment and performing perceptual judgements.
Disclosure statement
No potential conflict of interest was reported by the author(s).
References
- Adler-Bock, M., Bernhardt, B. M., Gick, B., & Bacsfalvi, P. (2007). The use of ultrasound in remediation of North American English /r/ in 2 adolescents. American Journal of Speech - Language Pathology, 16(2), 128–139. https://doi.org/10.1044/1058-0360(2007/017)
- Aulanko, R. (2005). Puheen havaitseminen peruskäsitteitä [Basic concepts of speech perception]. In A. Iivonen (Ed.), Puheen salaisuudet: Fonetiikan uusia suuntia (pp. e–book). Gaudeamus.
- Bates, D., Mächler, M., Bolker, B, and Walker, S. (2015). Fitting linear mixed-effects models using lme4. Journal of Statistical Software, 67(1), 1–48. https://doi.org/10.18637/jss.v067.i01
- Bernhardt, B., Gick, B., Bacsfalvi, P., & Adler‐Bock, M. (2005). Ultrasound in speech therapy with adolescents and adults. Clinical Linguistics & Phonetics, 19(6–7), 605–617. https://doi.org/10.1080/02699200500114028
- Boersma, P., & Weenink, D. (2019). Praat: Doing phonetics by computer (Version 6.1.24) [Computer programme]. http://www.praat.org/
- Boyce, S. E., Hamilton, S. M., & Rivera-Campos, A. (2016). Acquiring rhoticity across languages: An ultrasound study of differentiating tongue movements. Clinical Linguistics & Phonetics, 30(3–5), 174–201. https://doi.org/10.3109/02699206.2015.1127999
- Brown, V. A. (2021). An introduction to linear mixed effects modeling in R. Advances in Methods and Practices in Psychological Science, 4(1), 251524592096035. https://doi.org/10.1177/2515245920960351
- Cleland, J., Scobbie, J. M., Roxburgh, Z., Heyde, C., & Wrench, A. (2019). Enabling new articulatory gestures in children with persistent speech sound disorders using ultrasound visual biofeedback. Journal of Speech, Language and Hearing Research, 62(2), 229–246. https://doi.org/10.1044/2018_JSLHR-S-17-0360
- Cleland, J., Scobbie, J. M., & Wrench, A. A. (2015). Using ultrasound visual biofeedback to treat persistent primary speech sound disorders. Clinical Linguistics & Phonetics, 29(8–10), 575–597. https://doi.org/10.3109/02699206.2015.1016188
- Cleland, J., Wrench, A., Lloyd, S., & Sugden, E. (2018). ULTRAX2020: Ultrasound technology for optimising the treatment of speech disorders: Clinicians’ resource manual. Strathprints - The University of Strathclyde Institutional Repository. https://doi.org/10.15129/63372
- De Renzi, E., & Faglioni, P. (1978). Normative data and screening power of a shortened version of the token test. Cortex, 14(1), 41–49. https://doi.org/10.1016/S0010-9452(78)80006-9
- DiSimoni, F. (1978). The token test for children. Manual. Teaching Resources Corporation.
- Harel, D., Hitchcock, E., Szeredi, D., Ortiz, J., & McAllister, T. (2017). Finding the experts in the crowd: Validity and reliability of crowdsourced measures of children’s gradient speech contrasts. Clinical Linguistics & Phonetics, 31(1), 1–14. https://doi.org/10.3109/02699206.2016.1174306
- Hitchcock, E. R., Harel, D., & Byun, T. M. (2015). Social, emotional, and academic impact of residual speech errors in school-age children: A survey study. Seminars in Speech and Language, 36(4), 283–294. https://doi.org/10.1055/s-0035-1562911
- Julien, H. M., & Munson, B. (2012). Modifying speech to children based on their perceived phonetic accuracy. Journal of Speech, Language, and Hearing Research, 55(6), 1836–1849. https://doi.org/10.1044/1092-4388(2012/11-0131)
- Kaplan, E., Goodglass, H., & Weintraub, S. (1983). Boston naming test. Boston University.
- Klein, H. B., Byun, T. M., Davidson, L., & Grigos, M. I. (2013). A multidimensional investigation of children’s /r/ productions: Perceptual, ultrasound, and acoustic measures. American Journal of Speech-Language Pathology, 22(3), 540–553. https://doi.org/10.1044/1058-0360(2013/12-0137)
- Klein, H. B., Grigos, M. I., McAllister Byun, T., & Davidson, L. (2012). The relationship between inexperienced listeners’ perceptions and acoustic correlates of children’s /r/ productions. Clinical Linguistics & Phonetics, 26(7), 628–645. https://doi.org/10.3109/02699206.2012.682695
- Koo, T. K., & Li, M. Y. (2016). A guideline of selecting and reporting intraclass correlation coefficients for reliability research. Journal of Chiropractic Medicine, 15(2), 155–163. https://doi.org/10.1016/j.jcm.2016.02.012
- Kunnari, S., Savinainen-Makkonen, T., & Saaristo-Helin, K. (2012). Fonologiatesti [The phonology test]. Niilo Mäki Instituutti.
- Kuznetsova, A., Brockhoff, P. B., & Christensen, R. H. (2017). lmerTest package: Tests in linear mixed effects models. Journal of Statistical Software, 82(13), 1–26. https://doi.org/10.18637/jss.v082.i13
- Laine, M., Koivuselkä-Sallinen, P., Hänninen, R., & Niemi, J. (1997). Bostonin nimentätestin suomenkielinen versio [Finnish version of Boston naming test]. PS-kustannus.
- Lee, A., Potts, S., & Bressmann, T. (2020). Speech-language therapy students’ auditory-perceptual judgements of simulated concurrent hypernasality and articulation disorders. Clinical Linguistics & Phonetics, 34(5), 479–492. https://doi.org/10.1080/02699206.2019.1655666
- Macken, M. A., & Barton, D. (1980). The acquisition of the voicing contrast in English: A study of voice onset time in word-initial stop consonants. Journal of Child Language, 7(1), 41–74. https://doi.org/10.1017/S0305000900007029
- McAllister Byun, T., Buchwald, A., & Mizoguchi, A. (2016). Covert contrast in velar fronting: An acoustic and ultrasound study. Clinical Linguistics & Phonetics, 30(3–5), 249–276. https://doi.org/10.3109/02699206.2015.1056884
- McAllister Byun, T., Halpin, P., & Szeredi, D. (2015). Online crowdsourcing for efficient rating of speech: A validation study. Journal of Communication Disorders, 53, 70–83. https://doi.org/10.1016/j.jcomdis.2014.11.003
- McAllister Byun, T., Harel, D., Halpin, P. F., & Szeredi, D. (2016). Deriving gradient measures of child speech from crowdsourced ratings. Journal of Communication Disorders, 64, 91–102. https://doi.org/10.1016/j.jcomdis.2016.07.001
- Meyer, M. K., & Munson, B. (2021). Clinical experience and categorical perception of children’s speech. International Journal of Language & Communication Disorders, 56(2), 374–388. https://doi.org/10.1111/1460-6984.12610
- Munson, B., & Carlson, K. U. (2016). An exploration of methods for rating children’s productions of sibilant fricatives. Speech, Language and Hearing, 19(1), 36–45. https://doi.org/10.1080/2050571X.2015.1116154
- Munson, B., Edwards, J., Schellinger, S., Beckman, M. E., & Meyer, M. K. (2010). Deconstructing phonetic transcription: Covert contrast, perceptual bias, and an extraterrestrial view of vox humana. Clinical Linguistics & Phonetics, 24(4–5), 245–260. https://doi.org/10.3109/02699200903532524
- Munson, B., Johnson, J. M., & Edwards, J. (2012). The role of clinical experience in the perception of phonetic detail in children’s speech: A comparison between speech-language pathologists and clinically untrained listeners. American Journal of Speech-Language Pathology, 21(2), 124–139. https://doi.org/10.1044/1058-0360(2011/11-0009)
- Munson, B., Schellinger, S. K., & Edwards, J. (2017). Bias in the perception of phonetic detail in children’s speech: A comparison of categorical and continuous rating scales. Clinical Linguistics & Phonetics, 31(1), 56–79. https://doi.org/10.1080/02699206.2016.1233292
- Namasivayam, A. K., Coleman, D., O’Dwyer, A., & Van Lieshout, P. (2020). Speech sound disorders in children: An articulatory phonology perspective. Frontiers in Psychology, 10, 2998. https://doi.org/10.3389/fpsyg.2019.02998
- Preston, J. L., Leece, M. C., & Maas, E. (2017). Motor-based treatment with and without ultrasound feedback for residual speech sound errors. International Journal of Language & Communication Disorders, 52(1), 80–94. https://doi.org/10.1111/1460-6984.12259
- Recasens, D., & Pallarès, M. D. (1999). A study of/J/ and /r/ in the light of the “DAC” coarticulation model. Journal of Phonetics, 27(2), 143–169. https://doi.org/10.1006/jpho.1999.0092
- RStudio Team. (2020). RStudio: Integrated development environment for R. Boston, MA. Retrieved from http://www.rstudio.com/
- Sajavaara, K., & Dufva, H. (2001). Finnish-English phonetics and phonology. International Journal of English Studies, 1(1), 241–256. https://revistas.um.es/ijes/article/view/47781
- Savinainen-Makkonen, T., & Kunnari, S. (2012). Äännevirheet ja niiden kuntoutus. In S. Kunnari & T. Savinainen-Makkonen (Eds.), Pienten sanat. Lasten äänteellinen kehitys (pp. 173–187). PS-kustannus.
- Schellinger, S. K., Munson, B., & Edwards, J. (2017). Gradient perception of children’s productions of /s/ and /θ/: A Comparative study of rating methods. Clinical Linguistics & Phonetics, 31(1), 80–103. https://doi.org/10.1080/02699206.2016.1205665
- Shriberg, L. D., Fourakis, M., Hall, S. D., Karlsson, H. B., Lohmeier, H. L., McSweeny, J. L., Potter, N. L., Scheer-Cohen, A. R., Strand, E. A., Tilkens, C. M., & Wilson, D. L. (2010). Perceptual and acoustic reliability estimates for the speech disorders classification system (SDCS). Clinical Linguistics & Phonetics, 24(10), 825–846. https://doi.org/10.3109/02699206.2010.503007
- Strömbergsson, S., Salvi, G., & House, D. (2015). Acoustic and perceptual evaluation of category goodness of /t/ and /k/ in typical and misarticulated children’s speech. The Journal of the Acoustical Society of America, 137(6), 3422–3435. https://doi.org/10.1121/1.4921033
- Sugden, E., Lloyd, S., Lam, J., & Cleland, J. (2019). Systematic review of ultrasound visual biofeedback in intervention for speech sound disorders. International Journal of Language & Communication Disorders, 54(5), 705–728. https://doi.org/10.1111/1460-6984.12478
- Van Riper, C. (1978). Speech correction. Principles and methods. Prentice-Hall.
- Van Riper, C., & Irwin, J. (1958). Voice and articulation. Prentice-Hall.
- Wickham, H. (2016). ggplot2: Elegant graphics for data analysis. New York: Springer-Verlag. Retrieved from https://ggplot2.tidyverse.org
- Wolfe, V., Martin, D., Borton, T., & Youngblood, H. C. (2003). The effect of clinical experience on cue trading for the /r-w/ contrast. American Journal of Speech-Language Pathology, 12(2), 221–228. https://doi.org/10.1044/1058-0360(2003/068)
- Wren, Y., Miller, L. L., Peters, T. J., Emond, A., & Roulstone, S. (2016). Prevalence and predictors of persistent speech sound disorder at eight years old: Findings from a population cohort study. Journal of Speech, Language, and Hearing Research, 59(4), 647–673. https://doi.org/10.1044/2015_JSLHR-S-14-0282