
Abstract
It is reported that the magnitudes of flood events in riverine systems have been increasing due to global climate change. Because flood events could displace fish species downstream and/or increase the mortality of fish, it is important to know how the increased floods can affect fish in river networks. In this study, we focused a hatchery-raised amphidromous fish, Ayu Plecoglossus altivelis altivelis in a mainstem-tributary network in Japan and examined the relative fish abundance changes before and after the recordable massive flood using the environmental DNA (eDNA) analysis. We also examined the spatiotemporal patterns of the Ayu eDNA concentrations and the relationships with tributary discharge, width, and depth to examine if the relative abundance changes could be related to tributary size. Our results indicated that Ayu tended to inhabit large, deep tributaries more than small, shallow tributaries even after the flood event. Further, the eDNA concentrations of Ayu have decreased in most study sites after the flood; however, the eDNA concentrations in certain tributaries with lower tributary size have increased during the study period. These results suggest that (1) the habitat conditions could be important for the maintenance of Ayu populations before and after flood events, (2) increase in flood magnitude along climate changes could have impacts on Ayu populations, and (3) not only large tributary, but also small tributaries could be important habitats for the target species to avoid flood disturbances.
Introduction
It is reported that the magnitude of flood event in riverine systems has been increasing due to global climate change (Tabari Citation2020; Queen et al. Citation2021). Because flood events could displace fish species downstream with unfavorable habitat conditions and/or increase the mortality of fish (Heard et al. Citation2012; Miyazono et al. Citation2020), it is important to know how the increased floods affect riverine fish. Further, introduced native fish populations (e.g. hatchery-raised fish populations) could be more vulnerable to increased flood events than natural fish populations because they may not adapt to the natural flow regime of rivers (Lytle and Poff Citation2004). Thus, understanding effects of flood events on introduced native fish populations is important for the future conservation and the maintenance of native fish populations in riverine systems relative to global climate change.
It is usually difficult to examine the abundances and habitat use of fish in a large riverine system right after massive flood events because of the sampling difficulty in the disturbed rivers. Thus, efficient and safe sampling methods to monitor the flood effects on fish populations are needed for understanding the population status of introduced native fishes in riverine systems after flood events. Recently years, environmental DNA (eDNA) analyses have been used for estimating the presence and relative abundances of aquatic faunas in riverine systems (Janosik and Johnston Citation2015; Doi et al. Citation2017). The eDNA analyses are useful sampling techniques to efficiently and safely collect the biological information at large spatial scales (e.g. river basin scale) and to survey the sites with sampling difficulty (e.g. deep, swift riverine habitats) because of the ease of the sampling (e.g. just collecting river water samples) (Darling and Mahon Citation2011; Tsuji et al. Citation2019). To our knowledge, however, there are no studies that examined massive flood effects on fish populations in riverine systems using eDNA methods except for Harada and Nagayama (Citation2022).
In this study, we focused on a hatchery-raised amphidromous fish, Ayu Plecoglossus altivelis altivelis in Japan. This species spawns in middle to downstream reaches of rivers in fall and the larvae drift to the coast and inhabit coastal marine water (Nagayama et al. Citation2022). Juvenile Ayu migrate to rivers in spring, grow in middle to upstream reaches of rivers in summer, and migrate to middle to downstream reaches of rivers for spawning (Nagayama et al. Citation2022). This fish species has high economic and recreational values in Japan; however, the natural populations have significantly decreased in Japanese rivers (Miyazono et al. Citation2022). This species has strong swimming ability and tends to prefer river segments with higher discharge and coarse substrates (e.g. cobbles) as their feeding and spawning habitats (Takahashi and Taniguchi Citation2012; Tsuboi and Takagi Citation2016; Miyazono et al. Citation2022). In addition, this fish species is a migratory herbivore and has important ecological roles (i.e. first consumer in food web and competitor over algae on the substrates) in riverine ecosystems (Katano et al. Citation2003; Abe et al. Citation2007). Thus, it is important to monitor the population status in riverine networks and reveal the flood effects on the abundances in order to estimate the population changes relative to the future climate change. The eDNA analyses already have been used for estimating the relative abundance and habitat requirement of the target fish in Japanese riverine systems (Doi et al. Citation2017; Minagawa et al. Citation2018; Naito et al. Citation2018; Inui et al. Citation2021; Harada and Nagayama Citation2022; Miyazono et al. Citation2022; Nagayama et al. Citation2022).
We hypothesize that a massive flood event could decrease Ayu populations in river mainstem because floods could displace the populations downstream. We also hypothesize that a massive flood event could decrease Ayu populations in river tributaries, but the effects of the flood could vary with tributary size (i.e. habitat size). We predicted that the Ayu eDNA concentrations in certain small tributaries could increase after the flood event because riverine fishes tend to use the tributaries as their shelters from flood disturbances in mainstem (Koizumi et al. Citation2013). Specific objectives in this study are (1) to examine spatiotemporal Ayu eDNA patterns in the mainstem-tributary network before and after the massive flood event, (2) examine if relationships between Ayu spatial abundance patterns and tributary size could change before and after the flood event, and (3) examine temporal Ayu eDNA changes from pre-flood to post-flood (right after flood and one month after flood) and the relationships with the tributary size. Our results help to estimate the important habitat conditions in riverine systems during flood seasons for the conservation of native fishes.
Materials and methods
Study area
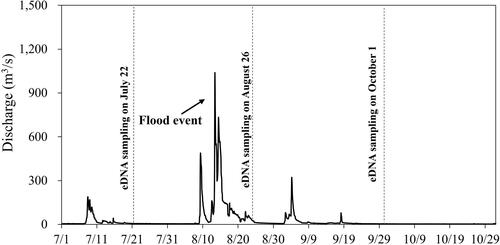
This study was conducted in the upstream segment (∼35km) of the Gonokawa River in Japan (). The Haji Dam is located at the upper end of this river segment and periodically regulates the flow conditions of the downstream reaches (e.g. release water during flood events). Most tributaries in the river segment have river revetment; however, the degree of the revetment varies among the tributaries (Miyazono et al. Citation2022). In the mid-August of 2021, the recordable flood event (the second largest discharge per day at the Yoshida Water Level Observatory in last 20 years) has occurred in the study area (). The peak flood was caused by the heavy rain with the highest cumulative precipitation per day (e.g. 255 mm per day on August 13, 2021, at the Yoshida Rainfall Observatory) in the last 40 years. The high flow condition due to the flood event continued from August 9th to August 30th. The hatchery raised Ayu (∼2,256 kg, ∼322,328 juvenile Ayu) were introduced into the study river segment from March 29 to May 12, 2021. The hatchery raised Ayu populations should have dominated the Ayu populations in the study river segment because the upstream migration of natural Ayu populations from the coast has been blocked by the Hamahara Dam in the downstream of the river (Miyazono et al. Citation2022).
Figure 1. Study sites in the Gonokawa River in Japan.
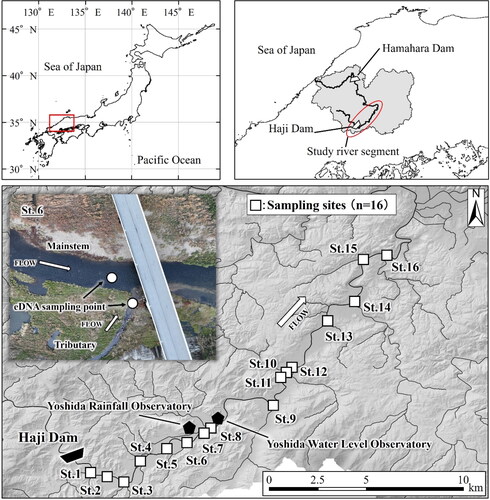
Figure 2. River discharge changes at the Yoshida water level observatory in the Gonokawa River in Japan in July–October 2021.
Data collection
A total of 96 water samples (1 L per sample) for eDNA analyses were collected from 32 sampling sites (16 mainstem sites and 16 tributary sites, ) in the river segment in July 22, August 26, and October 1 of 2021 (about one month interval). The tributary sites were located within 500 m upstream from each confluence to decrease the fish dispersal limitation to the upstream (). In addition, the mainstem sites were set in the upstream of the confluence so as not to collect the Ayu eDNA from the tributaries (). We measured the discharge of the tributary sites using a flow meter (FH950, Hach, Colorado, USA). We also measured the width and maximum depth around each sampling site as tributary size parameters.
Environmental DNA analysis
In order to decrease eDNA decomposition (Yamanaka et al. Citation2017), we added 1 mL of 10% benzalkonium chloride solution (Fujifilm Wako Pure Chemical Corporation, Osaka, Japan) to each collected water sample and placed them in a cooler with ice. We also took a 1 L deionized water (cooler blank sample: the negative control sample in a cooler box during transportation, filtration, and DNA extraction) and added 1 mL of BAC solution in the field. We took a total of nine cooler blank samples (3 samples per sampling trip). We stored the water samples and cooler blank samples in the cooler box until the filtration was done. We used GF/F glass fiber filters (diameter: 47 mm, mesh size: 0.7 μm; GE Healthcare Japan, Tokyo, Japan) for filtering the collected water samples and cooler blank samples for the collection of eDNA samples. The filtration was conducted within 48 h after collecting the water samples, and each sample was filtered 1 L per GF/F glass fiber filter. These filter samples were kept in a refrigerator at −20 °C until DNA extraction.
To extract the DNA from filter samples, we used DNeasy Blood & Tissue Kit (Qiagen, Hilden, Germany) and Salivette tube (Sarstedt K.K., Tokyo, Japan) according to Environmental DNA Sampling and Experiment Manual ver 2.2 (https://ednasociety.org/manual/) with some modifications. First, we placed a filter sample in the upper part of a Salivette tube and pre-centrifuged it at 5000×g for 1 min (Tsuji et al. Citation2022). Then, we placed a filter sample in the upper part of a Salivette tube and added 420 μL of solution containing 200-µL ultrapure water (Nacalai Tesque, Inc., Kyoto, Japan), 200-μL Buffer AL (Qiagen, Hilden, Germany), and 20-μL Proteinase K (Qiagen, Hilden, Germany). We incubated the tube with filter at 56 °C for 45 min, and then it was centrifuged at 5000×g for 3 min, and the solution was collected in the bottom part of the tube. We added the 220-μL Tris-EDTA (TE) buffer (pH 8.0; Nippon Gene Co., Ltd., Tokyo, Japan) to the filtered sample for increasing eDNA yield and re-centrifuged at 5000×g for 3 min. We then added 400 μL of ethanol (Fujifilm Wako Pure Chemical Corporation, Osaka, Japan) to the collected solution and transferred the mixture to a DNeasy Mini spin column (Qiagen, Hilden, Germany). According to the manufacturer’s instructions, we purified the total DNA and eluted it in 100-μL Buffer AE (Qiagen, Hilden, Germany). We preserved all DNA samples in a freezer (–20 °C) until real-time quantitative polymerase chain reaction (qPCR). In this study, we used 200-μL Buffer AL and 20-μL Proteinase K half the amount indicated in the manual, to extract DNA from filter samples.
We performed the real-time TaqMan qPCR using StepOnePlus real-time PCR system (Thermo Fisher Scientific, Massachusetts, USA) and species-specific primers and TaqMan probe set for Ayu developed by Yamanaka and Minamoto (Citation2016). We used 2-μL template DNA, 900 nM of each primer and 125 nM of TaqMan probe (Eurofins Genomics, Tokyo, Japan), 0.1 µL of AmpErase Uracil N-Glycosylase (Thermo Fisher Scientific, Massachusetts, USA) 4.4-µL ultrapure water (Nacalai Tesque, Inc., Kyoto, Japan), and 7.5 µL of 2 × TaqMan Environmental Master Mix (Thermo fisher scientific, Massachusetts, USA) for each 15-μL PCR mixture. The qPCR condition was as 50 °C for 2 min, 95 °C for 10 min, 55 cycles of 95 °C for 15 s, and 60 °C for 1 min. We analyzed the 2 μL of ultrapure water and dilution series of commercially synthesized artificial DNA fragment including Ayu sequence (3.0 × 101–3.0 × 10⁴ copies per qPCR reaction) simultaneously as a PCR negative control and standards in each reaction. For preparing a standard DNA, we inserted the target DNA (100 bp) into a 2659 pb of pEX-A2J2 plasmid (Eurofin Genomics, Tokyo, Japan) and digested it with a restriction enzyme, BamHI. The highest standard DNA concentration of Ayu was 3.0 × 10⁴ copies and was diluted 10 times by TE buffer until the eDNA concentration to 3.0 × 101 copies. The standard curves were constructed based on the dilution series of standard DNA (3.0 × 101–3.0 × 10⁴ copies per qPCR reaction, amplification efficiency: 81.56–97.8%, Standard Curve R2: 0.996–0.999). We run all DNA extracted samples, negative controls, and standards in triplicates on the PCR. We calculated the DNA concentrations (copies/L) by taking an average of the triplicate on the PCR analyses.
Data analyses
First, we used paired Wilcoxon tests to examine spatial (mainstem sites vs. tributary sites) differences in Ayu eDNA concentrations in each month. In this study, the eDNA concentrations indicate the relative abundance of Ayu in each site. In addition, we used Kendall rank correlation to analyze the relationships between Ayu eDNA concentrations and the tributary discharge on each month to examine if the species-habitat relationships varied with months. To examine temporal Ayu eDNA changes, we used Friedman tests to examine differences in the eDNA concentrations among the months on mainstem sites and tributary sites, respectively. Then, if there were significant differences among the months, Conover’s all-pairs comparisons tests were used to examine which pair was significantly different. Using the Kendall rank correlation, we also examined relationships of the temporal (July-August and August-October) eDNA concentration changes to the tributary discharge, width, and depth in order to understand if the temporal eDNA changes varied with tributary size in the study sites. For these analyses, the August samples of the discharge, width, and depth were used for the July-August changes, and the October samples of the discharge, width, and depth were used for the August-October changes. In addition, we used absolute changes (i.e. subtract July eDNA concentrations from August eDNA concentrations) and relative changes of eDNA concentrations between the months. The relative changes of eDNA concentrations indicate that the coefficient of variation (CV) of eDNA concentrations between the months. We multiplied the CV of eDNA concentrations that decreased from July to August and August to October by −1. The St. 11 of the tributary sites was removed from the analyses about the temporal eDNA changes because the Ayu eDNA of the St. 11 was not detected throughout sampling months and the CV was not able to be calculated. All analyses were conducted with the software R version 3.6,1 (R Core Team Citation2019). The Conover post-hoc tests and Kendall rank correlations were performed using the R package PMCMRplus version 1.9.4 (Pohlert Citation2022) and R package Kendall (McLeod Citation2015), respectively.
Results
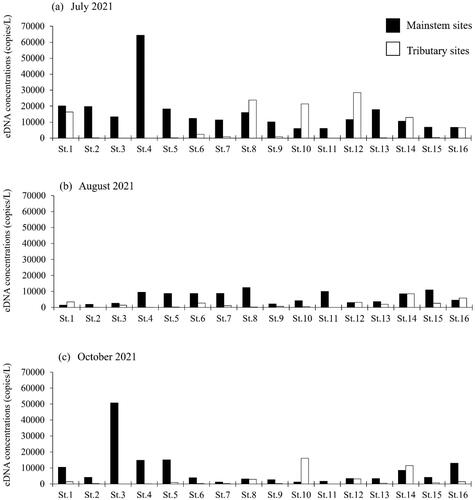
The eDNA of Ayu was present (copy number >0) in all sites of the mainstem in July, August, and October 2021 (, Table S1). On the other hand, the eDNA of Ayu was present in 13-15 sites in the tributaries in July, August, and October 2021. In July (before flood), the relative abundances (i.e. eDNA concentrations) of Ayu of the four tributary sites (St. 8, 10, 12, and 14) were higher than those of the mainstem sites adjacent to the tributary sites. There were not statistically significant differences (α = 0.05) in the Ayu eDNA concentrations between mainstem sites and tributary sites in July (paired Wilcoxon test: p = 0.057). In contrast, in August (after the flood), two tributary sites (St. 1 and 16) had higher eDNA concentrations than the mainstem sites. The Ayu eDNA concentrations in the mainstem sites were significantly higher than those in the tributary sites in August (paired Wilcoxon test: p = 0.003). In October, the eDNA concentrations of the mainstem sites still tended to be higher than those of the tributary sites (paired Wilcoxon test: p = 0.015); however, the eDNA concentrations of some large tributaries (St. 10 and 14) were higher than those of the mainstem sites adjacent to the tributary sites.
Figure 3. Ayu environmental DNA concentrations of mainstem and tributary sites in the Gonokawa River in July (a), August (b), and October (c) of 2021.
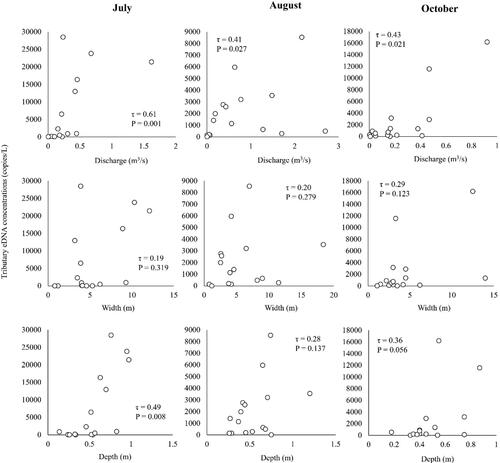
The relationships between the Ayu eDNA concentrations and tributary size variables (discharge, width, and depth) varied with the months (). In July, the eDNA concentrations of Ayu were significantly and positively correlated with river discharge (τ = 0.61, p < 0.05) and maximum depth (τ = 0.49, p < 0.05), suggesting that Ayu could be more abundant in the large, deep tributary sites than the small, shallow tributary sites. After the flood event (in August), the Ayu DNA concentrations were significantly related to only tributary discharges (τ = 0.41, p < 0.05). In October, the Ayu DNA concentrations were still significantly related to only tributary discharges (τ = 0.43, p < 0.05); however, correlations between Ayu eDNA concentrations and tributary size variables were slightly higher than those of August.
Figure 4. Relationships of Ayu environmental DNA concentrations to tributary discharge, width, and depth in the Gonokawa River in July, August, and October of 2021.
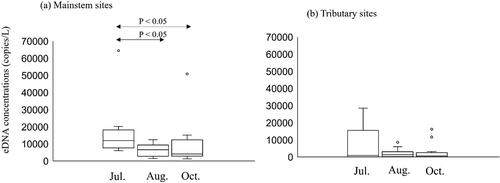
In the mainstem sites, the Ayu eDNA concentrations in 14 of 16 sites have decreased from July (preflood) to August (right after flood). In contrast, the Ayu eDNA concentrations in 8 of 16 mainstem sites have increased from August to October. The Ayu eDNA concentrations in the mainstem sites significantly differed among the months (Friedman test: p < 0.01, ). The Conover post-hoc tests indicated that the eDNA concentrations of July were significantly higher than those in August and October, suggesting that Ayu relative abundances tended to have decreased in the mainstem sites after the flood. In the tributary sites, the Ayu eDNA concentrations in 9 of 16 sites have increased from July to August. From August to October, eDNA concentrations of 10 of 16 tributary sites have decreased. However, there were not statistically significant differences in the Ayu eDNA concentrations in the tributaries among the months (Friedman test: p = 0.343, ).
Figure 5. Ayu environmental DNA concentrations in the mainstem sites (a) and tributary sites (b) in the Gonokawa River in July, August, and October of 2021.
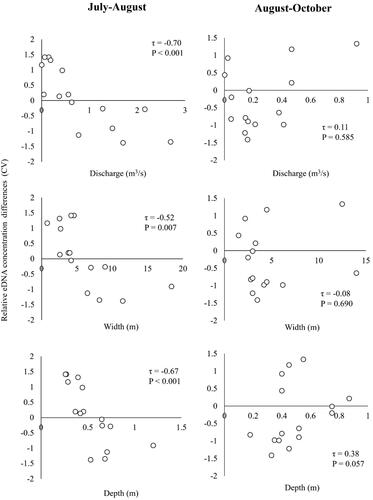
The tributary size variables were strongly related to the temporal Ayu eDNA concentration changes from July to August. Both the absolute and relative Ayu eDNA changes had significant negative relationships with the tributary discharge, width, and depth (τ = −0.42 to −0.70, p < 0.05, and ), suggesting that Ayu relative abundances could have decreased in the large tributary sites more than small tributary sites after the flood. Further, the small tributaries with the discharge ≤ 0.562m3/s had positive eDNA concentration changes, suggesting that Ayu relative abundances could have increased in these small tributaries after the flood. In contrast, both absolute and relative eDNA changes had positive relationships with the tributary discharge and depth from August to October (τ = 0.11 to 0.38, p = 0.057 to 0.585, and ), indicating that the eDNA concentrations of certain large, deep tributaries have increased two months after the flood event.
Figure 6. Relationships of temporal (July-August, August-October) absolute Ayu environmental DNA concentration differences (copies/L) to tributary discharge, width, and depth in the Gonokawa River.
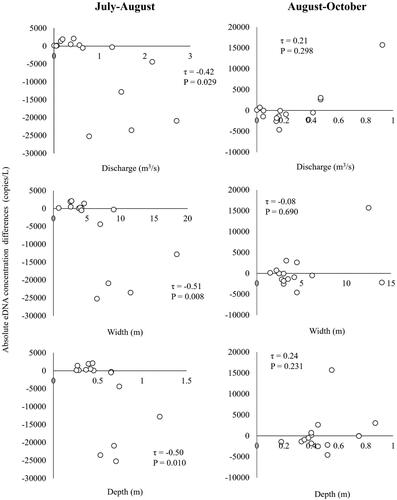
Figure 7. Relationships of temporal (July-August, August-October) relative Ayu environmental DNA concentration differences (CV) to tributary discharge, width, and depth in the Gonokawa River.
Discussion
In our study, the Ayu eDNA concentrations spatially varied throughout the months. In July (before the flood), the mainstem sites tended to have higher eDNA concentrations than the tributaries, but there was not statistically significant difference in the eDNA concentrations between the mainstem and tributary sites. This is largely because some large tributary sites (St. 8, 10, and 12) had higher Ayu eDNA concentrations than the mainstem sites. In contrast, in August (after the flood event), the Ayu eDNA concentrations of the large tributary sites (St. 8, 10, and 12) have decreased and the Ayu eDNA concentrations in the mainstem were statistically significantly higher than those in the tributaries. However, Ayu eDNA concentrations in some of the large tributaries have recovered until the October sampling. Miyazono et al. (Citation2022) conducted Ayu eDNA samplings in the same river segment of the Gonokawa River in August of 2019 (there were no recordable flood events before the sampling) and reported that there were not significant differences in the Ayu eDNA concentrations between the mainstem sites and tributary sites because Ayu eDNA concentrations in several large tributaries were higher than those in the manstem. Previous studies reported that the flood event could displace riverine fishes downstream (Nagumo et al. Citation2006; Heard et al. Citation2012; Miyazono et al. Citation2020). Our results suggest that Ayu in certain large tributaries could have been displaced the mainstem in the study sites during the flood event, increasing the eDNA concentration ratios of mainstem sites to tributaries in August. We hypothesized that food event could displace Ayu downstream with unfavorable habitat conditions, negatively affecting the Ayu populations. eDNA studies about the flood effects on fish dispersal in riverine networks are still very limited. Especially, segment-scale eDNA data showing changes in the abundance changes of riverine fishes after large floods are very rare and our findings complement the previous works.
The river discharge was positively related to Ayu eDNA concentrations on all sampling months in our study. The previous studies in other regions also reported that increased discharge could be important for the maintenance of Ayu populations in riverine habitats (Takahashi and Taniguchi Citation2012; Tsuboi and Takagi Citation2016; Miyazono et al. Citation2022). Our results agree with these previous results (Takahashi and Taniguchi Citation2012; Tsuboi and Takagi Citation2016; Miyazono et al. Citation2022). In our study, the large tributary sites tended to have higher discharge and more suitable substrate compositions (e.g. cobble) than the small tributary sites and could have more living space and better habitat conditions for Ayu throughout the flood season. Our findings complement the previous works by providing new insight, i.e. the habitat conditions in the tributaries could be important factors for Ayu populations even after the large flood event.
The relationships between the Ayu eDNA concentrations and habitat size (sizes of different tributaries) varied among the months in our study. In July (before flood event), tributary discharge and depth were the significant predictors for the eDNA concentrations. This was largely because the eDNA concentrations of large, deep tributary sites tended to be higher than those of the small, shallow tributary sites. However, after the flood event, the correlations of Ayu eDNA concentrations to tributary discharge and depth were weaker than before the flood. This was because Ayu eDNA concentrations in some large, deep tributaries with high discharge (St. 8 and St. 10) have significantly decreased from the pre-flood to the post-flood season, suggesting that the flood event could temporally affect the species-habitat relationships in the study sites.
The Ayu eDNA concentrations have significantly decreased in most study sites from the pre-flood (July) to post-flood (August); however, the Ayu eDNA concentrations of certain small tributary sites have increased from the pre-flood to post-flood. This could be because the target species may have moved and/or dispersed from the mainstem to small tributaries to avoid the flood disturbance in the mainstem. Harada and Nagayama (Citation2022) studied effects of flood disturbances on Ayu relative abundance patterns in a Japanese riverine system and reported that river segments less affected by the flood disturbances included higher Ayu eDNA concentrations, suggesting that the river segments could serve as shelters from the floods. It is also reported that other riverine fishes could use tributaries as their refugia from the flood disturbance in the main river channel (Gido et al. Citation1997; Thornbrugh and Gido Citation2010; Koizumi et al. Citation2013). Our results support these hypotheses because the small tributaries in our study sites tended to have much lower discharge and could be less affected by the flood disturbances, serving as the temporal shelters for Ayu during the flood event.
The temporal Ayu eDNA concentration changes had significant negative correlations with the tributary size variables in our study sites. The tributary sites with lower discharge, width, and depth had positive eDNA concentration changes from July to August in our study sites. Thus, tributary size could be the factor that affected the temporal eDNA concentration changes in the study sites during the flood event. However, the increase of Ayu in the small tributaries was low compared to the overall decrease of Ayu after the flood throughout the study sites (both the mainstem and tributaries). Koizumi et al. (Citation2013) conducted a fish population census in the four tributaries of the Satsunai River in central Hokkaido, Japan before (23 June 2012), during (25 June 2012), and after (28 June 2012) a flood event, and reported that fishes (e.g. Dolly Varden char, masu salmon, etc.) once evacuated from the mainstem to tributaries during the flood, but then returned to the mainstem promptly after the flood. Although study setting differs between Koizumi et al. (Citation2013) and our study, there is possibility that after most Ayu already returned to the mainstem before we conducted the eDNA sampling. This prompt emigration after the flood appears to be supported by the result that there are fewer Ayu in the tributaries with lower discharges. These suggest that it is possible that more Ayu were actually evacuated to the tributaries during the flood. Our results suggest that Ayu could have used the non-optimal habitats (i.e. small tributaries) as temporal shelters during the flood event.
In conclusion, Ayu eDNA concentrations spatially variables in our study system before and after the flood event. Our results indicate that Ayu tended to inhabit large tributaries more than small tributaries even after the flood event. The eDNA concentrations of Ayu have decreased in most study sites after the floods, suggesting that the populations of the target species could have been affected by the flood event. However, the Ayu eDNA concentrations in certain small tributaries with lower discharge have increased during the study period, suggesting that these tributaries could be less affected by the flood and serve as the temporal shelters for Ayu during the flood event. These results suggest that (1) the habitat conditions could be important for the maintenance of Ayu populations before and after flood events, (2) increase in flood magnitude along climate changes could have significant impacts on Ayu populations, and (3) not only large tributaries, but also small tributaries could be important habitats for the target species to avoid flood disturbances and use temporal refugia. Finally, our research approaches with eDNA analysis should be applicable to survey other fishes including both introduced populations and natural populations during flood seasons. Further research is needed to evaluate the eDNA based fish biomonitoring in different rivers with different flood and environmental conditions.
Author contributions
SM and YA conceived the study. SM and HM conducted environmental water sampling. HM, TH, and RN performed DNA analyses. SM and HM performed the data analyses. All authors were contributed to manuscript drafts.
Supplemental Material
Download MS Excel (19 KB)Acknowledgements
We thank Takao Kodama for the field and laboratory assistances. We also thank Enokawa Fishery Cooperative and Gonokawa Fishery Cooperative for offering the information of the Ayu introduction to us. We thank two anonymous reviewers for helpful review. The experiment reported here complied with current laws of Japan.
Disclosure statement
No potential conflict of interest was reported by the author(s).
Data availability statement
These data that support the findings of this study are available from the corresponding author upon request.
Additional information
Funding
References
- Abe S, Yodo T, Matsubara N, Iguchi K. 2007. Distribution of two sympatric amphidromous grazing fish Plecoglossus altivelis Temminck & Schlegel and Sicyopterus japonicus (Tanaka) along the course of a temperate river. Hydrobiologia. 575(1):415–422. doi: 10.1007/s10750-006-0389-4.
- Darling JA, Mahon AR. 2011. From molecules to management: adapting DNA-based methods for monitoring biological invasions in aquatic environments. Environ Res. 111(7):978–988. doi: 10.1016/j.envres.2011.02.001.
- Doi H, Inui R, Akamatsu Y, Kanno K, Yamanaka H, Takahara T, Minamoto T. 2017. Environmental DNA analysis for estimating the abundance and biomass of stream fish. Freshwater Biol. 62(1):30–39. doi: 10.1111/fwb.12846.
- Gido KB, Propst DL, Molles MC.Jr. 1997. Spatial and temporal variation of fish communities in secondary channels of the San Juan River, New Mexico and Utah. Environ Biol Fishes. 49(4):417–434. doi: 10.1023/A:1007371019190.
- Harada M, Nagayama S. 2022. Impacts of flood disturbance on the dynamics of basin-scale swimming fish migration in mountainous streams. Water. 14(4):538. doi: 10.3390/w14040538.
- Heard TC, Perkin JS, Bonner TH. 2012. Intra-annual variation in fish communities and habitat associations in a Chihuahua Desert reach of the Rio Grande/Rio Bravo Del Norte. West N Am Naturalist. 72(1):1–15. doi: 10.3398/064.072.0101.
- Inui R, Akamatsu Y, Kono T, Saito M, Miyazono S, Nakao R. 2021. Spatiotemporal changes of the environmental DNA concentrations of amphidromous fish Plecoglossus altivelis altivelis in the spawning grounds in the Takatsu River, western Japan. Front Ecol Evol. 9:622149. doi: 10.3389/fevo.2021.622149.
- Janosik AM, Johnston CE. 2015. Environmental DNA as an effective tool for detection of imperiled fishes. Environ Biol Fish. 98(8):1889–1893. doi: 10.1007/s10641-015-0405-5.
- Katano O, Aonuma Y, Nakamura T, Yamamoto S. 2003. Indirect contramensalism through trophic cascades between two omnivorous fishes. Ecology. 84(5):1311–1323. doi: 10.1890/0012-9658(2003)084[1311:ICTTCB]2.0.CO;2.
- Koizumi I, Kanazawa Y, Tanaka Y. 2013. The fishermen were right: experimental evidence for tributary refuge hypothesis during floods. Zoolog Sci. 30(5):375–379. doi: 10.2108/zsj.30.375.
- Lytle DA, Poff NL. 2004. Adaptation to natural flow regimes. Trends Ecol Evol. 19(2):94–100. doi: 10.1016/j.tree.2003.10.002.
- McLeod AI. 2015. Kendall rank correlation and Mann-Kendall trend test. R Package Version 2.2.
- Minagawa T, Akiyama H, Hazama S, Kodama S. 2018. Basic research on the evaluation of habitat and spawning bed of Ayu (Plecoglossus altivelis) by environmental data analysis. J Jpn Soc Civ Eng Ser Ser B1 (Hydraulic Engineering). 74:427–432. in Japanese
- Miyazono S, Kodama T, Akamatsu Y, Nakao R, Saito M, Tsuji S. 2022. Evaluation of the tributaries as habitats for Ayu in the Gonokawa River using environmental DNA analysis. ECE. 24(2):259–266. in Japanese) doi: 10.3825/ece.21-00011.
- Miyazono S, Pease AA, Fritts S, Grabowski TB. 2020. Ontogenetic shifts in mesohabitat use of young-of-year Rio Grande blue sucker in the big bend region of the Rio Grande. Environ Biol Fish. 103(12):1471–1480. doi: 10.1007/s10641-020-01038-8.
- Nagayama S, Sueyoshi M, Fujii R, Harada M. 2022. Basin-scale spatiotemporal distribution of ayu Plecoglossus altivelis and its relationship with water temperature from summer growth to autumn spawning periods. Landscape Ecol Eng. 19(1):21–31. doi: 10.1007/s11355-022-00509-7.
- Nagumo K, Sawahara K, Kitamura H, Mori I, Shirao T. 2006. Report on the influence that sediment-flushing from dams exercises over ayu (Plecoglossus altivelis altivelis) in the Kurobe River. Environ Eng Res. 43:473–482.
- Naito D, Akamatsu Y, Inui R, Goto M, Kobayashi T, Imamura F. 2018. Habitats of Plecoglossus altivelis in the Tama River Basin by environmental DNA. J Jpn Soc Civ Eng Ser Ser B1 (Hydraulic Engineering). 74:517–522. (in Japanese).
- Pohlert T. 2022. Calculate pairwise multiple comparisons of mean rank sums extended. R Package Version 1.9.4.
- Queen LE, Mote PW, Rupp DE, Chegwidden O, Nijssen B. 2021. Ubiquitous increases in flood magnitude in the Columbia River basin under climate change. Hydrol Earth Syst Sci. 25(1):257–272. doi: 10.5194/hess-25-257-2021.
- R Core Team. 2019. R: a language and environment for statistical computing. Vienna, Austria: R Foundation for Statistical Computing.
- Tabari H. 2020. Climate change impact on flood and extreme precipitation increases with water availability. Sci Rep. 10(1):13768. doi: 10.1038/s41598-020-70816-2.
- Takahashi S, Taniguchi N. 2012. Assessment of river-bed composition and population density of ayu Plecoglossus altivelis to estimate minimum flow charge. ECE. 15(2):197–206. (in Japanese). doi: 10.3825/ece.15.197.
- Thornbrugh DJ, Gido KB. 2010. Influence of spatial positioning within stream networks on fish assemblage structure in the Kansas River Basin, USA. Can J Fish Aquat Sci. 67(1):143–156. doi: 10.1139/F09-169.
- Tsuboi J, Takagi Y. 2016. Essential characteristics of aquatic environment for ayu habitats. Nippon Suisan Gakkaishi. 82(1):12–17. doi: 10.2331/suisan.15-00027.
- Tsuji S, Nakao R, Saito M, Minamoto T, Akamatsu Y. 2022. Pre-centrifugation before DNA extraction mitigates extraction efficiency reduction of environmental DNA caused by the preservative solution (benzalkonium chloride) remaining in the filters. Limnol. 23(1):9–16. doi: 10.1007/s10201-021-00676-w.
- Tsuji S, Takahara T, Doi H, Shibata N, Yamanaka H. 2019. The detection of aquatic macroorganisms using environmental DNA analysis—a review of methods for collection, extraction, and detection. Environ DNA. 1(2):99–108. doi: 10.1002/edn3.21.
- Yamanaka H, Minamoto T. 2016. The use of environmental DNA of fishes as an efficient method of determining habitat connectivity. Ecol Indic. 62:147–153. doi: 10.1016/j.ecolind.2015.11.022.
- Yamanaka H, Minamoto T, Matsuura J, Sakurai S, Tsuji S, Motozawa H, Hongo M, Sogo Y, Kakimi N, Teramura I, et al. 2017. A simple method for preserving environmental DNA in water samples at ambient temperature by addition of cationic surfactant. Limnol. 18(2):233–241. doi: 10.1007/s10201-016-0508-5.