
Abstract
Objective
The prevalence of asthma has gradually increased worldwide in recent years, which has made asthma a global public health problem. However, due to its complexity and heterogeneity, there are a few academic debates on the pathogenic mechanism of asthma. The study of the pathogenesis of asthma through metabolomics has become a new research direction. We aim to uncover the metabolic pathway of children with asthma.
Methods
Liquid chromatography (LC)–mass spectrometry (MS)–based metabolomic analysis was conducted to compare urine metabolic profiles between asthmatic children (n = 30) and healthy controls (n = 10).
Results
Orthogonal projections to latent structures-discrimination analysis (OPLS-DA) showed that there were significant differences in metabolism between the asthma group and the control group with three different metabolites screened out, including traumatic acid, dodecanedioic acid, and glucobrassicin, and the levels of traumatic acid and dodecanedioic acid in the urine samples of asthmatic children were lower than those of healthy controls therein. Pathway enrichment analysis of differentially abundant metabolites suggested that α-linolenic acid metabolism was an asthma-related pathway.
Conclusions
This study suggests that there are significant metabolic differences in the urine of asthmatic children and healthy controls, and α-linolenic acid metabolic pathways may be involved in the pathogenesis of asthma.
Introduction
Asthma is a complex heterogeneous disease and is the most common chronic disease in childhood (Citation1–3). With the progress of urbanization and industrialization over the years, the prevalence of asthma has increased year by year, affecting approximately 14% of children worldwide and 8.6% of children in the United States, which has now made asthma a global public health problem (Citation4,Citation5). At the same time, according to the results of an epidemiological survey about pediatric asthma in China, the 2-year prevalence rate of asthma in children aged 0–14 years increased from 0.91% in 1990 to 1.54% in 2000 to 2.32% in 2010, and the total prevalence rate increased from 1.09% in 1990 to 1.97% in 2000 to 3.02% in 2010 (Citation6,Citation7), which means that the number of children with asthma in China is constantly increasing. The rising prevalence aggravates the burden on individuals, families, and society, especially in low- and middle-income countries, making the prevention and treatment of asthma an urgent public health issue (Citation8).
Asthma is a heterogeneous disease with a wide range of variability at the genetic level and is subject to gene–environment interactions that allow different patients to differ in disease severity, natural disease course, and response to available treatments (Citation9). Because of the difficulty of early diagnosis and definitive treatment in asthma, we can elucidate the pathological mechanism of asthma at the molecular level by identifying potential diagnostic biomarkers/therapeutic targets to achieve early diagnosis and early treatment (Citation10). Metabolomics relies on advanced analytical chemistry technology and complex statistical methods to systematically analyze the dynamic changes in biological specimens (such as biological fluids, cells, and tissues), comprehensively evaluate the impact of small molecule metabolites due to disease progression or environmental changes, and then explore the feasibility of its application in pathogenesis research and clinical diagnosis (Citation11,Citation12). In recent years, metabolomics which aims at identification and quantitation of small molecules involved in metabolic reactions, provides a comprehensive assessment of biological processes in the development of childhood asthma. A multicenter prospective cohort study showed that the metabotype of infants with severe bronchiolitis characterized by high abundance of inflammatory amino acids and low abundance of polyunsaturated fatty acids had the highest risk for developing asthma (Citation13). One study showed that potential protective prenatal nutrients (vitamin D, n-3 polyunsaturated fatty acids) may alter risk of asthma and allergic disease into adolescence (Citation14). Based on the existing research results, we hypothesize that fatty acid metabolism plays an important role in the development of childhood asthma. Because of its noninvasive and convenient sampling method, urine is a widely used body fluid in metabolomic studies (Citation15). For example, Saude et al.’s study provided evidence that urine metabolomics could be used to distinguish between healthy controls, stable asthma patients, and patients with asthma exacerbations (Citation16). Taking into consideration all these issues, our study further systematically studied the metabolic mechanism of children with asthma by liquid chromatography (LC)–mass spectrometry (MS)-based untargeted metabolomics analysis, which is popular in metabolomic studies due to its high throughput, soft ionization, and good coverage of metabolites, on urine samples of children with mild to moderate asthma in China and healthy controls. The findings of our study on metabolic pathways in children with asthma may provide new therapeutic target for childhood asthma.
Methods
Study population
Thirty children with mild to moderate asthma and 10 healthy controls aged 5–10 years were enrolled from Deqing People’s Hospital between August 2022 and January 2023. The clinical manifestations of children with asthma met the following diagnostic criteria: (1) four or more cumulative episodes of recurrent coughing, wheezing, shortness of breath, and chest tightness; (2) wheezing sounds or prolonged exhalation in the lungs could be examined during the attacks; (3) previous lung function indicated a decrease in forced expiratory volume in the first second (FEV1), and the diastolic test was positive; (4) the symptoms of wheezing improved after controlled treatment. All asthmatic children were in stable condition by using inhaled corticosteroids as a maintenance medication. The control group consisted of healthy children without wheezing, and those with a history of related respiratory diseases were excluded. All participants were free of respiratory infections and had no special dietary arrangements before sampling. At recruitment, children underwent routine blood tests, lung function assessments, and total immunoglobulin E (IgE) measurements, and their demographic and atopic index data were collected. The Ethics Committee of Deqing People’s Hospital approved this study (LL2021-K21). All parents signed written informed consent before sample and data collection. All methods were carried out in accordance with the principles of the Helsinki Declaration.
Urine sample collection and preparation
One milliliter of early morning midstream urine specimens was dispensed into centrifuge tubes, 10 µL of sodium azide working solution (0.5 mg/L) was added to inhibit bacteria, and the samples were stored at −80 °C until analysis. After being thawed at room temperature, 100 µL of sample was transferred to an Eppendorf tube. After the addition of 400 µL of extract solution (methanol:acetonitrile = 1:1, containing isotopically labeled internal standard mixture), the samples were vortexed for 30 s, sonicated for 10 min in an ice-water bath, and incubated for 1 h at −40 °C to precipitate proteins. Then, the sample was centrifuged at 12,000 rpm (relative centrifugal force [RCF] = 13,800 (×g), R = 8.6 cm) for 15 min at 4 °C. The resulting supernatant was transferred to a fresh glass vial for analysis. The quality control (QC) sample was prepared by mixing an equal aliquot of the supernatants from all of the samples and was used to monitor the repeatability, stability, and reliability of the analytical methods.
LC–MS analysis
LC–MS/MS analyses were performed using an ultra-high performance liquid chromatography (UHPLC) system (Vanquish, Thermo Fisher Scientific) with a UPLC BEH Amide column (2.1 mm × 100 mm, 1.7 µm) coupled to a Q Exactive HF-X mass spectrometer (Orbitrap MS, Thermo Fisher Scientific) (Citation17). The mobile phase consisted of 25 mmol/L ammonium acetate and 25 mmol/L ammonia hydroxide in water (pH = 9.75) (A) and acetonitrile (B). The autosampler temperature was 4 °C, and the injection volume was 2 µL. The Q Exactive HF-X mass spectrometer was used for its ability to acquire MS/MS spectra in information-dependent acquisition mode in the control of the acquisition software (Xcalibur, Thermo Fisher Scientific). In this mode, the acquisition software continuously evaluates the full scan MS spectrum. The electron spray ionization source conditions were set as follows: sheath gas flow rate of 30 Arb, aux gas flow rate of 25 Arb, capillary temperature of 350 °C, full MS resolution of 120,000, MS/MS resolution of 7500, collision energy of 10/30/60 in NCE mode, and spray voltage of 3.6 kV (positive) or −3.2 kV (negative).
Data processing
The raw data were converted to the mzXML format using ProteoWizard and processed with an in-house program, which was developed using R and based on XCMS, for peak detection, extraction, alignment, and integration (Citation18). Then, an in-house MS2 database (BiotreeDB) was applied for metabolite annotation. The cutoff for annotation was set at 0.3.
After the relative standard deviation of the detected peaks was denoised, the missing values were filled up by half of the minimum value, and the internal standard normalization method was employed in this data analysis. The final dataset containing the information of peak number, sample name, and normalized peak area was imported to the SIMCA16.0.2 software package (Sartorius Stedim Data Analytics AB, Umea, Sweden) for multivariate analysis. Data were scaled and logarithmic transformed to minimize the impact of both noise and high variance of the variables. After these transformations, principal component analysis (PCA), an unsupervised analysis that reduces the dimension of the data, was carried out to visualize the distribution and grouping of the samples. 95% confidence interval in the PCA score plot was used as the threshold to identify potential outliers in the dataset. To visualize group separation and find significantly changed metabolites, supervised orthogonal projections to latent structures-discrimination analysis (OPLS-DA) were applied. Then, a 7-fold cross-validation was performed to calculate the value of R2 and Q2. R2 indicates how well the variation of a variable is explained and Q2 means how well a variable could be predicted. To check the robustness and predictive ability of the OPLS-DA model, a 200-times permutation was further conducted. Afterward, the R2 and Q2 intercept values were obtained. Here, the intercept value of Q2 represents the robustness of the model, the risk of overfitting, and the reliability of the model, which will be the smaller the better. Furthermore, the value of variable importance in the projection (VIP) of the first principal component in OPLS-DA analysis was obtained (Citation19). It summarizes the contribution of each variable to the model (Citation20). The metabolites with VIP > 1 and p < 0.05 (Student’s t-test) were considered significantly changed metabolites. The results of the differentially abundant metabolites are visualized in the form of a volcano plot and were analyzed by correlation analysis to further understand the mutual regulatory relationship between metabolites in the process of biological state change. A receiver operating characteristic (ROC) curve was plotted for each well-defined differentially abundant metabolite, and the area under the curve (AUC) was calculated to judge the diagnostic efficiency of the metabolite.
In addition, the Kyoto Encyclopedia of Genes and Genomes (KEGG) Pathway database (http://www.genome.jp/kegg/) was used for pathway enrichment analysis (Citation21,Citation22), and the corresponding differential abundance scores were determined.
Statistical analysis
The baseline characteristics of the study subjects were statistically analyzed using SPSS 25.0, with a difference of p < 0.05 being statistically significant. Binary categorical variables are represented as numbers (percentages) and were analyzed with chi-square tests. Continuous variables normally distributed are represented as the mean ± standard deviation and were analyzed with Student’s t-tests. Continuous variables that did not obey the normal distribution are represented as median (lower quartile, upper quartile) and were analyzed with Wilcoxon Mann–Whitney U tests.
Results
Baseline characteristics
A total of 40 children participated in this study: 30 asthmatic patients and 10 healthy controls. A comparison of the baseline characteristics of asthmatic and healthy subjects is presented in . There were no differences in age, sex, height, weight, BMI, white blood cell counts, percentage and count of neutrophils and eosinophils, IgE levels, or allergens (cat hair, dog hair) between children with asthma and healthy controls. There were significant differences in allergen of dust mites and lung function indicators such as FEV1, forced vital capacity (FVC), FEV1/FVC, peak expiratory flow (PEF), and forced expiratory flow (FEF)25–75 between the two groups.
Table 1. Baseline characteristics of the 40 children.
Metabolic profiling
From five QC samples and 40 experimental samples in this study, 9389 peaks were detected (Dataset S1), and 472 metabolites were retained after filtering of deviation and missing values (Dataset S2), filling of missing values, and data normalization. The dimensionality of the data was reduced by PCA, which effectively highlighted the overall distribution trend of the metabolomics data and the degree of differences between the samples. It can be seen from the dispersion point plot obtained by PCA ( and Figure S1) that the samples are basically in the 95% confidence interval. However, due to the high dimensionality and small sample size of the metabolomic data, the differences between the groups were affected by confounding factors other than the grouping variables, and the overall metabolic level difference between the asthma group and the healthy control group, as shown in the PCA scatter plot, was not significant. Subsequently, through OPLS-DA, the irrelevant variables in metabolites were filtered out to obtain more reliable information about the intergroup differences in metabolites and the degree of correlation of the experimental group. The scatter plot of the OPLS-DA model () shows that the difference between the two groups of samples is large and that the repeatability is good. Through the replacement test, the corresponding OPLS-DA model was established 200 times to obtain the R2 and Q2 values of the random model, which were higher than their original values (R2x = 0.416; R2y = 0.694; Q2 = 0.272, p < 0.05; ), indicating that the OPLS-DA model has good predictive ability.
Figure 1. Score scatter plot of PCA model for group asthma vs. control. The x- (PC1) and y- (PC2) axes indicate the first and second principal components, respectively. The circle represents the 95% confidence interval.
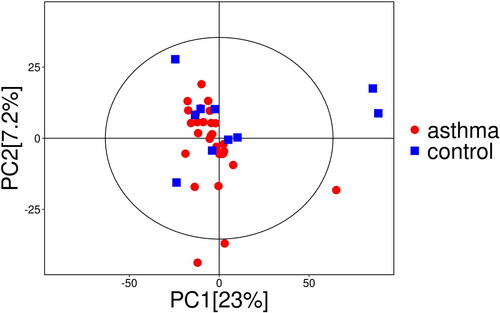
Figure 2. Score scatter plot and permutation plot test of OPLS-DA model for group asthma vs. control. (a) Score scatter plot of OPLS-DA model for group asthma vs. control. The x- (t[1]P) and y- (t[1]O) axes indicate predictive and orthogonal directions, respectively. The circle represents the 95% confidence interval. (b) Permutation plot test of OPLS-DA model for group asthma vs. control. R2 and Q2 indicate interpretability and predictability, respectively.
![Figure 2. Score scatter plot and permutation plot test of OPLS-DA model for group asthma vs. control. (a) Score scatter plot of OPLS-DA model for group asthma vs. control. The x- (t[1]P) and y- (t[1]O) axes indicate predictive and orthogonal directions, respectively. The circle represents the 95% confidence interval. (b) Permutation plot test of OPLS-DA model for group asthma vs. control. R2 and Q2 indicate interpretability and predictability, respectively.](/cms/asset/a0f440dd-bdff-4411-bd48-1850b556c460/ijas_a_2338865_f0002_c.jpg)
Potential metabolite-biomarker identification
According to VIPs > 1 and p < 0.05 of the OPLS-DA models, three metabolites associated with asthma could be selected, including traumatic acid (fatty acids), dodecanedioic acid (fatty acids), and glucobrassicin (sugars) (). As shown in , the levels of traumatic acid and dodecanedioic acid in the urine samples of asthma patients are lower than those of healthy controls, and the expression of corresponding enzyme-encoding genes may be strongly inhibited, while glucobrassicin is the opposite. To further understand whether the changes between metabolites are coordinated, differentially abundant metabolite correlation analysis was performed. According to heatmaps, there was a positive correlation between traumatic acid and dodecanedioic acid (). ROC curves were constructed, and the AUC was calculated to further evaluate the diagnostic efficacy of the above metabolites. All three metabolites had a certain accuracy (AUC 0.7–0.8) ().
Figure 3. Volcano plot for group asthma vs. control. The x-axis indicates the change in multiples of each substance in the group (taking the logarithm base 2), and the y-axis represents the p value of the Student’s t-test (taking the negative logarithm base 10). Significantly up-regulated metabolites are shown in red, significantly down-regulated metabolites are shown in blue, and non-significantly differentiated metabolites are shown in gray.
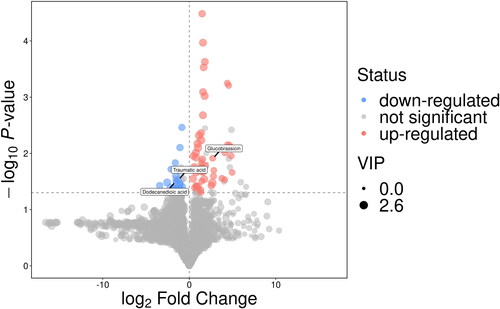
Figure 4. Heatmap of correlation analysis for group asthma vs. control. The x- and y-axes represent the differential metabolites in this group of contrasts, with red indicating a positive correlation and blue indicating a negative correlation.
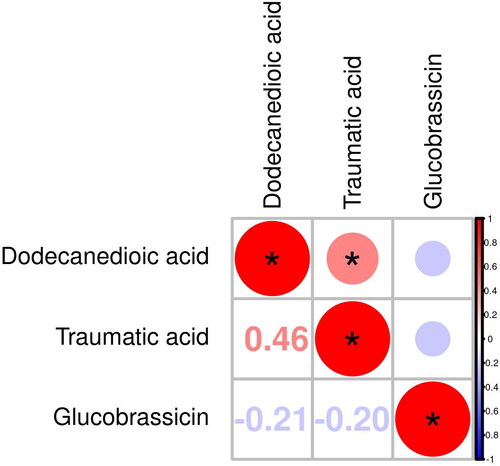
Figure 5. ROC analysis for distinguishing asthma patients from healthy controls. (a) ROC analysis of dodecanedioic acid (AUC = 0.75). (b) ROC analysis of glucobrassicin (AUC = 0.74). (c) ROC analysis of traumatic acid (AUC = 0.74).
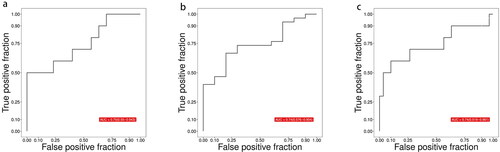
Table 2. Identification of differentially abundant metabolites in urine between asthmatic and healthy subjects.
Construction of metabolic pathways based on differential metabolites
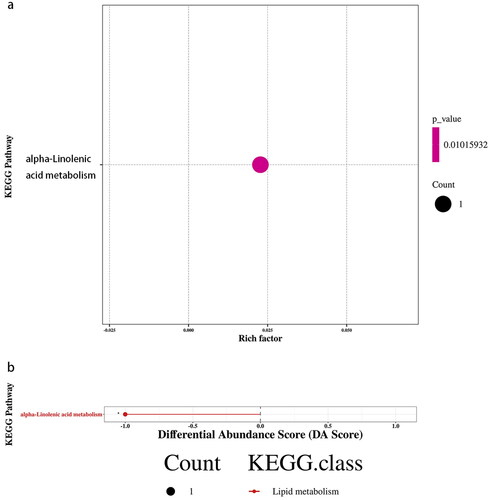
Through the analysis of metabolic and regulatory pathways, a more comprehensive and systematic understanding of the changes in biological processes caused by changes in experimental conditions can be obtained. The differentially abundant metabolites were introduced into the KEGG pathway database for analysis, obtaining a metabolic pathway – α-linolenic acid metabolism-Homo sapiens (human) (hsa00592) – in which the level of traumatic acid decreased (). According to the enrichment results of differentially abundant metabolites in the KEGG metabolic pathway, this metabolic pathway belongs to lipid metabolism (p < 0.05, Rich Factor = 0.023) (). Differential abundance scores showed that the overall expression of the pathway tended to be downregulated ().
Figure 6. Metabolic pathways. Blue represents down-regulated significantly differentiated metabolites.
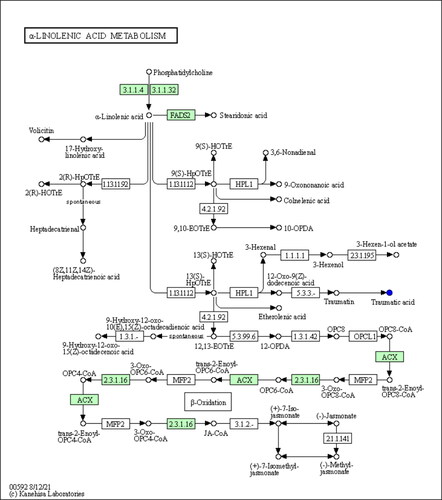
Figure 7. KEGG enrichment and differential abundance score for group asthma vs. control. (a) KEGG Enrichment for group asthma vs. control. The x-axis represents the Rich Factor, and the y-axis represents the KEGG metabolic pathway name. The color indicates the size of the p value, and the smaller the p value, the redder the color. (b) Differential Abundance Score for group asthma vs. control. The x-axis represents the DA Score and the y-axis represents the KEGG metabolic pathway name. The DA Score reflects the overall change of all metabolites in the metabolic pathway, and the score −1 indicates a downward trend in the expression of all annotated differential metabolites in the pathway.
Discussion
Asthma has an early onset compared to other chronic diseases and has a long-term negative impact on patients’ quality of life (Citation23). However, the current diagnosis of asthma is mainly based on patients’ clinical symptoms, pulmonary function tests, and drug treatment response, which cannot determine whether patients have the disease in an early stage (Citation8). Therefore, the prevention, diagnosis, and treatment of early asthma can be successfully achieved through noninvasive detection of airway dysfunction and inflammation and early diagnosis by identifying biomarkers (Citation24). Metabolomics can reveal the underlying mechanism of disease through the quantitative analysis of small molecules in organisms. Therefore, in this study, we analyzed and compared the urine metabolic profiles of asthmatic children and healthy controls based on the LC–MS metabolomics method to deepen the understanding of the pathophysiological pathways of childhood asthma. In this study, we observed differences in three metabolic substances and one metabolic pathway between children with asthma and healthy controls, which means that we may be able to use these differences to prevent and manage asthma disease in the future.
Some previous studies have identified some metabolites in the metabolic profile of asthma as possible biomarkers by using biological fluids from clinical samples combined with metabolomic approaches. Among them, several studies have reached similar conclusions. For example, differences in the gut microbiota result in lower expression levels of α-linolenic acid metabolism in patients with allergic rhinitis than in nonallergic rhinitis individuals (Citation25). Rohmann et al. reported that analysis of serum markers in allergic patients based on Fourier transform ion cyclotron resonance mass spectrometry (FT-ICR-MS) metabolomics revealed enrichment of the α-linolenic acid metabolic pathway and the found metabolic marker OPC6-CoA, which overlapped with the metabolic pathway of traumatic acid in our study (Citation26). Asthma, as a heterogeneous disease of multiple gene–environment interactions, is often associated with type 2 inflammation, and many allergen components can induce the onset of asthma (Citation9,Citation27). Therefore, research on allergies can support the close relationship between α-linolenic acid metabolism and asthma to a certain extent. In addition, Zhu et al. analyzed the rhinitis metabolomic analysis of infants hospitalized with bronchiolitis and concluded that infants with metabolic type B (high abundance of amino acids and low abundance of polyunsaturated fatty acids) have a significantly higher risk of asthma with an enriched amino acid and α-linolenic acid/linoleic acid metabolic pathway (Citation13). Taken together, these observations confirm that dysregulation of α-linolenic acid metabolism plays a key role in the development of childhood asthma and may serve as a new therapeutic target for asthma.
α-Linolenic acid is an indispensable polyunsaturated fatty acid in the human body, and its role as an immunomodulator has been shown to be associated with asthma (Citation28). α-Linolenic acid can be converted into eicosapentaenoic acid in the human body, thereby inhibiting arachidonic acid metabolism and blocking leukotriene production in vitro and inflammatory processes in vivo (Citation29,Citation30). Observational studies and randomized controlled trials have also shown that polyunsaturated fatty acids have a protective effect on the development of asthma: maternal intake of high levels of omega-3 polyunsaturated fatty acids during pregnancy reduces the risk of asthma and wheezing in offspring (Citation14). Meanwhile, a higher plasma ratio of omega-3 polyunsaturated fatty acids in childhood and adolescence was associated with a 22% lower risk of asthma in early adulthood (Citation31). According to our experimental results, the downregulated traumatic acid that is the product of α-linolenic acid metabolism, along with dodecanedioic acid, belongs to the category of fatty acids and shows a positive correlation (). Therefore, it can be inferred that fatty acids, including α-linolenic acid, will be affected to some extent in children with asthma, which may provide new therapeutic target for children with asthma in the future.
Our study has several potential limitations. First, the sample size of this study is relatively small, and the results cannot be completely extrapolated to all patients with asthma, which needs to be verified by larger studies. Second, this study is a cross-sectional study that lacks time and cannot confirm the causal relationship between urine metabolic changes and asthma. A longitudinal study to assess the temporal dynamics of the identified metabolic changes in children with asthma will be needed. Third, the molecular/cellular biological mechanisms of asthma and differentially abundant metabolites need to be further elucidated. Fourth, there are other possible confounding factors in this study, such as race, lifestyle, and diet.
Conclusions
In conclusion, this study suggests that metabolic differences can be observed in the urine samples of asthmatic patients and healthy controls, and α-linolenic acid metabolic pathways may be involved in the pathogenesis of asthma, which will help further study metabolically targeted strategies for asthma prevention and treatment.
Author contributions
Data curation: Jianlong Gao and Genli Pan. Formal analysis: Jianlong Gao, Sainan Jiang, Yiting Zhou, and Siyi Jin. Investigation: Jianlong Gao and Genli Pan. Methodology: Yiting Zhou, Siyi Jin and Yuan Jiang. Supervision: Genli Pan and Yuan Jiang. Validation: Genli Pan and Yuan Jiang. Writing – original draft: Sainan Jiang and Yiting Zhou. Writing – review and editing: Sainan Jiang and Yuan Jiang.
Ethical approval
The study was conducted in accordance with the Declaration of Helsinki and approved by the Ethics Committee of Deqing People’s Hospital (protocol code LL2021-K21 on 21 June 2021).
Consent form
Informed consent was obtained from all subjects and guardians involved in the study. Written informed consent has been obtained from the patients’ guardians to publish this paper.
Supplemental Material
Download MS Word (53.7 KB)Acknowledgements
We thank all children enrolled in this study and all guardians for their support. Also, we thank all doctors and nurses who have participated in this study. We would like to express our gratitude to BioTree Biotechnology Co., Ltd., Shanghai, China for the suggestions regarding the metabonomic analysis.
Disclosure statement
The authors have no conflicts of interest to declare.
Data availability statement
Data available on request due to restrictions, e.g., privacy or ethical.
Additional information
Funding
References
- Shipp CL, Gergen PJ, Gern JE, Matsui EC, Guilbert TW. Asthma management in children. J Allergy Clin Immunol Pract. 2023;11(1):9–18. doi:10.1016/j.jaip.2022.10.031.
- Sun T, Yu HY, Yang M, Song YF, Fu JH. Risk of asthma in preterm infants with bronchopulmonary dysplasia: a systematic review and meta-analysis. World J Pediatr. 2023;19(6):549–556. doi:10.1007/s12519-023-00701-1.
- Lisik D, Ermis S, Ioannidou A, Milani GP, Nyassi S, Spolidoro GCI, Kankaanranta H, Goksör E, Wennergren G, Nwaru BI. Is sibship composition a risk factor for childhood asthma? Systematic review and meta-analysis. World J Pediatr. 2023;19(12):1127–1138. doi:10.1007/s12519-023-00706-w.
- Naja AS, Permaul P, Phipatanakul W. Taming asthma in school-aged children: a comprehensive review. J Allergy Clin Immunol Pract. 2018;6(3):726–735. doi:10.1016/j.jaip.2018.01.023.
- Kuruvilla ME, Vanijcharoenkarn K, Shih JA, Lee FE. Epidemiology and risk factors for asthma. Respir Med. 2019;149:16–22. doi:10.1016/j.rmed.2019.01.014.
- Guo X, Li Z, Ling W, Long J, Su C, Li J, Liang S, Su L. Epidemiology of childhood asthma in mainland China (1988-2014): a meta-analysis. Allergy Asthma Proc. 2018;39(3):15–29. doi:10.2500/aap.2018.39.4131.
- National Cooperative Group on Childhood Asthma; Institute of Environmental Health and Related Product Safety, Chinese Center for Disease Control and Prevention; Chinese Center for Disease Control and Prevention. [Third nationwide survey of childhood asthma in urban areas of China]. Zhonghua Er Ke Za Zhi. 2013;51:729–735.
- Papi A, Brightling C, Pedersen SE, Reddel HK. Asthma. Lancet. 2018;391(10122):783–800. doi:10.1016/s0140-6736(17)33311-1.
- Mims JW. Asthma: definitions and pathophysiology. Int Forum Allergy Rhinol. 2015;5(Suppl 1):S2–S6. doi:10.1002/alr.21609.
- Li S, Liu J, Zhou J, Wang Y, Jin F, Chen X, Yang J, Chen Z. Urinary metabolomic profiling reveals biological pathways and predictive signatures associated with childhood asthma. J Asthma Allergy. 2020;13:713–724. doi:10.2147/jaa.S281198.
- Li H, Duan C, Zhou L, Wang M. [Application progress of metabonomics evaluation methods in bronchial asthma]. Zhonghua Wei Zhong Bing Ji Jiu Yi Xue. 2021;33(8):1021–1024. doi:10.3760/cma.j.cn121430-20210128-00157.
- Wishart DS. Metabolomics for investigating physiological and pathophysiological processes. Physiol Rev. 2019;99(4):1819–1875. doi:10.1152/physrev.00035.2018.
- Zhu Z, Camargo CAJr., Raita Y, Fujiogi M, Liang L, Rhee EP, Woodruff PG, Hasegawa K. Metabolome subtyping of severe bronchiolitis in infancy and risk of childhood asthma. J Allergy Clin Immunol. 2022;149(1):102–112. doi:10.1016/j.jaci.2021.05.036.
- Sordillo JE, Rifas-Shiman SL, Switkowski K, Coull B, Gibson H, Rice M, Platts-Mills TAE, Kloog I, Litonjua AA, Gold DR, et al. Prenatal oxidative balance and risk of asthma and allergic disease in adolescence. J Allergy Clin Immunol. 2019;144(6):1534–1541.e5. doi:10.1016/j.jaci.2019.07.044.
- Xu S, Panettieri RAJr, Jude J. Metabolomics in asthma: a platform for discovery. Mol Aspects Med. 2022;85:100990. doi:10.1016/j.mam.2021.100990.
- Saude EJ, Skappak CD, Regush S, Cook K, Ben-Zvi A, Becker A, Moqbel R, Sykes BD, Rowe BH, Adamko DJ. Metabolomic profiling of asthma: diagnostic utility of urine nuclear magnetic resonance spectroscopy. J Allergy Clin Immunol. 2011;127(3):757–764.e6. doi:10.1016/j.jaci.2010.12.1077.
- Wang J, Zhang T, Shen X, Liu J, Zhao D, Sun Y, Wang L, Liu Y, Gong X, Liu Y, et al. Serum metabolomics for early diagnosis of esophageal squamous cell carcinoma by UHPLC-QTOF/MS. Metabolomics. 2016;12(7):116. doi:10.1007/s11306-016-1050-5.
- Smith CA, Want EJ, O’Maille G, Abagyan R, Siuzdak G. XCMS: processing mass spectrometry data for metabolite profiling using nonlinear peak alignment, matching, and identification. Anal Chem. 2006;78(3):779–787. doi:10.1021/ac051437y.
- Trygg J, Wold S. Orthogonal projections to latent structures (O-PLS). J Chemom. 2002;16(3):119–128. doi:10.1002/cem.695.
- Saccenti E, Hoefsloot HCJ, Smilde AK, Westerhuis JA, Hendriks MMWB. Reflections on univariate and multivariate analysis of metabolomics data. Metabolomics. 2014;10(3):361–374. doi:10.1007/s11306-013-0598-6.
- Kanehisa M, Goto S. KEGG: Kyoto Encyclopedia of Genes and Genomes. Nucleic Acids Res. 2000;28(1):27–30. doi:10.1093/nar/28.1.27.
- Kanehisa M, Sato Y, Kawashima M, Furumichi M, Tanabe M. KEGG as a reference resource for gene and protein annotation. Nucleic Acids Res. 2016;44(D1):D457–D462. doi:10.1093/nar/gkv1070.
- Asher I, Pearce N. Global burden of asthma among children. Int J Tuberc Lung Dis. 2014;18(11):1269–1278. doi:10.5588/ijtld.14.0170.
- Papamichael MM, Katsardis C, Sarandi E, Georgaki S, Frima ES, Varvarigou A, Tsoukalas D. Application of metabolomics in pediatric asthma: prediction, diagnosis and personalized treatment. Metabolites. 2021;11(4):251. doi:10.3390/metabo11040251.
- Zhu L, Xu F, Wan W, Yu B, Tang L, Yang Y, Du Y, Chen Z, Xu H. Gut microbial characteristics of adult patients with allergy rhinitis. Microb Cell Fact. 2020;19(1):171. doi:10.1186/s12934-020-01430-0.
- Rohmann N, Munthe L, Schlicht K, Geisler C, Demetrowitsch TJ, Bang C, Jensen-Kroll J, Türk K, Bacher P, Franke A, et al. Differential effects of obesity, hyperlipidaemia, dietary intake and physical inactivity on type I versus type IV allergies. Nutrients. 2022;14(11):2351. doi:10.3390/nu14112351.
- Rodriguez Del Rio P, Liu AH, Borres MP, Södergren E, Iachetti F, Casale TB. Asthma and allergy: unravelling a tangled relationship with a focus on new biomarkers and treatment. Int J Mol Sci. 2022;23(7):3881. doi:10.3390/ijms23073881.
- Wendell SG, Baffi C, Holguin F. Fatty acids, inflammation, and asthma. J Allergy Clin Immunol. 2014;133(5):1255–1264. doi:10.1016/j.jaci.2013.12.1087.
- Yuan Q, Xie F, Huang W, Hu M, Yan Q, Chen Z, Zheng Y, Liu L. The review of alpha-linolenic acid: sources, metabolism, and pharmacology. Phytother Res. 2022;36(1):164–188. doi:10.1002/ptr.7295.
- Arm JP, Boyce JA, Wang L, Chhay H, Zahid M, Patil V, Govindarajulu U, Ivester P, Weaver KL, Sergeant S, et al. Impact of botanical oils on polyunsaturated fatty acid metabolism and leukotriene generation in mild asthmatics. Lipids Health Dis. 2013;12(1):141. doi:10.1186/1476-511x-12-141.
- Ekström S, Sdona E, Klevebro S, Hallberg J, Georgelis A, Kull I, Melén E, Risérus U, Bergström A. Dietary intake and plasma concentrations of PUFAs in childhood and adolescence in relation to asthma and lung function up to adulthood. Am J Clin Nutr. 2022;115(3):886–896. doi:10.1093/ajcn/nqab427.