
Abstract
The total climate, air quality, and health impact of aircraft black carbon (BC) emissions depend on quantity (mass and number concentration) as well as morphology (fractal dimension and surface area) of emitted BC aggregates. This study examines multiple BC emission metrics from a gas turbine with a double annular combustor, CFM56-5B4-2P. As a part of the SAMPLE III.2 campaign, concurrent measurements of particle mobility, particle mass, particle number concentration, and mass concentration, as well as collection of transmission electron microscopy (TEM) samples, allowed for characterization of the BC emissions. Mass- and number-based emission indices were strongly influenced by thrust setting during pilot combustion and ranged from <1 to 208 mg/kg-fuel and 3 ×× 1012 to 3 ×× 1016 particles/kg-fuel, respectively. Mobility measurements indicated that mean diameters ranged from 7 to 44 nm with a strong dependence on thrust during pilot-only combustion. Using aggregation and sintering theory with empirical effective density relationships, a power-law relationship between primary particle diameter and mobility diameter is presented. Mean primary particle diameter ranged from 6 to 19 nm; however, laser-induced incandescence (LII) and mass-mobility-calculated primary particle diameters demonstrated opposite trends with thrust setting. Similarly, mass-mobility-calculated aggregate mass specific surface area and LII-measured surface area were not in agreement, indicating both methods need further development and validation before use as quantitative indicators of primary particle diameter and mass-specific surface area.
Copyright 2015 American Association for Aerosol Research
1. INTRODUCTION
Aircraft gas turbine engines emit particulate matter (PM) arising from incomplete combustion of fuel, lubrication oil, and the conversion of fuel sulfur compounds (Timko et al. Citation2010). Non-volatile carbonaceous PM is referred to as soot, of which the fraction that is light-absorbing is referred to as black carbon (BC) (Petzold et al. Citation2013). BC emitted by aircraft engines has a positive direct radiative forcing (Lee et al. Citation2010; Stettler et al. Citation2013) and emitted BC particles are a significant source of ice nuclei, which affect the formation of contrails (Schumann et al. Citation2002; Kärcher and Yu Citation2009; Schumann et al. Citation2013) and aviation-induced cloudiness (Lee et al. Citation2010). These indirect climate effects are potentially significant, yet remain highly uncertain due to poor understanding of the effect of BC particle composition and morphology on ice nucleation (Bond et al. Citation2013).
Aircraft emissions during landing and takeoff lead to elevated ambient concentrations of PM, particularly in the vicinity of airports (Westerdhal et al. Citation2008; Zhu et al. Citation2011). As gas turbine soot aggregates typically have a mobility diameter less than 100 nm (Kinsey et al. Citation2010), health effects are potentially elevated as ultra-fine PM (<100 nm) could have greater health effects than PM2.5 (<2.5 µm) (Cassee et al. Citation2013). PM surface area impacts the reactivity of particles in the upper atmosphere and influences the uptake of sulfuric acid (Zhang et al. Citation2008). In addition to the size characteristics of PM, the toxicity of PM may depend upon the composition, surface chemistry, and surface charge (Bakand et al. Citation2012). Modeling studies have shown that morphology can affect the deposition of soot aggregates in the human respiratory tract (Broday and Rosenzweig Citation2011).
Emissions of soot from gas turbine engines emanate from the incomplete combustion of fuel in the combustion chamber, the combustor. In a conventional combustor, soot is formed in the region into which fuel is sprayed, initially by PAH inception and then surface growth mechanisms (Hall et al. Citation1997; Wen et al. Citation2003). Downstream of this region, soot is consumed by oxidation processes as fuel and air mixing and addition of dilution air increase the air-to-fuel ratio. The difference between these two processes determines the concentration of soot in the engine exhaust (Cumpsty Citation2003; Lefebvre and Ballal Citation2010). The rate of soot formation increases with combustion temperature, which is influenced both by the combustor inlet temperature and local air-to-fuel ratios (Wen et al. Citation2003). Combustor inlet temperature increases with increasing engine thrust setting, and in conventional combustors combustion temperatures generally increase concomitantly, as evidenced by higher NOx emissions at higher engine thrust settings (EASA Citation2012).
Existing measurements of modern gas turbine PM emissions have focused on PM mass and number emissions indices (EI), emissions normalized by fuel burnt, and show that the mass EI is greatest at higher engine thrust settings (Wey et al. Citation2006; Lobo et al. Citation2008; Timko et al. Citation2010; Lobo et al. Citation2015). These existing measurements correspond to engines with conventional annular combustors. Using high-resolution transmission electron microscopy (HRTEM), Vander Wal et al. Citation(2014) reported that the nanostructure of the aggregate primary particles is amorphous at low engine thrust settings and becomes more “graphitic” at higher engine thrust settings, suggestive of different soot growth mechanisms at different combustion temperatures. Also using TEM, Liati et al. Citation(2014) showed that the primary particle size of soot aggregates was dependent on the engine thrust setting; the mode of the primary particle size distribution increased from 13 to 24 nm from 7 to 100% of maximum engine thrust setting. Durdina et al. Citation(2014) showed that BC aggregate effective density is a function of engine thrust setting for a given aggregate mobility diameter and that the mass-mobility exponent ranged from 2.37 to 2.64 for 3–5% and 50–100% engine thrust settings, respectively.
In contrast to conventional combustors, double annular combustors (DACs) have two stages of operation: a pilot stage in the outer annulus of the combustor, and a main stage in the inner annulus. Only the outer (pilot) stage is fueled during light-off and at low power and is characterized by low local air-to-fuel ratios and low through-flow velocity to achieve good ignition and low CO and HC emissions. The main stage is characterized by high local air-to-fuel ratios and high velocity to provide a lean flame and lower combustion temperatures (Stickles and Barrett Citation2013). Compared to the conventional combustor on the CFM56–5B4 engine, the DAC combustor operating with the main stage reduces NOx emissions by ˜40% (EASA Citation2012).
Soot aggregate morphology also affects the particle's scattering and radiative properties. Radney et al. Citation(2014) showed that while the mass specific absorption cross-section is independent of aggregate morphology, there is increased scattering for a more compacted soot morphology and a concomitant increase in mass specific extinction cross-section. Furthermore, Yon et al. Citation(2014) have shown that multiple scattering effects can influence optical absorption measurements using laser-induced incandescence (LII).
An analysis of the morphology of gas turbine soot and the dependence on engine operating conditions is vital to improved understanding of the climate and health impacts of aircraft PM and also to the correct interpretation of measurements using optical techniques. This article, therefore, aims to quantify the PM mass and number EI, as well as provide an analysis of the morphology of solid particulate matter exhausted from a DAC gas turbine. Multiple in-situ and ex-situ analysis techniques are compared to measure fundamentally distinct parameters of the soot aerosol. Combinations of measurements taken as a part of the SAMPLE III.2 campaign are used to determine morphology metrics that are critical in understanding the atmospheric and human health impacts of turbine particle emissions. The specific morphology metrics measured and inferred within this study are aggregate mobility distribution, mean particle specific surface area, and mean primary particle diameter as a function of aggregate mobility diameter and engine thrust setting.
2. APPROACH
The SAMPLE III.2 campaign was conducted at the SR Technics turbine engine test facility in Zurich, Switzerland, from 23 April to 4 May 2012. The campaign consisted of “piggy-back” tests of turbines being validated after maintenance procedures as well as “dedicated” turbine engine testing that is the focus of this work. The dedicated test engine was a CFM International CFM56–5B4-2P engine (120 kN thrust) with double annular staged combustion fueled with Jet A-1 with an estimated sulfur concentration of 300 to 800 ppm. Further details of the testing approach and apparatus are described by Crayford et al. Citation(2012). This study focused on characterizing solid particulate matter and therefore all measurements and sampling were taken downstream of a catalytic stripper (CS) or volatile particle remover (VPR; Khalek and Kittelson Citation1995; Giechaskiel et al. Citation2008, Citation2010; Swanson and Kittelson Citation2010).
2.1. Experimental
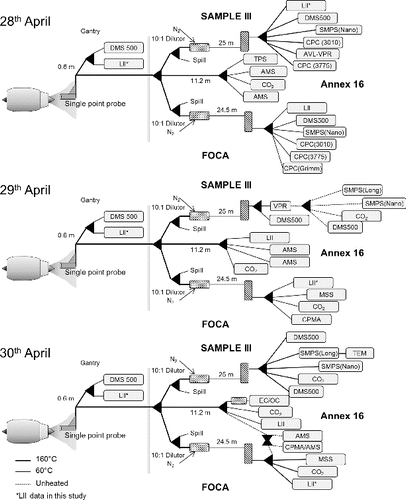
The experimental apparatus used to collect, condition, and transport the aircraft turbine exhaust to the aerosol characterization instruments on each sample line is shown in . Data included herein was from 28–30 April 2012 test dates. Geometric and operational details of the sampling and transport components are described by Crayford et al. Citation(2012). The characterization instruments and measurement techniques employed during the campaign were as follows and have previously been reviewed in this context by Petzold et al. Citation(2011).
FIG. 1. Schematic of 28–30 April 2012 sampling system during SAMPLE III.2 campaign.
2.1.1. Aerosol Thermal Conditioning (Catalytic Stripper and VPR)
Semi-volatile material was removed by using a CS or VPR. The CS contained two geometrically dissimilar catalyzed ceramic substrates: an oxidizing catalyst and a sulfur trap both heated to 350°C. The purpose of the oxidation catalyst is to remove the semi-volatile hydrocarbon particles and vapor. The sulfur trap removes sulfur species by adsorption. The VPR approach is similar to the CS in intent but different in methodology. It includes a 100:1 dilution of the exhaust with air heated to 150°C, a heated section with a wall temperature in the range 350°C, a room temperature dilution section to reduce the particle concentration to less than approximately 10,000 particles/cm3, and a particle number counter (condensation particle counter) with 50% detection efficiency of 23 nm.
2.1.2. Particle Concentration Measurement
Particle concentration was determined by use of condensational particle counters (CPCs) with 5, 10, and 23 nm cut points, where cutpoint is defined as the particle diameter at which the particle detection efficiency is 50% (D50). Both TSI (Model 3775, 5 nm D50; Model 3772, 10 nm D50; and Model 3010, 23 nm D50) and Grimm (Model 5435, 10 nm D50) CPCs were used in the study of two separate lines, the FOCA and SAMPLE. Additional particle concentration information is given by mobility measurement devices, DMS500 (Cambustion) and SMPS (TSI), but are used as a secondary indicator of particle concentration for purposes of this study. All particle concentrations used in this study were measured downstream of a VPR (AVL APC489-CS).
2.1.3. Electrical Mobility Sizing
Particle mobility (“size”) distributions were measured using TSI scanning mobility particle sizers (SMPS; Wang and Flagan Citation1990) with 3085 nano-DMAs and 3081 long-DMAs both configured with 10:1 sheath/aerosol flowrates. The SMPS were sometimes located in the secondary dilution vent line downstream of an AVL APC (Giechaskiel et al. Citation2008; Giechaskiel et al. Citation2010). A DMS500 (Reavell et al. Citation2002; Biskos et al. Citation2005) was used with its standard configuration.
2.1.4. Mass Mobility Sizing (Centrifugal Particle Mass Analyzer, CPMA)
The centrifugal particle mass analyzer (CPMA) classifies particles by their mass-to-charge ratio by balancing the electrostatic and centrifugal forces between two concentric cylinders in motion relative to each other (Olfert and Collings Citation2005). To determine the real-time effective particle density, particles with a given mass-to-charge ratio were transferred to the (modified, “m”) DMS500, which classified particles by their electrical mobility (Reavell et al. Citation2002; Biskos et al. Citation2005) as described by Crayford et al. Citation(2012). Multiple charge correction was used in interpreting the combined CPMA and DMS results.
2.1.5. Laser-Induced Incandescence
Artium Technologies' LII-300 measures the thermal emission (incandescent light) from particles heated by a pulsed laser to temperatures in the 2500 K to 4500 K range (Snelling et al. Citation2005), making it appropriate for measuring the solid particles produced by a combustion source. The selectivity is due to the fact that the solid particles are primarily “black,” such that they absorb laser radiation and incandesce over a broad spectral range. With careful control of the laser fluence, the instrument heats the particles to the point of sublimation but not beyond, so that there is no significant mass loss while still achieving the high temperatures necessary for the incandescence to be detected.
2.1.6. Soot-Particle Aerosol Mass Spectrometer (SP-AMS)
The soot-particle aerosol mass spectrometer (SP-AMS) is used for size and composition analysis of solid and semi-volatile submicron aerosol (Jayne et al. Citation2000; Onasch et al. Citation2012). Aerosols are sampled at ambient pressure by an aerodynamic lens that contracts and expands the sampled air stream through a series of orifices. Solid particles are vaporized by a continuous-beam laser operated at 1064 nm. The resulting vapor is then ionized by electron impact at 70 eV; ions are then mass analyzed within a high-resolution time-of-flight chamber. Comparisons of aggregate AMS vacuum aerodynamic diameter with mobility diameter were used to determine the dynamic shape factor, χ, in accordance with DeCarlo et al. Citation(2004). The resulting shape factors, shown in Figure S8 (available online), were equal to or less than 1, and were concluded as biased due to the insensitivity of the AMS to aggregates with a vacuum aerodynamic diameter less than 50 nm. Further work is needed to improve the sensitivity of AMS for aggregates with diameters less than 50 nm in order to make definitive measurements of dynamic shape factors for gas turbine particles.
2.1.7. Transmission Electron Microscopy
Particles were collected onto 3 mm lacey carbon (Cu Holey carbon film 400 mesh, Agar Scientific) TEM grids using thermophoresis (Just Citation2012) and electrophoresis techniques (Fierz et al. Citation2007). The flow of the thermophoretic sampler (1 L min−1, ±50 cm3 min−1) resulted in impaction of large particles and thus an oversampling of large aggregates. Therefore, the TEM-measured primary particle data was corrected using a relation between aggregate and primary particle diameter in accordance with Dastanpour and Rogak Citation(2014). An empirical power correlation between volume-area primary particle diameter, , and aggregate mobility diameter,
, were fitted (
, see Section 2.2) to the entire TEM database. Then mean mobility diameters from multiple mobility measurements were used to determine the volume-area primary particle diameter for 28 April at each RPM test point. The resulting TEM-determined volume-area primary particle diameters were compared with measurements from mass-mobility relations and LII.
2.1.8. Line Loss Correction
The particle mass and number correction factors for line losses were determined in accordance with ASME E-31 committee's procedure of using the downstream measured particle number mobility distribution with a mobility-dependent line loss curve to determine the initial particle mobility distribution at the exit plane of the engine. The line loss penetration was calculated using the United Technologies Research Centre (UTRC) model that contains conventional aerosol theory diffusion, thermophoretic and inertial losses (Liscinsky et al. Citation2010), and accounted for the 25 m line length and line temperature of 160°C. For purposes of this study both the upstream and downstream distributions were assumed to fit lognormal distribution mass and number profiles. The downstream DMS500-measured total number concentration (), geometric mean (
), and geometric standard deviation (
) were used within an iterative routine to determine a lognormal upstream distribution that when accounting for line losses results in a best fit (R2 > 0.9) to the downstream lognormal particle number and mass distributions characterized by the measured
,
, and
. DMS500 measurements on the SAMPLE III line were used in conjunction with the measured particle effective density provided by Johnson et al. Citation(2015) to infer mass distributions from particle number distributions. The line loss correction approach was used to determine the upstream to downstream particle number and mass ratio, as well as upstream mean geometric mobility diameter and mean geometric standard deviation. The particle number and mass line loss correction factors for the various thrust settings are shown in the online supplemental information (SI). All reported particle number and mass emission indices in the results section have been corrected for line losses.
2.2. Theoretical
Aggregate aerosols are characterized by numerous metrics, many of which originate from the fundamental characteristics measured by analysis techniques. Spherical particles are most readily characterized by their geometric diameter (), mass (
), volume (V), and the relation via density (ρ),
,
. For non-spherical particles, similar parameters are used to define effective metrics of diameter, mass, and volume. This study employs and tests the following analytical and semi-empirical constructs to facilitate comparison between the different measurements and infer particle metrics beyond those that are measured fundamentally by each device.
2.2.1. Mass and Mobility Metrics
Agglomerates of soot with fractal-like structures are characterized by a variety of metrics, often related to the method of measurement. The agglomerate mobility diameter, , as measured in a differential mobility analyzer, is related to aggregate mass by primary particle diameter,
, mass,
, and the mass-mobility exponent,
, by the relation
[1] where
is the mass-mobility prefactor with units of appropriate mass (Park et al. Citation2004). Soot agglomerates can also be defined by their effective density,
: the ratio of the agglomerate mass to equivalent volume based on the mobility diameter,
[2] where
(McMurry et al. Citation2002). The power-law relationship described by Equation (Equation2
[2] ) has been shown to fit well with experimental data using a constant prefactor
, despite the potential for varying primary particle size, for a variety of engines, including the engine studied here (Johnson et al. Citation2015). The number of primary particles within a soot aggregate is related to the overall aggregate mobility and the primary particle diameter,
, by the power law relation
[3] where
and
are the pre-exponential and power law exponent, respectively. Equation (Equation1
[1] ) can be related to Equation (Equation3
[2] ) where
and thus,
. For non-ideal aggregates, i.e., partially sintered, it is appropriate to define the primary particle diameter as a volume area equivalent primary particle diameter,
, and, thus
, where
and
are the aggregate volume and surface area, respectively. By taking the primary particle diameter and number of primary particles as their volume area equivalent,
and
, Equation (Equation3
[3] ) can be solved for volume-area primary particle diameter as a function of measured
and
,
[4]
Eggersdorfer et al. Citation(2012) have shown that Equation (Equation4[4] ) is valid with constant values of
= 0.998 and
= 1.069 for a polydisperse mix of primary particles regardless of the sintering mechanism or state of sintering. For particle sources where an empirical relationship has been determined between the particle mass and the particle mobility, such as described by the effective density relationship in Equation (Equation2
[2] ), the mass term in Equation (Equation4
[4] ) can be replaced with a function of mobility. By eliminating the mass term with an empirical effective density formulation, a power-law relationship between the volume average primary particle diameter and the mobility diameter can be derived as
[5] where
and
. By including empirical relations for particle mass within analytical fractal scaling laws, the physical significance of the pre-exponential constants is lost. As above, Equation (Equation5
[5] ) assumes a constant value of
that is independent of primary particle diameter, the validity of which is tested in the results section below. This relationship can be used to relate the surface area primary particle diameter with the mean mobility diameter for each mobility distribution.
A relation for the particle mass-specific surface area can be derived from the definition of volume area equivalent primary particle diameter,[6]
When particle measurements of both mass and mobility are available, Equation (Equation4[4] ) may be used to determine
, whereas Equation (Equation5
[5] ) may be used if an empirical relationship is known for the aggregate effective density.
Dobbins et al. Citation(1994) report a value of 1.86 g/cm3 for diesel and quote six other works, in the range of 1.82 to 2.05 g/cm3 that have a mean of 1.92 g/cm3. An elemental soot density of = 1.9 g/cm3 will be used for this study.
2.2.2. LII Primary Particle Size
As the LII 300 instrument does not allow significant particle sublimation, the dominant cooling mechanism for the particles is conduction to the surrounding gas, associated with the surface area of the particles, assuming monodisperse primary particles allow a direct relationship between the surface area and the primary particle diameter. During conduction cooling, the temperature difference between the particles, , and the ambient gas,
, decays steadily with a near-single exponential behavior. An equation of the form
[7] is fit to the temperature data (measured by the instrument with two-color pyrometry) to determine
, the time constant of the exponential decay, and where
is a constant (Snelling et al. Citation2002). This method requires a priori knowledge of the ambient gas temperature, which is determined by thermocouple in the sample cell. The primary particle diameter,
, is determined directly from the decay of the LII signal, using the relation derived from McCoy and Cha Citation(1974),
[8] where
is the thermal conductivity of the ambient gas,
is the thermal accommodation coefficient,
is a geometry-dependent heat transfer coefficient,
is the mean free path in the ambient gas, and
and
are the specific heat and material density of the particle, respectively.
The assumption of monodisperse primary particles maximizes the surface area to volume ratio; in reality, there is a distribution of primary particle diameters, and these primary particles are formed into aggregates, for which there is a distribution of aggregate sizes. Both of these effects have an impact in terms of interpreting the temperature decay rates, such that the reported primary particle diameter is an effective heat transfer primary particle diameter for an equivalent population of monodisperse primary particles (Liu et al. Citation2006).
3. RESULTS
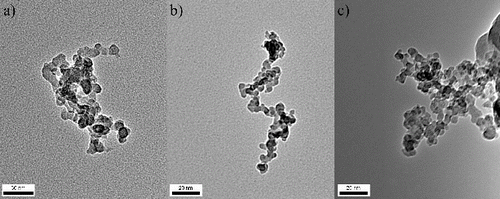
Engine emissions from the CFM56-5B4-2P were sampled on multiple days and different sample lines with varying sample-to-nitrogen dilution ratios, as depicted in . Mobility-selected samples were collected downstream of a long DMA and imaged in an HRTEM. shows representative images of a compact, (a), and linear, (b), 15-nm mobility diameter aggregate, as well as a 50-nm, (c), mobility diameter aggregate. In all cases the particles are seen to be composed of many (>30) primary particles. In several cases, such as , the presence of higher contrast particles was observed on the surface of the lighter contrast soot. EDX analysis of these samples showed the presence of metals, such as vanadium, silicon, and titanium, indicating a likelihood of ash within the particles. Quantitative EDX analysis across many particles was not conducted due to the lack of statistically significant quantities of mobility-selected particles.
FIG. 2. TEM images of 15 nm, (a) and (b), and 50 nm, (c), mobility-selected soot aggregates.
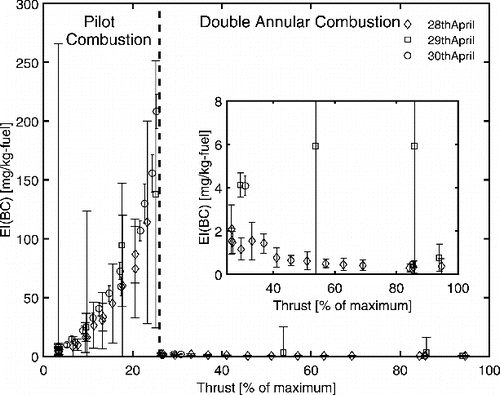
The LII measurements of mass concentration were conducted in parallel with CO2 measurements on respective sample lines. The mass concentrations were transformed into emission indices in accordance with SAE methodology (SAE Aerosopace Citation2009). Analysis of the emissions indices indicated that the variability (range of measured values) between instruments and lines was less than the measured variability within a given instrument at a specific test point (see Figure S1). Therefore, only data from the LII noted with an asterisk in is presented here for clarity and consistency.
As shown in , the mass emission index for the engine increases with increasing engine thrust setting while under pilot combustion. During low thrust settings only the single pilot combustor is fueled. The global stoichiometry is lean (measured global air to fuel ratio is shown in Figure S3), but the local stoichiometry within the pilot combustor is rich and only mixes with excess air downstream of the pilot combustion zone. The rich combustion ensures stability of the flame, but results in mass emission indices that are greater than at higher thrust conditions. At higher thrust settings where double annular combustion occurs, the mass emissions indices are less than 7 mg/kg-fuel (see inset) with a majority of emissions less than 2 mg/kg-fuel. The trend of mass emission index with engine thrust of the CFM56-5B4-2P is atypical when compared to conventional single-mode combustors, which tend to increase with increasing thrust setting (greater than 30%) and have EI(BC) in the range of 33 to 611 mg/kg-fuel for thrust settings greater than 45% of maximum thrust (Stettler et al. Citation2013). Thus, for thrust settings less than 15%, the measured mass emission indices of the CFM56-5B4-2P are typical of other engines (1–108 mg/kg-fuel). At intermediate thrust settings (15–25%) the CFM56-5B4-2P mass emission indices are greater than other engines (9–47 mg/kg-fuel), and at high thrust setting (>25%) are considerably lower than other measured engines.
FIG. 3. Black carbon mass emission index, EI(BC), for CFM56-5B4-2P as measured by LII on three separate lines for various thrust settings. Error bars represent the 90% variability interval within a given thrust setting.
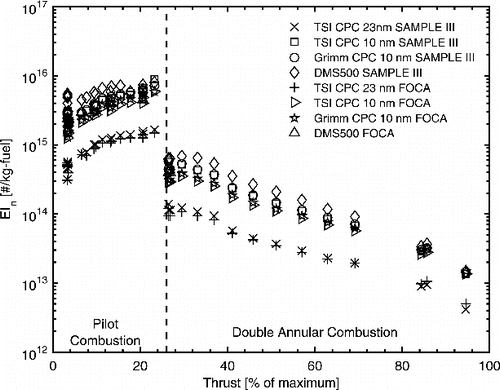
Particle number concentrations were measured on 28 April 2012 from both the SAMPLE III and FOCA lines. In , particle number-based emissions indices (EIn) calculated according to SAE methodology (SAE Aerosopace Citation2009) are shown as a function of engine thrust setting for the CFM56-5B4-2P engine. Measurements by the CPCs with D50 = 10 nm are in good agreement with the measurements from the DMS500s on both the SAMPLE III and FOCA sample lines. However, CPCs with D50 = 23 nm measure significantly lower particle number concentration, counting between 18 and 38% of the total particles counted by the D50 = 10 nm CPC from the same manufacturer (TSI), which indicates that a majority of particles are less than 23 nm. The variability in engine emissions at each test point is greater than the variability across different sample lines for the DMS500 and D50 = 10 nm CPCs. As with the mass-based emissions index, EIn increases with engine thrust setting during pilot combustion up to a maximum of 3 × 10¹⁶ particles/kg-fuel. After the engine transitions to use double annular combustion, EIn reduces by an order of magnitude and decreases with increasing thrust to a minimum of 3 × 10¹² particles/kg-fuel at the highest recorded thrust.
FIG. 4. Black carbon number emission index, EIn, for CFM56-5B4-2P as measured by CPCs with D50 cut points of 10 nm (open symbols) and 23 nm (cross and plus sign) on two separate lines (FOCA and SAMPLE III) for various thrust settings. The 90% variability was not significant and are omitted for legibility of symbols, but are shown in Figure S2.
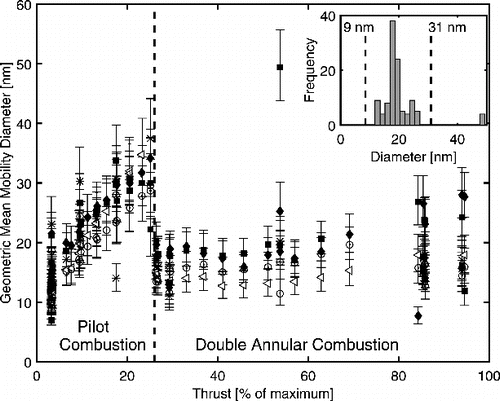
At each thrust setting mobility measurements were taken on different sample lines and by different instruments as shown in . The resulting measurements (over 105 separate mobility scans) were compiled and averaged over the entire test condition for each mobility instrument. The geometric mean mobility diameters were determined for each thrust setting, as shown in . The aggregate geometric mean mobility diameter from the CFM56-5B4-2P generally varied from 7 to 44 nm (two outliers excluded). The mobility diameter increased with increasing thrust within the single pilot combustion stage from 12 nm (90% variability interval, VI, 8–16 nm) at 4% maximum thrust to 33 nm (90% VI, 24–43 nm), coinciding with the higher mass concentrations shown in . Aggregate diameters for particles produced during double annular combustion had less variation in size throughout the entire range of thrusts with a mean particle diameter of 17 nm (90% VI, 8–26 nm, inset). The measurement of aggregate mobility diameter at the gantry without dilution (open circles) typically resulted in smaller measured aggregate diameters at thrusts with high emission indices (10–25% maximum thrust) when compared to the other thrust settings. The largest mobility measurements were typically recorded by the SMPS systems (closed square and triangle), which varied in their line placement. While not shown, the DMS500 measurements at times measured mobility distributions that appeared bimodal, whereas the SMPS measurements almost exclusively measured a single mode. As with the emission index measurements, the variability within a given thrust setting as measured by a given instrument was greater than the variability between instruments and lines at most settings. For higher thrust settings, where the variability was greatest among instruments, the low concentrations of measured particles resulted in higher variability in the measurements.
FIG. 5. Geometric mean diameter as measured by multiple mobility instruments over a range of engine thrusts. The measurements were taken from 28–30 April 2012 on lines as depicted in from different mobility instruments DMS500 (FOCA – asterisk, SAMPLE – triangle, Gantry – Circle), nanoSMPS (SAMPLE – diamond), and longSMPS (SAMPLE/FOCA – square). The inset shows the frequency distribution of the mean aggregate diameters for the DAC thrust settings. Error bars indicate the mean geometric standard deviation of the mobility distribution across all measurements within a given test condition.
As shown in Section 2.2, Equation (Equation4[4] ) relates the volume area equivalent primary particle diameter within an aggregate to the measured aggregate mass and mobility. Mean aggregate mobilities were measured for a range of different selected masses within a subset of engine thrusts as reported by Johnson et al. Citation(2015). The resulting data set (reproduced in Figure S4) allowed for determination of the primary particle size by analytical methods. The resulting volume area equivalent primary particle diameters are shown in as a function of aggregate mobility diameter for the denuded samples, where primary particle size is determined according to Equation (4). As shown, volume area equivalent primary particle diameter increases with aggregate mobility, whereby a power-law relationship of
encapsulates all but one of the measured data points. Fits to each individual thrust setting are shown in Figure S6. The value of the power law exponent,
= 0.8, can be compared to the result calculated using the effective density results reported by Johnson et al. Citation(2015),
= 2.76, which, when used with a constant
= 1.069, results in a power law exponent as defined in Equation (Equation5
[5] ) of
= 0.72. The discrepancy in the two
values is a result of the difference in least squares regression (Figure S7). The trend observed here is consistent with the correlation of primary particle size with aggregate size obtained from TEM analysis of different combustion sources; however the value of the power law exponent measured by this method is considerably larger than those reported by Dastanpour and Rogak Citation(2014).
FIG. 6. Volume area equivalent primary particle diameter as a function of aggregate mobility diameter as measured by mass and mobility analysis. The gray lines correspond to the empirical fit with the power law form of Equation (Equation5[5] ) (R2 = 0.86) and a ±25% interval.
![FIG. 6. Volume area equivalent primary particle diameter as a function of aggregate mobility diameter as measured by mass and mobility analysis. The gray lines correspond to the empirical fit with the power law form of Equation (Equation5[5] ) (R2 = 0.86) and a ±25% interval.](/cms/asset/fd2e9579-b6d3-400c-981b-91f6786e3159/uast_a_1078452_f0006_b.gif)
The volume area equivalent primary particle diameter, as measured by TEM and mass-mobility techniques, are plotted in as they relate to thrust setting, along with the LII effective heat transfer primary particle diameter. Primary particle diameters as measured by LII and mass-mobility vary from 6 to 19 nm, while TEM-measured primary particle diameters were considerably larger (18 to 47 nm). When corrected for oversampling of larger aggregates, the TEM-measured volume area equivalent primary particle diameters were in closer agreement (15 to 26 nm) with the range determined by mass-mobility relations. Primary particle diameters within the pilot combustion stage demonstrate a noticeable change with thrust setting, whereas the primary particle diameters produced during double annular combustion show no noticeable trend with thrust setting. The LII-measured primary particle diameter decreases from 19 to 10 nm with increasing thrust setting from 0 to 26% full thrust, whereas the mass-mobility and corrected TEM primary particle diameters increased over the same thrust range. As shown in , the aggregate diameter increases with increasing thrust setting within the pilot combustion stage, indicating that the average primary particle diameter also likely increases over that range. As the aggregate mobility diameters increase, the effective density decreases while mass increases (Figures S4 and S7), which affects the radiative and convective heat removal from the aggregate surface after heating within the LII beam. The influence of effective density is not accounted for within the current LII primary particle calculation, but it is known that primary particle measurement from the LII signal decay is in better agreement within larger, less dense aggregates (Schulz et al. Citation2006). The impact of effective density is hypothesized to dominate measurements of primary particle size for compact aggregates and may account for the discrepancy in LII measurements. Further work is needed to accurately account for effective density effects on LII-determined primary particle diameter. Estimates of error within these measurements and derived quantities are provided within the SI, where it is shown that the TEM measured diameter is ±2 nm and derived has an uncertainty of ±26.6% based on the current theoretical formulation. Current error estimates for the measured LII
are not available, and is an active area of research.
FIG. 7. Primary particle diameter as determined by TEM, which reports number mean dPP and dva; mass and mobility measurements, which report number mean; and LII, which represents an effective heat transfer primary particle diameter.
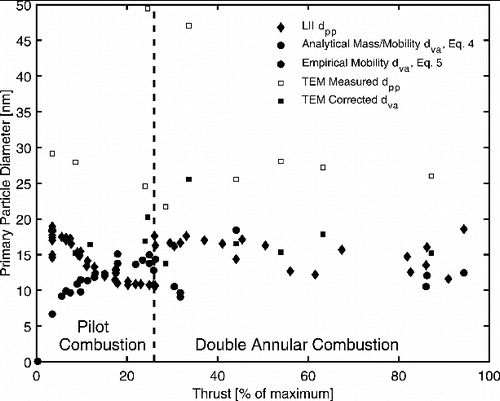
The observed increase in corrected TEM-measured volume area equivalent primary particle diameter from 15 to 21 nm over the pilot combustion stage and primary particle diameters typically below 18 nm during double annular combustion corroborate trends previously observed between primary particle diameter and combustion temperature for conventional combustors (Vander Wal et al. Citation1999; Liati et al. Citation2014). Lean combustion and lower temperatures during double annular combustion are the likely causes of the observed reduction in BC mass and number emissions and smaller primary particle diameters compared to conventional combustors.
LII gives a measure of mass specific surface area that is active for heat transfer. The heat transfer specific surface area can be compared to the total surface area calculated from mass and mobility relations as given by Equations (Equation5[5] ) and (Equation6
[6] ). The aggregate specific surface area is plotted as a function of engine thrust in , where the LII-measured specific surface area is seen to vary from 552 to 1339 m2/g. The mass-mobility determined specific surface area varied over a smaller range from 240 to 347 m2/g. Both LII measurements and mass-mobility determined specific surface areas remained relatively constant in pilot combustion mode while above the 5% full thrust setting. During double annular combustion the LII specific surface areas showed an increase with thrust setting that was more pronounced than the mass-mobility determined surface area. Previously reported soot specific surface area are in better agreement with the mass-mobility determined specific surface area, where Ishiguro et al. Citation(1997) measured specific surface areas of 52 to 296 m2/g where higher surface areas corresponded to more oxidized samples. Popovitcheva et al. Citation(2000) report an aggregate specific surface area for aircraft soot of 47 to 100 m2/g as measured by N2 thermodesorption spectroscopy. Given the high value of LII-measured specific surface area when compared with previous measurements, it is likely that the results are influenced by other factors, such as effective density, as discussed previously.
![FIG. 8. Aggregate specific surface area as determined by LII, and analytical (Equation (Equation4[4] )) and empirical (Equation (Equation5[5] )) mass and mobility relationships as defined in Equation (Equation6[6] ).](/cms/asset/ddd24b29-aea0-48fd-b1d2-90c4eaa2adf3/uast_a_1078452_f0008_b.gif)
4. SUMMARY AND CONCLUSION
The BC emissions from a gas turbine with a double annular combustor, CFM56-5B4-2P, were measured as a part of the SAMPLE III.2 campaign. TEM images indicated that the soot consisted of aggregates composed of many (>30) primary particles for aggregate mobility diameters as low as 15 nm. Mass-based emission indices demonstrate a unique trend from single-stage combustion engines, whereby the EI(BC) increases rapidly with thrust setting during pilot only combustion reaching a maximum of 80 to 208 mg/kg-fuel at 20–25% of maximum trust. At higher thrust settings where double annular combustion occurs, the mass emissions indices are significantly less than single-stage combustors, with measured EI(BC) less than 8 mg/kg-fuel. Particle number emissions, EIn, increase with engine thrust setting during pilot combustion up to a maximum of ˜1016 particles/kg-fuel. During double annular combustion EIn reduces by an order of magnitude and decreases with increasing thrust setting to a minimum of ˜1013 particles/kg-fuel at the highest recorded thrust setting.
The aggregate geometric mean mobility diameter corresponds to other modern gas engines with diameters ranging from 7 to 44 nm. As with the emissions indices, there was a positive correlation for mobility diameter with increasing thrust within the single pilot combustion stage resulting in diameters ranging from 12 nm to 33 nm. Thrust setting had less impact on the aggregate mobility diameters produced during double annular combustion where mean particle diameters were 17 nm (90% VI, 8–26 nm). Concurrent aggregate mass and mobility measurements also allowed for calculation of aggregate volume average primary particle diameters, which were seen to increase with mobility diameter according to the empirical power-law relationship . Assuming this relationship holds for this engine at all thrust settings, the primary particle diameters as determined by LII, TEM, and mass-mobility relations were compared. The primary particle results show conflicting trends, particularly between the LII and mass-mobility determined primary particle diameters. It is hypothesized that the effective density may play a role in the effective heat transfer surface area from aggregates, which will serve to bias LII results of larger aggregates. Further work is needed for accurate measurement of primary particle diameters. Measures of aggregate mass specific surface area were compared between LII and mass-mobility calculated values. While neither method is a recognized standard for determining surface area, the mass-mobility relations were closer to measures in other studies. Further work is needed to refine and validate LII-determined surface area and primary particle diameter.
UAST_1078452_Supplemental_File.zip
Download Zip (2 MB)ACKNOWLEDGMENTS
The authors express their gratitude to a number of people and organizations in helping to plan, conduct, finance, and provide instruments for this measurement campaign. We also thank the SR Technics test bed staff, including Frithjof Siegerist, for operating the engines and enabling access to the test facility. We thank AVL, Cambustion, Grimm, and TSI supplying both instruments and expertise.
FUNDING
The European Aviation Safety Agency (EASA) funded the SAMPLE III SC02 campaign (EASA.2010.FC.10, Specific Contract No: SC02). The Federal Office of Civil Aviation, Switzerland (FOCA), was critical in providing additional financial support and arranging facilities that made this study possible.
SUPPLEMENTAL MATERIAL
Supplemental data for this article can be accessed on the publisher's website.
REFERENCES
- Bakand, S., Hayes, A., and Dechsakulthorn, F. (2012). Nanoparticles: A Review of Particle Toxicology Following Inhalation Exposure. Inhal. Toxicol., 24:125–135.
- Biskos, G., Reavell, K., and Collings, N. (2005). Unipolar Diffusion Charging of Aerosol Particles in the Transition Regime. J. Aerosol Sci., 36:247–265.
- Bond, T. C., Doherty, S. J., Fahey, D. W., Forster, P. M., Berntsen, T., DeAngelo, B. J., et al. Flanner, M. G., Ghan, S., Kärcher, B., Koch, D., Kinne, S., Kondo, Y., Quinn, P. K., Sarofim, M. C., Schultz, M. G., Schulz, M., Venkataraman, C., Zhang, H., Zhang, S., Bellouin, N., Guttikunda, S. K., Hopke, P. K., Jacobson, M. Z., Kaiser, J. W., Klimont, Z., Lohmann, U., Schwarz, J. P., Shindell, D., Storelvmo, T., Warren, S. G., and Zender, C. S. (2013). Bounding the Role of Black Carbon in the Climate System: A Scientific Assessment. J. Geophys. Res., 118:5380–5552.
- Broday, D. M., and Rosenzweig, R. (2011). Deposition of Fractal-Like Soot Aggregates in the Human Respiratory Tract. J. Aerosol Sci., 42:372–386.
- Cassee, F. R., Héroux, M.-E., Gerlofs-Nijland, M. E., and Kelly, F. J. (2013). Particulate Matter Beyond Mass: Recent Health Evidence on the Role of Fractions, Chemical Constituents and Sources of Emission. Inhal. Toxicol., 25:802–812.
- Crayford, A., Johnson, M., Marsh, R., Sevcenco, Y., Walters, D., Williams, P., Petzold, A., Bowen, P., Wang, J., and Lister, D., (2012). SAMPLE III: Contribution to Aircraft Engine PM Certification Requirement and Standard Second Specific Contract– Final Report. European Aviation Safety Agency, Cologne, Germany. easa.europa.eu.
- Cumpsty, N. A. (2003). Jet Propulsion: A Simple Guide to the Aerodynamic and Thermodynamic Design and Performance of Jet Engines. Cambridge University Press, Cambridge, UK.
- Dastanpour, R., and Rogak, S. N. (2014). Observations of a Correlation between Primary Particle and Aggregate Size for Soot Particles. Aerosol Sci. Technol., 48:1043–1049.
- DeCarlo, P. F., Slowik, J. G., Worsnop, D. R., Davidovits, P., and Jimenez, J. L. (2004). Particle Morphology and Density Characterization by Combined Mobility and Aerodynamic Diameter Measurements. Part 1: Theory. Aerosol Sci. Technol., 38:1185–1205.
- Dobbins, R. A., Mulholland, G. W., and Bryner, N. P. (1994). Comparison of a Fractal Smoke Optics Model with Light Extinction Measurements. Atmos. Environ., 28:888–897.
- Durdina, L., Brem, B. T., Abegglen, M., Lobo, P., Rindlisbacher, T., Thomson, K., Smallwood, G. J., Hagen, D. E., Sierau, B., Wang, J. (2014). Determination of PM Mass Emissions from an Aircraft Turbine Engine Using Particle Effective Density. Atmos. Environ., 99:500–507.
- EASA. (2012). ICAO Engine Emissions Databank [online]. Available from http://easa.europa.eu/environment/edb/aircraft-engine-emissions.php.
- Eggersdorfer, M. L., Kadau, D., Herrmann, H. J., and Pratsinis, S. E. (2012). Aggregate Morphology Evolution by Sintering: Number and Diameter of Primary Particles. J. Aerosol Sci., 46:7–19.
- Fierz, M., Kaegi, R., and Burtscher, H. (2007). Theoretical and Experimental Evaluation of a Portable Electrostatic TEM Sampler. Aerosol Sci. Technol., 41:520–528.
- Giechaskiel, B., Chirico, R., DeCarlo, P., Clairotte, M., Adam, T., Martini, G., Heringa, M., Richter, R., Prevot, A., and Baltensperger, U. (2010). Evaluation of the Particle Measurement Programme (PMP) Protocol to Remove the Vehicles' Exhaust Aerosol Volatile Phase. Sci. Total Environ., 408:5106–5116.
- Giechaskiel, B., Dilara, P., Sandbach, E., and Andersson, J. (2008). Particle Measurement Programme (PMP) Light-Duty Inter-Laboratory Exercise: Comparison of Different Particle Number Measurement Systems. Measur. Sci. Technol., 19:095401.
- Hall, R., Smooke, M., and Colket, M. (1997). Predictions of Soot Dynamics in Opposed Jet Diffusion Flames, in Physical and Chemical Aspects of Combustion: A Tribute to Irvin Glassman, F. Dryer, and R. Sawyer, eds., Gordon and Breach, Amsterdam, pp. 189–230.
- Ishiguro, T., Takatori, Y., and Akihama, K. (1997). Microstructure of Diesel Soot Particles Probed by Electron Microscopy: First Observation of Inner Core and Outer Shell. Combust. Flame, 108:231–234.
- Jayne, J. T., Leard, D. C., Zhang, X., Davidovits, P., Smith, K. A., Kolb, C. E., and Worsnop, D. R. (2000). Development of an Aerosol Mass Spectrometer for Size and Composition Analysis of Submicron Particles. Aerosol Sci. Technol., 33:49–70.
- Johnson, T. J., Olfert, J. S., Symonds, J. P. R., Johnson, M., Rindlisbacher, T., Swanson, J. J., Boies, A. M., Thomson, K., Smallwood, G., Walters, D., Sevcenco, Y., Crayford, A., Dastanpour, R., Rogak, S. N., Durdina, L., Bahk, Y. K., Brem, B., and Wang, J. (2015). Effective Density and Mass-Mobility Exponent of Aircraft Turbine Particulate Matter. J. Propuls. Power, 31:573–582.
- Just, B. G. (2012). Characterization of Ultrafine Particulate Matter from Traditional and Improved Biomass Cookstoves, Mechanical Engineering. University of British Columbia, Vancouver, BC. https://circle.ubc.ca/handle/2429/43053.
- Kärcher, B., and Yu, F. (2009). Role of Aircraft Soot Emissions in Contrail Formation. Geophys. Res. Lett., 36:L01804.
- Khalek, I. A., and Kittelson, D. B. (1995). Real Time Measurement of Volatile and Solid Exhaust Particles Using a Catalytic Stripper. SAE Technical Paper. 950236. SAE International, Warrendale, PA.
- Kinsey, J. S., Dong, Y., Williams, D. C., and Logan, R. (2010). Physical Characterization of the Fine Particle Emissions from Commercial Aircraft Engines during the Aircraft Particle Emissions Experiment (APEX) 1–3. Atmos. Environ., 44:2147–2156.
- Lee, D. S., Pitari, G., Grewe, V., Gierens, K., Penner, J. E., Petzold, A., Prather, M. J., Schumann, U., Bais, A., and Berntsen, T. (2010). Transport Impacts on Atmosphere and Climate: Aviation. Atmos. Environ., 44:4678–4734.
- Lefebvre, A., and Ballal, D. (2010). Gas Turbine Combustion: Alternative Fuels and Emission, 3rd ed. CRC Press, Boca Raton, FL.
- Liati, A., Brem, B. T., Durdina, L., Vögtli, M., Arroyo Rojas Dasilva, Y., Dimopoulos Eggenschwiler, P., and Wang, J. (2014). Electron Microscopic Study of Soot Particulate Matter Emissions from Aircraft Turbine Engines. Environ. Sci. Technol., 48:10975–10983.
- Liscinsky, D. S., Bhargava, A., Colket, M. B., Hautman, D. C., Hollick, H. H., and True, B. (2010). Effect of Particle Sampling Technique and Transport on Particle Penetration at the High Temperature and Pressure Conditions Found in Gas Turbine Combustors and Engines. NASA/CR-2010eNNC07CB03C. NASA/Glenn Research Center, Cleveland, OH.
- Liu, F., Yang, M., Hill, F. A., Snelling, D. R., and Smallwood, G. J. (2006). Influence of Polydisperse Distributions of Both Primary Particle and Aggregate Size on Soot Temperature in Low-Fluence LII. Appl. Phys. B, 83:383–395.
- Lobo, P., Hagen, D. E., Whitefield, P. D., and Raper, D. (2015). PM Emissions Measurements of in-Service Commercial Aircraft Engines during the Delta-Atlanta Hartsfield Study. Atmos. Environ., 104:237–245.
- Lobo, P., Whitefield, P. D., Hagen, D. E., Trueblood, M. B., Mundis, N. L., Magdits, I. P., Herndon, S. C., Onasch, T. B., Jayne, J. T., Miake-lye, R. C., Eberhard, W. L., and Wayson, R. (2008). Delta - Atlanta Hartsfield (UNA-UNA) Study. Partnership for AiR Transportation Noise and Emissions Reduction (PARTNER), Cambridge, MA. http://web.mit.edu/aeroastro/partner/reports/proj9/proj9-deltaatlantaharts-rpt.pdf.
- McCoy, B., and Cha, C. (1974). Transport Phenomena in the Rarefied Gas Transition Regime. Chem. Eng. Sci., 29:381–388.
- McMurry, P. H., Wang, X., Park, K., and Ehara, K. (2002). The Relationship between Mass and Mobility for Atmospheric Particles: A New Technique for Measuring Particle Density. Aerosol Sci. Technol., 36:227–238.
- Olfert, J., and Collings, N. (2005). New Method for Particle Mass Classification—The Couette Centrifugal Particle Mass Analyzer. J. Aerosol Sci., 36:1338–1352.
- Onasch, T., Trimborn, A., Fortner, E., Jayne, J., Kok, G., Williams, L., Davidovits, P., and Worsnop, D. (2012). Soot Particle Aerosol Mass Spectrometer: Development, Validation, and Initial Application. Aerosol Sci. Technol., 46:804–817.
- Park, K., Kittelson, D. B., Zachariah, M. R., and McMurry, P. H. (2004). Measurement of Inherent Material Density of Nanoparticle Agglomerates. J. Nanopart. Res., 6:267–272.
- Petzold, A., Marsh, R., Johnson, M., Miller, M., Sevcenco, Y., Delhaye, D., Ibrahim, A., Williams, P., Bauer, H., Crayford, A., Bachalo, W. D., and Raper, D. (2011). Evaluation of Methods for Measuring Particulate Matter Emissions from Gas Turbines. Environ. Sci. Technol., 45:3562–3568.
- Petzold, A., Ogren, J. A., Fiebig, M., Laj, P., Li, S.-M., Baltensperger, U., Holzer-Popp, T., Kinne, S., Pappalardo, G., Sugimoto, N., Wehrli, C., Wiedensohler, A., and Zhang, X.-Y. (2013). Recommendations for Reporting “Black Carbon” Measurements. Atmos. Chem. Phys., 13:8365–8379.
- Popovitcheva, O., Persiantseva, N., Trukhin, M., Rulev, G., Shonija, N., Buriko, Y. Y., Starik, A., Demirdjian, B., Ferry, D., and Suzanne, J. (2000). Experimental Characterization of Aircraft Combustor Soot: Microstructure, Surface Area, Porosity and Water Adsorption. Phys. Chem. Chem. Phys., 2:4421–4426.
- Radney, J. G., You, R., Ma, X., Conny, J. M., Zachariah, M. R., Hodges, J. T., and Zangmeister, C. D. (2014). Dependence of Soot Optical Properties on Particle Morphology: Measurements and Model Comparisons. Environ. Sci. Technol., 48:3169–3176.
- Reavell, K., Hands, T., and Collings, N. (2002). A Fast Response Particulate Spectrometer for Combustion Aerosols. SAE Technical Paper. SAE International, Warrendale, PA.
- SAE Aerosopace. (2009). Aircraft Exhaust Nonvolatile Particle Matter Measurement Method Development. SAE International, Warrendale, PA. http://www.sae.org.
- Schulz, C., Kock, B. F., Hofmann, M., Michelsen, H., Will, S., Bougie, B., Suntz, R., and Smallwood, G. (2006). Laser-Induced Incandescence: Recent Trends and Current Questions. Appl. Phys. B, 83:333–354.
- Schumann, U., Arnold, F., Busen, R., Curtius, J., Karcher, B., Kiendler, A., Petzold, A., Schlager, H., Schröder, F., and Wohlfrom, H. (2002). Influence of Fuel Sulfur on the Composition of Aircraft Exhaust Plumes: The Experiments SULFUR 1–7. Geophys. Res. Lett., 40:2867–2872.
- Schumann, U., Jeßberger, P., and Voigt, C. (2013). Contrail Ice Particles in Aircraft Wakes and Their Climatic Importance. Geophys. Res. Lett., 40:2867–2872.
- Snelling, D. R., Smallwood, G. J., Liu, F., Gülder, Ö. L., and Bachalo, W. D. (2005). A Calibration-Independent Laser-Induced Incandescence Technique for Soot Measurement by Detecting Absolute Light Intensity. Appl. opt., 44:6773–6785.
- Snelling, D. R., Smallwood, G. J., Sawchuk, R. A., Neill, W. S., Gareau, D., Clavel, D. J., Chippior, W. L., Liu, F., Gülder, Ö. L., and Bachalo, W. D., (2002). In-Situ Real-Time Characterization of Particulate Emissions from a Diesel Engine Exhaust by Laser-Induced Incandescence. SAE Technical Paper. SAE International, Warrendale, PA.
- Stettler, M. E. J., Boies, A. M., Petzold, A., and Barrett, S. R. H. (2013). Global Civil Aviation Black Carbon Emissions. Environ. Sci. Technol., 47:10397–10404.
- Stickles, R., and Barrett, J. (2013). TAPS II Combustor Final Report. CLEEN Program. General Electric, Washington, DC.
- Swanson, J., and Kittelson, D. (2010). Evaluation of Thermal Denuder and Catalytic Stripper Methods for Solid Particle Measurements. J. Aerosol Sci., 41:1113–1122.
- Timko, M. T., Onasch, T. B., Northway, M. J., Jayne, J. T., Canagaratna, M. R., Herndon, S. C., Wood, E. C., Miake-Lye, R. C., and Knighton, W. B. (2010). Gas Turbine Engine Emissions—Part II: Chemical Properties of Particulate Matter. J. Eng. Gas Turbines Power., 132:061505–061515.
- Vander Wal, R. L., Bryg, V. M., and Huang, C.-H. (2014). Aircraft Engine Particulate Matter: Macro- Micro- and Nanostructure by HRTEM and Chemistry by XPS. Combust. Flame, 162:602–611.
- Vander Wal, R. L., Ticich, T. M., and West, J. R. (1999). Laser-Induced Incandescence Applied to Metal Nanostructures. Appl. Opt., 38:5867–5879.
- Wang, S. C., and Flagan, R. C. (1990). Scanning Electrical Mobility Spectrometer. Aerosol Sci. Technol., 13:230–240.
- Wen, Z., Yun, S., Thomson, M., and Lightstone, M. (2003). Modeling Soot Formation in Turbulent Kerosene/Air Jet Diffusion Flames. Combust. Flame, 135:323–340.
- Westerdhal, D., Fruin, S., Fine, P., and Sioutas, C. (2008). The Los Angeles International Airport as a Source of Ultrafine Particles and Other Pollutants to Nearby Communities. Atmos. Environ., 42:3143–3155.
- Wey, C., Anderson, B., Hudgins, C., Wey, C., Li-Jones, X., Winstead, E., Thornhill, L. K., Lobo, P., Hagen, D., and Whitefield, P. (2006). Aircraft Particle Emissions Experiment (APEX). ARL-TR-3903. NASA Center for Aerospace Information, Hanover, MD.
- Yon, J., Liu, F., Bescond, A., Caumont-Prim, C., Rozé, C., Ouf, F.-X., and Coppalle, A. (2014). Effects of Multiple Scattering on Radiative Properties of Soot Fractal Aggregates. J. Quant. Spectrosc. Radiat. Transf., 133:374–381.
- Zhang, R., Khalizov, A. F., Pagels, J., Zhang, D., Xue, H., and McMurry, P. H. (2008). Variability in Morphology, Hygroscopicity, and Optical Properties of Soot Aerosols during Atmospheric Processing. Proc. Natl. Acad. Sci., 105:10291–10296.
- Zhu, Y., Fanning, E., Yu, R. C., Zhang, Q., and Froines, J. R. (2011). Aircraft Emissions and Local Air Quality Impacts from Takeoff Activities at a Large International Airport. Atmos. Environ., 45:6526–6533.