
 ?Mathematical formulae have been encoded as MathML and are displayed in this HTML version using MathJax in order to improve their display. Uncheck the box to turn MathJax off. This feature requires Javascript. Click on a formula to zoom.
Abstract
A first-of-its-kind aerosol exposure device for toxicity testing, referred to as the Dosimetric Aerosol in Vitro Inhalation Device (DAVID), was evaluated for its ability to deliver airborne nanoparticles to lung cells grown as air–liquid interface (ALI) cultures. For inhalation studies, ALI lung cell cultures exposed to airborne nanoparticles have more relevancy than the same cells exposed in submerged culture because ALI culture better represents the respiratory physiology and consequently more closely reflect cellular response to aerosol exposure. In DAVID, water condensation grows particles as small as 5 nm to droplets sized >5 µm for inertial deposition at low flow rates. The application of DAVID for nanotoxicity analysis was evaluated by measuring the amount and variability in the deposition of uranine nanoparticles and then assessing the viability of ALI cell cultures exposed to clean-air under the same operational conditions. The results showed a low coefficient of variation, <0.25, at most conditions, and low variability in deposition between the exposure wells, trials, and operational flow rates. At an operational flow rate of 4 LPM (liter per minute), no significant changes in cell viability were observed, and minimal effects observed at 6 LPM. The reliable and gentle deposition mechanism of DAVID makes it advantageous for nanoparticle exposure.
Copyright © 2019 American Association for Aerosol Research
Introduction
The air we breathe can contain high numbers of ultrafine particles (UFPs, particle diameter <100 nm) that are emitted from a variety of sources, including fuel combustion (vehicle tailpipes, coal burning, heating, etc.), welding, cooking, etc. (Biswas and Wu Citation2005). Exposure to airborne UFPs has been associated with adverse health outcomes including asthma, cardiovascular disease, chronic obstructive pulmonary disease (COPD), and neurological effects (Oberdörster Citation2001; Peters Citation2005). Some of the properties associated with UFPs that are often linked to these health outcomes include: toxicity, size, chemical composition, and surface area (Donaldson et al. Citation2005; Kennedy Citation2007). Inhalation is considered the initial and primary route for human exposure to UFPs (Li et al. Citation2010; Teeguarden et al. Citation2011). As a result of their small size, UFP can remain airborne for extended periods of time, thus prolonging the chances for inhalation exposure and the development of chronic diseases (Schwarze et al. Citation2006). Once inhaled, they travel deep into the lungs and reach the alveoli, at which point they can translocate to various organs in the body, posing a potential threat to the human physiology (Buzea et al. Citation2007; Stone et al. Citation2017). Furthermore, UFPs may be readily transported throughout the human body via the circulatory system due to their size being 20–10,000 times smaller than the diameter of various alveolar capillaries (Gentile and Decuzzi Citation2010).
UFPs are also known as nanoparticles (NPs), though they are often differentiated in literature based on their source of particle exposure. Although there are natural sources of NPs, the term often refers to engineered nanomaterials, which is a class of materials on the scale of 1–100 nm designed for specific applications. UFPs predate this terminology and have been historically used to describe particles on the same size scale that are incidentally released from natural and anthropogenic sources (Stone et al. Citation2017). Nonetheless, the unique properties shared by NPs and UFPs compared to their bulk material have made their toxicity assessment by conventional methods difficult and less differentiable, thus calling for the development of new tools to overcome these barriers.
Toxicity studies exposing in vitro cell cultures to NPs under submerged conditions have become popular due to their simplicity and the necessity for an approach to quickly assess new materials; however, such an approach does not represent how cells are exposed to aerosols in human lungs (Huh et al. Citation2010; Pezzulo et al. Citation2011). In addition, interactions that occur between the submerged cell culture medium and the deposited NPs may change the particle properties and consequently alter the toxicological outcomes (Lichtveld et al. Citation2012). Advanced in vitro methods have been developed to incorporate and expose cells to NP aerosols at the air–liquid interface (ALI) to more closely represent the human exposure anatomy, and are increasing in the use for toxicological studies (Rach et al. Citation2014). Using these cell systems, often referred to as aerosol exposure chambers, allows for particles to be delivered directly to the ALI of the cells for toxicity assessment. Furthermore, culturing the cells at the ALI has been shown to promote differentiation and better represent how cells exist in vivo to provide a superior cell-system for evaluating the biological responses of cells exposed to NPs (Gray et al. Citation1996). This notion has been demonstrated in recent studies that report ALI cell cultures are a more sensitive model than the traditional exposure methodology (aqueous particle dispersion) with respect to the assessment of toxicity resulting from inhalation (Lenz et al. Citation2009; Zavala et al. Citation2014; Stone et al. Citation2017). However, delivering NPs directly onto the surface of ALI cell cultures is challenging. The deposition of airborne NPs with an adequate number and mass to observe cellular responses is difficult to achieve in a timely manner without an external force due to the transport properties of aerosols. To increase deposition efficiency of NPs to ALI cultures, several approaches have been developed (many of which are commercially available), including electrostatic precipitation (ESP), thermophoresis, and cloud settling-based technologies (Lenz et al. Citation2009; Broßell et al. Citation2013; Jeannet et al. Citation2015). However, these mechanisms of particle deposition have several limitations: (i) ESP with corona alters the surface charge of particles, (ii) chemical changes may occur at the particle surface when sample temperature changes rapidly (thermophoresis), (iii) portability issues or the need to transfer the particles into solution before exposure may prevent the use of such a system in the field (e.g., cloud settling), (iv) many mechanisms that are not representative of exposure conditions (i.e., humidity/temperature) in the human body, and (v) the mechanism for enhanced particle deposition may cause adverse cellular effects (e.g., high flow velocity).
Despite these developments, the portability and use of these devices in the field have yet to be realized, and direct exposure of cell culture to aerosols requires the preconditioning of the temperature, humidity, and electrical charge of the incoming aerosol (Zavala et al. Citation2017). There is concern whether charging or heating of the aerosol by the ESP or thermophoresis methods adversely affects cells; however, compared to low deposition efficiency from exposure without an external force, the need to deposit a dose of NPs capable of stimulating the lowest observable effect level outweighs the current toxicity incurred (de Bruijne et al. Citation2009). Still, achieving high deposition efficiency with cell damage caused by the system may lead to incorrect conclusions in the toxicity assessment of new materials. Moreover, ESP does not mimic particle deposition in the human respiratory system, and a portable system that can expose cells in a physiologically relevant manner to NPs from the environment with high physical and biological efficiency without causing cytotoxicity is needed for environmental and occupational toxicity analysis.
Condensational particle growth (CPG) was first used for particle counting due to its ability to amplify particle size for detection without a microscope (McMurry Citation2000). Using water-based CPG, we have demonstrated a superior method over existing technologies to collect viable nanosized viruses from bioaerosols both in the laboratory and in the field (Lednicky et al. Citation2016; Pan et al. Citation2016). Herein, we propose CPG as a feasible technology for cellular exposure to NPs since the process utilizes a high relative humidity (RH) and moderate temperatures (the sample flow is never heated above 45 °C). Furthermore, CPG has been demonstrated to occur in the human respiratory system, leading to enhanced deposition (Longest and Xi Citation2008). Under supersaturated conditions, inhaled particles grow to droplets in the respiratory tract by the condensation of water vapor from the mucosa onto their surface, and subsequently alter their deposition as a function of particle size (Tu and Knutson Citation1984). Exploiting the CPG mechanism to enhance particle deposition for toxicity assessment will increase the relevancy of the results for human exposure and also provide a faster method to stimulate a biologic effect.
The objective of this study was to demonstrate CPG as a beneficial method for efficient deposition of airborne NPs onto cells cultured at the ALI, with control over the temperature and humidity (>95% RH), and without generating cellular stress from confounding exposure and sampling associated factors. Controlled deposition of NPs to the ALI of cells provides more meaningful in vitro toxicity analysis that can be used in risk assessment through accurate relation of the biologic effects to the delivered dose. In this study, a new aerosol exposure chamber, known as the Dosimetric Aerosol in Vitro Inhalation Device (DAVID), was tested and optimized to controllably deposit NPs at the ALI of cell culture without causing toxicity due to the particle delivery method. The deposition efficiency of particles in DAVID has been shown to be greater than 90% for particles from 5 nm to 10 µm in previously published supplemental information (Lednicky et al. Citation2016). The high efficiency for depositing NPs at the ALI in DAVID reduces the necessary time for exposure from hours, as reported previously for commercial devices, to minutes, which can reduce exposure related cellular stress.
DAVID design development
Fundamentals of DAVID
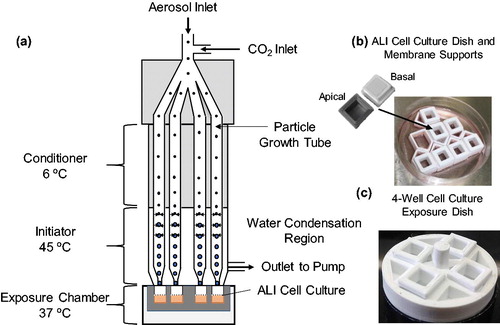
Particle deposition in DAVID occurs by inertial impaction enhanced by laminar-flow CPG wherein the size of airborne particles is increased from nanometers to micrometers through encapsulation in water droplets (Hering and Stolzenburg Citation2005). The increase in size of the particles is achieved by cooling the incoming aerosol, forming nucleation sites, and initiating the condensation of water in a vaporous region, leading to the efficient growth of the particles to droplets and their gentle deposition onto the cell surface at low flow velocities by inertial impaction. The unit is portable, weighs less than 8 kg, with dimensions 0.61 m × 0.41 m × 0.25 m. With 32 impaction jets (four jets per growth tube, eight growth tubes total), it has the capacity to sample and deposit aerosolized particles onto the surface of ALI cell cultures at flow rates up to 8 LPM (liter per minute). Each growth tube is comprised of a proprietary hydrophilic polymer wick (4029003 Replacement wicks, TSI Inc., Shoreview, MN, USA) with inner and outer diameter of 0.148 mm and 0.197 mm, respectively. Water is added to the base of the wicks and they are wetted by capillary action. A simplified schematic of DAVID portraying only four growth tubes is shown in . DAVID consists of three stages: (a) a conditioner, which cools the inlet aerosol stream to 6 °C, (b) an initiator, which heats the water-soaked wicks up to 45 °C to provide saturated moisture for the condensation of water vapor onto the cooled particles, and (c) a cell exposure chamber, where the ALI cell culture is maintained at 37 °C. The custom cell membrane supports and dishes for cell culture at the ALI are shown in . When cells are exposed to aerosols in DAVID, an exposure dish is necessary to interface with DAVID, as shown in . All cell culture platforms were 3D printed (Play, PrintrBot, Lincoln, CA, USA) from polylactic acid filament (1.75 mm white, MakeShaper, Sanford, NC, USA) to interface with the 32 nozzles. Four cell cultures can be exposed simultaneously to aerosols in DAVID for replicate analysis.
Figure 1. (a) Schematic of condensational particle growth in DAVID. Four growth tubes each with one jet are shown in the schematic for simplicity, though there are eight tubes with four jets each. (b) Custom ALI cell culture, and (c) exposure dishes to interface in DAVID.
Development of cell culture platform for integration in DAVID
The benefits of using DAVID to conduct exposure analysis of cultured cells to aerosolized particles are numerous, and include: (a) efficient and reproducible exposure of multiple cell cultures to the same aerosol in a short time, (b) maintenance of cultured lung cells under conditions relevant to the human respiratory system, at 37 °C and with RH greater than 95% during the exposure, and (c) the technology and instrument settings (i.e., low flow velocity, high RH) resulting in no cell stress to avoid toxicological responses unrelated to the test aerosol. Custom cell culture and exposure platforms were designed and 3D printed for this study because appropriate commercially available cell culture inserts did not fit inside the exposure chamber to properly interface with the exposure nozzles.
Multiple design parameters were considered for the exposure of cells in DAVID. The ability to simultaneously expose at least four ALI cell cultures for replicate analysis of the toxicological outcomes was the first consideration. Furthermore, rapid optimization of the cell culture seeding density and adaptation of culture protocols were achieved by designing custom membranes with culturable surface areas of 0.36 cm2, similar to standard 96-well plates, and Corning 6.5 mm Transwells of 0.32 cm2 and 0.33 cm2, respectively. In addition, the culture dishes were designed to have 300 µL of media on the basal side and 100 µL on the apical side of the membranes to provide sufficient nutrient concentrations to the ALI cultures. The membrane was made from polyethylene terephthalate (PET) with 12-µm thickness, 0.4-µm pore size, and density of 2 × 10⁶ pores/cm2 (Sterlitech, Kent, WA, USA), which is clear and materially similar to Transwells. Finally, for assembly of the cell cultures and dishes, a nontoxic sealant (737 RTV, Dow Corning, Midland, MI, USA) was used for attaching the 3D printed parts and membranes.
Materials and methods
Mass deposition in DAVID by fluorimetry
The mass deposition of aerosolized NPs to the customized ALI membranes in DAVID was first assessed using fluorometry without cells. A stock fluorescent solution at 50 µg/mL was prepared by dissolving uranine powder (water-soluble purified grade, Thermo Fischer Scientific, Waltham, MA, USA) in ultrapure water (Nanodiamond, Barnstead, Dubuque, IA, USA). A fluorescence calibration curve in the range of 0.1–1 µg/mL was prepared within the measurable fluorescence range of the fluorometer (Turner Quantech, Barnstead, Dubuque, Iowa, USA) by diluting the stock solution to known mass concentration. The mass concentration of the uranine dilutions were plotted against the measured raw fluorescence, and the regression equation of the linear trend line was determined with an R2 > 0.95. The resulting equation for the linear line was used to quantify the mass of aerosol deposited on the membranes in DAVID at different exposure times, aerosol concentrations, and operational flow rates.
The schematic of the experimental setup to evaluate the deposition of particles in DAVID is shown in .
Figure 2. Schematic diagram of the testing setup used to assess the mass deposition of nanoparticles on membrane supports in DAVID by fluorescence. Uranine aerosol droplets are generated by a nebulizer, dried to nanoparticles, and deposited on membrane supports by condensational particle growth in DAVID.
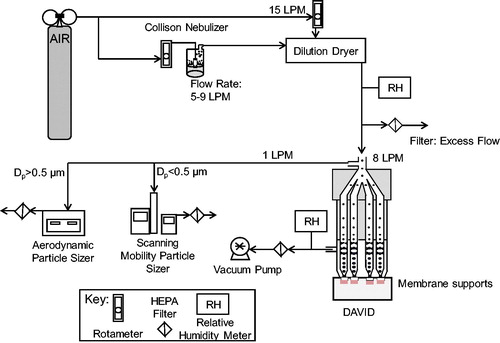
The aerosol was generated by a Collison nebulizer using clean breathing quality grade air (Air Liquide, Radnor, PA, USA) from a cylinder at the prescribed flow rate (5, 7, or 9 LPM), controlled by a rotameter (FLDA3216ST Rotameter, Omega Engineering, Norwalk, CT, USA), and diluted by 15 LPM of dry air to remove excess water from uranine droplets to form uranine NPs. An aerosol containing nanosized uranine particles was produced as a result with the final particle diameter, dp, predicted from EquationEquation (1)(1)
(1) (Hinds Citation1999):
(1)
(1)
where, dd is the droplet diameter and Vs is the volume fraction of the solute. The uranine NPs then entered DAVID, where they were enlarged in eight parallel growth tubes to uniform droplet sizes for impaction onto membranes. The collected aerosol samples were diluted to 100 µL with ultrapure water in a sample cuvette before measurement of raw fluorescence. The dilution step ensured that the fluorescence reading was within detection range and that the sample volume in the cuvette was substantial for measurement by the fluorometer detector. The raw fluorescence of the solution was measured by the fluorometer, and the deposited mass per area was determined by the mass-fluorescence calibration curve and corrected by the dilution factor in the cuvette and the surface area of the membrane.
In addition to aerosol number concentration, the difference in amplified particle size and mass deposition at the three operational flow rates of 4, 6, or 8 LPM in DAVID was evaluated. Flow rates were calibrated with a high-flow (2 to 20 LPM) calibrator (Gilian Gilibrator-2 Bubble Calibrator, Sensodyne Inc., St. Petersburg, FL, USA) and regulated by in-line rotameters. Next, the evenness in deposited mass dose among the four exposed membranes, experimental trials, and exposure times was evaluated (no cells cultured in these trials) by fluorometry.
The number concentration and size distribution of the nanosized particles in the test aerosol before exposure in DAVID were measured by a scanning mobility particle sizer (SMPS), which is comprised of a condensation particle counter (CPC model 3010, TSI Inc., Shoreview, MN, USA), an aerosol classifier (Classifier model 3080, TSI Inc., Shoreview, MN, USA) and a differential mobility analyzer (DMA 3081, TSI Inc., Shoreview, MN, USA). The size measurement of the amplified particles, which became larger than the size range measured by the SMPS, were therefore measured by an aerodynamic particle sizer (APS) (Spectrometer 3321, TSI Inc., Shoreview, MN, USA). The RH of the exhaust flow exiting DAVID (RH > 95%) and of the generated aerosols after dilution drying (RH < 10%) was monitored by an RH meter (HX93DAC-RP1, Omega Engineering). Each exposure condition was repeated in triplicate at time points of 5, 10, 15, and 20 min.
After each experimental trial, quality assessment of the deposition performance of DAVID was conducted. The performance was evaluated by operating DAVID with a 35-mm Petri dish in the exposure chamber as it was designed for 1 min, and then the droplet pattern in the Petri dish was visually inspected. Observing a pattern with less than 32 water droplet spots or having spots with less concentrated deposition in a certain region of the collection area indicated that there was either clogging of the jet nozzles or drying of the growth tube wicks. Since high particle concentrations were used in the experimental trials, cleaning of the nozzles and/or rewetting of the wicks was necessary between experiments to ensure that there was no decrease in collection efficiency due to blockage or limited water vapor concentration available for particle growth.
Cell culture
A549 cells (American Type Cell Collection [ATCC] CCL-185, ATCC, Manassas, VA, USA), which are a representative of alveolar type II pneumocytes of the human lung, were cultured according to the supplier’s protocols, with the exception of a different cell growth medium consisting of glutamate-free RPMI 1640 base media supplemented with 10% fetal bovine serum (Heat Inactivated FBS, Gibco, Carlsbad, CA, USA), 100-fold penicillin-streptomycin (Pen: 100 U/mL, Strep: 100 µg/mL, Gibco) dilution, and 100-fold dilution of GlutaMAX Supplement (35050061, Gibco). A549 cells were chosen because of prior success in growing them as ALI cultures, comparability to previously published studies, ease in culture, and for their clear response to exposure stimuli at the ALI (Zavala et al. Citation2016). The cells were cultured to confluence and were treated with trypsin-EDTA (Trypsin-EDTA [0.25%], with phenol red, Gibco) to detach them from flask, and counted by hemocytometer for plating. A stock cell suspension was prepared, and 0.1 mL of the cells was pipetted onto the culture membranes at a concentration of 59,400 cells/mL (Blank et al. Citation2006; Lenz et al. Citation2013). After 72 h of culture, the basal medium was replaced and the medium on the apical side was removed in preparation for exposure to aerosols at the ALI. The cells were then used for the cytotoxicity assessment of clean air within 24 h.
Clean air exposure to cell culture and cytotoxicity assessment
The viability of cells exposed to particle-free air was tested and compared to incubator controls. The ALI cell cultures in the incubator controls were prepared on the same cell culture platform as the ones used in the air exposure; however, they were not removed from the incubator until the toxicity analysis. The particle-free clean air for exposure was generated by filtering laboratory air with a high-efficiency particulate arresting (HEPA) filter. For each exposure, three A549 ALI cell cultures were placed in the exposure dish with 250 µL of media in the basal well. The cell cultures were exposed to clean air regulated by a rotameter attached to a vacuum pump for up to 20 min and then returned to the cell incubator for 24 h before basal media was removed for the analysis. Operation flow rates of 4 and 6 LPM were tested in DAVID due to their reliability in deposition in comparison to 8 LPM. The lactate dehydrogenase (LDH) cytotoxicity assay (Thermo Scientific, Waltham, MA, USA) was used following manufacturer protocol to evaluate the cellular effects of the flow rate.
Statistical analysis
The influence of the experimental variables on mass deposition and clean air was evaluated by linear regression and coefficient of variance (CoV) in Excel (Microsoft, Redmond, WA, USA). The mean, standard deviation, and CoV were determined for each exposure trial. Linear regression of the experimental variables, including: exposure time, operational flow rate, aerosol condition, exposure well, and experimental trial, was conducted using the regression tool in Microsoft Excel’s Data Analysis add-in. Four cell culture membranes were exposed simultaneously (N = 4) in the deposition study, and three cell cultures were used in the cell viability assessment (N = 3).
Results and discussion
Fabrication of cell culture platform
The flexibility to test and modify designs rapidly by 3D printing resulted in expedited development of the materials for integrating cell culture into the aerosol exposure system of DAVID. In this study, the common additive fused filament fabrication method for 3D printing was used as it is low-cost and widely available. While methods producing parts with finer tolerances exist, such as stereolithography or digital light processing, fused filament fabrication (tolerance ∼0.1 mm) was sufficient for producing the parts used in this study and is less costly by comparison. There were instances when a design did not print correctly and needed modification to allow for successful and repeatable printing. In the fabrication of the cell culture materials, the following considerations were made for successful fabrication of designs: size and refinement limitations of the printer head and build area, throughput (multiple units could be printed at the same time), simple designs that are fast to print, assembly using simple fabrication methods (glue), and a standard cell culture area to media volume ratio for normal cell growth and analysis by commercial assays. In addition to the 3D printing considerations, the compatibility of the printing material and adhesive with the cell culture may be the greatest factor in supporting growth and attachment. For physical cell attachment of some cell types to the membranes, an extracellular matrix of collagen or fibronectin may be necessary; however, for the A549 cells, surface treatment by oxygen plasma corona was sufficient for cell adhesion, which has been reported elsewhere (Cooney and Hickey Citation2011).
Aerosol droplet size
In a CPG system such as DAVID, which has an unlimited water vapor supply, particles with different starting diameters theoretically amplify to an asymptotic droplet size under the same condensation conditions (Wu and Biswas Citation1998). The asymptotic growth is determined by the residence time of the particles in the initiator that is controlled by the operational flow rate (Hering and Stolzenburg Citation2005). To determine the maximum diameter of the amplified droplets at each operational flow rate, the size of the background lab air particles (concentration ∼1,100 #/cm3) after CPG was measured. The count mean diameters of the droplets after CPG in DAVID are listed in .
Table 1. Count mean and median diameters of the droplets exiting the nebulizer (before dilution drier) and after condensational growth at operational flow rates of 4–8 LPM as measured by Aerodynamic Particle Sizer.
The three operational flow rates of DAVID at 4, 6, and 8 LPM resulted in amplified droplet sizes of 6.34 µm, 5.43 µm, and 5.00 µm, corresponding to residence times of 2.0 s, 1.3 s, and 0.98 s, respectively. The operational flow rates in DAVID correlated to the amplified droplet diameter, with the lowest flow rate producing the largest droplet diameter due to a longer residence time in the growth tube. Under these testing conditions, only the residence time limits the CPG when there is an unlimited supply of water vapor. However, should the vapor concentration be limited, the amplified droplet diameters will be less than what is expected (Wu and Biswas Citation1998), subsequently reducing their inertia and the impaction efficiency of DAVID.
At the maximum amplified diameters for all operational flow rates, CPG produces favorable impaction of particles in DAVID as determined by the 50% droplet cutoff diameter (d50) for an impactor, using the formula shown in EquationEquation (2)(2)
(2) (Hinds Citation1999):
(2)
(2)
where, Stk50 is the Stoke’s number for 50% cutoff and is fixed at 0.24 for circular jets, ρd is the density of the uranine droplet (∼1000 kg/m3 for excess water), η is the dynamic viscosity of air (1.837 × 10⁻⁵ kg/(m·s) at 25 °C), Dj is the jet diameter (0.66 mm), Q is the flow rate of each jet in DAVID (total operational flow rate 4–8 LPM divided by the 32 jets), and Cc is Cunningham slip correction which was ∼1.03 for the droplet diameters in (Dorf Citation2005). For the flow rates tested, the 50% droplet cutoff diameter decreased with an increased flow rate in DAVID. The d50 for 4, 6, and 8 LPM DAVID flow rates was 1.80 µm, 1.47 µm and 1.27 µm, respectively. Since the calculated cutoff diameters were smaller than the maximum amplified droplet size (), greater than 50% particle deposition efficiency was expected to occur at all operational flow rates as long as a high vapor concentration was present. The density of uranine solution was previously reported to be 1500 kg/m3 for a solution concentrated more than 30 times that of the collected droplets (Stöber and Flachsbart Citation1973); however, water was in excess around the uranine particles in DAVID, and therefore the density of water was used in EquationEquation (2)
(2)
(2) .
The condensed water on the particle surface coupled with an adequate flow velocity provided the inertia for depositing particles efficiently on membranes positioned under the growth tube channels. The size of the droplets after growth in DAVID affects the deposition efficiency; however, the final droplet diameter of the condensationally grown particles is also a function of the vapor content and the residence time in the growth tubes. Therefore, a higher flow rate will result in a faster impaction velocity for enhanced deposition; though, on the contrary, the amplified droplet diameter will be reduced. As shown in , an increased operational flow rate in DAVID not only decreases the amplified droplet size, but it also decreases the droplet cutoff diameter. The theoretical efficiency for the inertial impaction of droplets can be determined by EquationEquation (3)(3)
(3) (Theodore and De Paola Citation1980):
(3)
(3)
where, the efficiency (η) is related to the d50 determined in EquationEquation (2)
(2)
(2) and the amplified droplet size in DAVID shown in . From EquationEquation (3)
(3)
(3) , the deposition efficiency for the mean droplet size at the 4, 6, and 8 LPM operational flow rates resulted in 90.8%, 91.7%, and 92.6%, respectively. The ratio of the 50% cutoff droplet diameter to the amplified droplet size increases as flow rate is reduced; therefore, a greater particle deposition efficiency is predicted to occur at higher operational flow rates. Nevertheless, there is a limitation on the magnitude of the flow rate for cell exposure at the ALI, as high flow rates can reduce cell viability and cause other cellular stresses (Paur et al. Citation2011).
NP aerosol characterization
Three NP aerosol concentration levels – low (62,000 ± 435 particles/cm3), medium (130,000 ± 9,180 particles/cm3), and high (210,000 ± 16,200 particles/cm3) – were used to evaluate how particle number concentration affected the deposition of particles in DAVID; settings and results are shown in .
Table 2. Test aerosol production settings for the Collison nebulizer and dilution dryer and the product properties (particle concentration, count mean and median particle diameters, geometric standard deviation [GSD], mass median diameter, and diameter of average mass).
Despite having different particle number concentrations, the count mean and median diameters measured by SMPS were within 5%, and on average measured 56 nm and 42 nm, respectively. The spread of the diameter for the aerosol particles in logarithmic scale, known as the geometric standard deviation, decreased from 2.25 to 2.04 with an increase in the nebulizer flow rate from 5 LPM to 9 LPM, respectively. Using the geometric standard deviation, the mass median diameter and diameter of average mass were calculated, as shown in ; they follow the same trend, the mass median diameter and diameter of average mass of the aerosolized particles follow the same trend with the smallest mass diameter occurring at the higher nebulizer flow rate. In comparison to other ALI systems where dosing of NPs is typically on the scale of nanograms per square centimeter (ng/cm2) for 1- to 4-h exposures, the time required to deliver a high mass concentration of uranine to the membranes was short, up to 3 µg/cm2 in 20 min. For instance, 4.7–7 ng/cm2 of mineral oil aerosol was deposited on cells in a 2-h exposure by an ESP system and 61–561 ng/cm2 of 15 nm gold NPs was deposited on cells in a diffusion-based system with exposure time up to 10 h (Kim et al. Citation2013; Zavala et al. Citation2014).
Mass deposition of particles in DAVID
A comparison of the mass deposition of uranine particles at the three operational flow rates and under low, medium, and high particle concentration conditions are shown in . The non-black markers represent the mean of the four membranes in each experimental trial, while the black markers represent the mean of the replicate trials with the same exposure time and aerosol concentration. The error bars represent the standard error.
Figure 3. Mass deposition on membranes determined by fluorescence for operational flow rates in DAVID of (a) 4 LPM, (b) 6 LPM, and (c) 8 LPM at the three nanoparticle concentrations, and for the (d) low (e) medium, and (F) high particles concentrations for the three operational flow rates tested. In all of the graphs, the non-black markers are the mean of the four membranes in the experimental trial, and the black markers represent the mean of the replicate experimental trials with error bars representing the standard error. An example of deposition of the uranine droplets on the membranes in the exposure dish is overlaid in (d).
Linear regression analyses showed an increase R2 from 0.48 to 0.68 with the addition of the independent variables of exposure time, operational flow rate, aerosol concentration, replicate well, and exposure trial. The exposure trial and replicate wells did not have significant influence (p-value > 0.05) on the mass deposition in DAVID despite contributing to an overall higher R2, which indicated that the mass deposition was repeatable across the exposure wells and for replicate trials. Variables that influenced uranine deposition were the exposure time, operational flow rate, and aerosol concentration, which were expected as these variables affect the number of particles passing through the system and being exposed. In addition to the linear regression analysis, the CoV, shown in , provided insight into the repeatability and even dosing of particles on the membranes.
Table 3. The average coefficients of variation (CoV) of the replicate trials for the low (L), medium (M), and high (H) aerosol conditions and three operational flow rates at four exposure times.
As expected, the mass deposition of particles increases with time and particle number concentration. In , particle deposition linearly correlated with exposure time. There is little variation between the deposition of the NPs in the replicate experimental trials shown by the low CoV at various flow rates and experimental conditions in . The CoV for operation at 4 LPM is low with all of the conditions and exposure times (besides the 5-min low condition) having coefficients less than 0.25, and the majority falling below 0.12. When DAVID was operated at 6 LPM, the CoVs followed a similar trend as operation at 4 LPM. Importantly, increased exposure time and particle concentration when operating DAVID at 4 and 6 LPM resulted in lower CoVs that were no greater than 0.18 for the 5-, 10-, and 15-min time points, with the lowest CoV of 0.053 occurring for operation at the 20-min time point and high particle concentration condition. The higher CoVs for the 5-min exposure were likely due to less particles passing through the system, which consequently resulted in the fluorescence of the droplets collected being near the lower limit of detection for the fluorometer calibration curve (0.05 µg/ml) as determined by the three-sigma method. As the trend suggests, the particle deposition CoVs at operational flow rate of 6 LPM were less than at 4 LPM for the medium and high particle conditions, and higher at the low particle condition; however, as exposure time increased, the CoVs converge to the same value of 0.053 for the 20-min exposure with high particle concentrations. In other words, longer exposure times resulted in the collection of more particles, which increased the signal-to-noise ratio of the fluorescence measurements, subsequently decreasing the variability measured in mass deposition. In general, as the exposure time and aerosol particle number increased, the CoV decreased except for operation at 8 LPM.
The operation at 8 LPM produced variable mass deposition with higher CoVs at the longer exposure times and resulted in less mass deposition of uranine at the high condition than at the medium condition, despite having a higher particle number concentration transporting through the system. The problem was identified from the experiments: at higher flow rates, the wicks producing the water vapor source for condensation were not perfectly wet. Consequently, a limited amount of water vapor was available to condense on particles in DAVID, and as operational flow rate in DAVID increased, the particle number concentration that could be deposited decreased, which can be observed in where the high particle exposure concentration yielded deposition similar to and less than the medium aerosol concentration. Furthermore, higher flow rates should result in greater mass deposition; however, the drying of the growth tubes produced incomplete particle amplification and inconsistent results that led to the decrease in particle deposition at medium and high concentrations as shown in , which can be explained for CPG in a system with limited vapor (Wu and Biswas Citation1998). The areal density of deposited particle mass at the high condition was similar to at the medium condition even though there were 80,000 particles/cm2 greater particles passing through the system. Due to the limited water vapor availability for the particles at higher flow rates and particle concentration, it is likely that the particles were not growing to their maximum amplified droplet size in DAVID, and therefore the diameter of some of the droplets was less than the 50% cutoff diameter resulting in the lower deposition efficiency observed in the results. The drying of the CPG tubes produced variability in the data collection, i.e., deposition of uranine at 8 LPM. Therefore, the dataset for operation of DAVID at 8 LPM was not completed at all of the test conditions and was excluded from toxicity analysis. It is recommended that DAVID be operated at flow rates less than 8 LPM or that a more effective wetting mechanism for the wicks is developed. Despite this limitation, the current DAVID design was able to provide toxicologically relevant mass deposition of particles for exposure times between 5 and 20 min, at the 4 LPM and 6 LPM from 0.073 to 1.4 µg/cm2 and 0.18 to 3.0 µg/cm2, respectively.
Further evaluation of the particle deposition in DAVID was assessed at different operational flow rates. The mass deposition of uranine on the membranes at the medium particle concentration is shown in . The greatest mass deposition of uranine particles on the membranes was when DAVID was operated at 6 and 8 LPM for 20 min. At the same particle concentrations, the deposition of uranine was greater in DAVID when operated at 6 LPM than when operated at 8 LPM for 10 and 15 min and was similar at 5 min. Operation at 4 LPM yielded the lowest deposition, which was expected due to fewer particles passing through the system during exposure. The most interesting result occurred when the high particle concentration was used (: 6 LPM deposited greater mass than 8 LPM. There is also no 20-min time point for 8 LPM operation, which was due to frequent drying of the growth tubes resulting in no observable deposition. The inability to achieve a higher mass deposition at 8 LPM was likely due to the insufficient particle growth when high particle concentrations were used; however, improving the wetting of the growth tubes may overcome the limitations observed by the capillary force wetting of the wicks and may allow for exposures to be conducted at larger flow rates.
Deposition efficiency in DAVID at the three operational flow rates was calculated through relation of the measured fluorescence mass deposition to the inlet aerosol mass concentration determined by SMPS. The initial droplet size of the uranine aerosol was 4.09 µm, as shown in , and was subsequently dried by dilution to a count mean and median particle size near 56 nm and 42 nm, respectively, for all nebulizer flow rates, as shown in .
Figure 4. Count and mass particle size distributions of the fluorescent test aerosol from nebulizer under three flow conditions with constant 15 LPM dilution drying air. Flow rates for nebulization at low, medium, and high conditions were 5 LPM, 7 LPM, and 9 LPM, respectively. The different nebulizer flow rates produced aerosol concentrations of 62,000, 130,000, and 210,000 particles/cm3. Circular markers represent the count and other shapes represent the mass size distributions, respectively. Error bars represent standard deviation of eight SMPS scans.
The aerosol mass deposition was determined based on exposure time, aerosol flow rate, and the total aerosol volume predicted from the diameter of average mass, which was 107 nm, 93.9 nm, and 89.1 nm, respectively, for the 5, 7, and 9 LPM nebulizer flow rates for the test aerosol shown in and described in . The mass-based deposition efficiency of the aerosol was assessed for the 15- and 20-min time points since the signal-to-noise ratio was the least. The 6 LPM operational flow rate had the highest average deposition efficiency at 58% out of the three flow rates tested. The 4 LPM and 8 LPM had lower deposition efficiency of 46%; however, it should be noted that due to drying at 8 LPM operational flow rate, there were less data points for the 8 LPM operational flow rate than at 4 LPM. All operational flow rates on average had a deposition efficiency just over 50%, which was lower than the efficiencies predicted by EquationEquation (3)(3)
(3) . This difference is likely due to particle losses inside DAVID, which were not taken into consideration for the efficiency calculation in EquationEquation (3)
(3)
(3) . A particle deposition efficiency of 46% is nonetheless a significant improvement over previously demonstrated physiologically relevant exposure systems that utilize diffusion mechanism for delivering NPs to ALI cells, which is ∼2% efficient (Bitterle et al. Citation2006). Furthermore, aerosol exposure chambers with deposition enhancement by ESP have reported efficiencies anywhere from 15% to 88% depending on the particle size and the method for quantifying the deposition (Savi et al. Citation2008; Volckens et al. Citation2009; Jeannet et al. Citation2015). The higher deposition efficiencies reported for AECs utilizing ESP used corona charging, which is not physiologically relevant and can greatly change the properties of the particles for cell exposure and alter the toxicity outcome.
Cell viability
The optimal operational flow rate for conducting cell exposure was further evaluated by measuring the LDH viability of ALI cell cultures exposed to particle-free clean air in DAVID. Exposure aerosols with a flow velocity too high or an RH too low have been shown to significantly decrease cell viability and produce negative biologic responses (Zavala et al. Citation2017). A compromise in the deposition efficiency and the operational flow rate for cellular exposure to aerosols in DAVID for minimal effect on cell viability (<5%) may be needed in order to accurately assess the biological effect of the exposure NPs alone. In this study, particle-free clean air was used to evaluate the effect of flow rate on the viability of ALI cells exposed in DAVID. While the total operational flow rate (i.e., 4, 6, and 8 LPM) in DAVID has been used as the testing parameter, the flow flux across the membrane surface better describes the interaction of the aerosol flow and cells. Since each cell culture in DAVID was exposed by four of the 32 jets, the effective flow rate to each cell culture was 4/32 or 1/8 of the total flow. Accordingly, flow rates of 4, 6, and 8 LPM over culturable surface areas of 0.36 cm2 resulted in flow fluxes to the cell surface of 4.75 mL/min/cm2, 7.13 mL/min/cm2, and 9.50 mL/min/cm2, respectively. These flow fluxes are less than those previously reported for clean air exposures of 21 mL/min/cm2 and greater that were shown to decrease the viability of a lung cell co-culture exposed in a diffusion system (Diabaté et al. Citation2008). That system used a single trumpeted nozzle per cell culture to deposit particles, which is what is used in many of the commercial AEC designs; thus, flow fluxes used in most other studies investigating NM toxicity are similar (Fröhlich et al. Citation2013; Jeannet et al. Citation2015). In comparison to previous studies, the operational flow conditions used in DAVID are reasonable to cause minimum cellular effects.
Although CPG has not been previously demonstrated for toxicity evaluation at the ALI of cell cultures of aerosols, inertial impaction has been demonstrated as a useful method for exposing cell cultures to agglomerated diesel exhaust particles. In a previous study, jet velocities of 45.5 m/s and greater were needed for particle deposition (Cooney and Hickey Citation2011). A jet velocity of 45.5 m/s is substantially greater than the velocity used for particle exposure in DAVID, which ranged from 6 to 12 m/s depending on the operational flow rate. Due to the increased size and subsequent inertial force of the particles by the CPG process, a lower impaction jet velocity was needed for the deposition of particles in DAVID than by classic inertial impaction, subsequently reducing flow-related stresses to cells. Although all of the jet flow velocities tested in DAVID were below those previously used and the flow fluxes were within the range previously shown to have no effect on cell culture, the previously reported problems in wetting at operational flow rate of 8 LPM prevented it from further consideration.
The cell viability results, measured by LDH assay, are shown for the exposure flow rates of 4 and 6 LPM in .
Figure 5. Lactate dehydrogenase (LDH) viability assessment of cells exposed to clean HEPA filtered air at 4 and 6 LPM operational flow rates in DAVID and with no flow (control). Error bars represent the standard error for an n = 3.
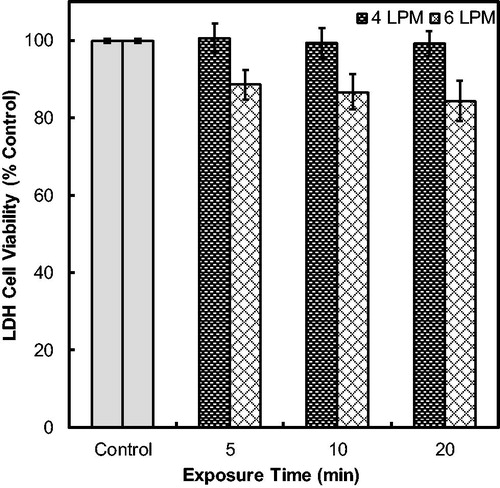
Although not dramatic, the 6 LPM flow rate particle-free exposures resulted in a decrease in the cell viability and significant difference from the 4 LPM flow rate at each of the exposure time points. There was no change in viability observed for the cells exposed at 4 LPM at all the time points, which was verified by the linear regression showing that the exposure time, well, and trial did not have impact on cell viability (p-value < 0.05). Seen in , the clean air exposure at 6 LPM decreased cell viability up to 15.6% of the untreated incubator control cultured on the same substrate (100%). When DAVID was operated at 4 LPM, the viability of the cells was greater than 99% and similar to the control for all exposure time points, which achieved the target of less than 5% change from the incubator control. Linear regression showed that the operational flow rate significantly affected the cell viability during exposure of clean air in DAVID. Although 6 LPM operational flow rate was shown to significantly decrease cell viability, it is possible to conduct future cell exposure experiments at 6 LPM by incorporating a correction factor. Operation at 6 LPM is not necessary, however, since 4 LPM provides suitable mass deposition for toxicity studies while also not reducing the viability from baseline control.
Conclusion
A CPG system, known as DAVID, was validated for reliable and efficient deposition of particles on cells cultured at the ALI for aerosol exposure toxicity analysis. Favorable temperature and humidity settings aided in maintaining optimal cell condition with no impact on viability during exposure; the length of time needed to expose cells to deliver a sufficient mass dose was on the order of minutes, which was substantially shorter than the hours required by other exposure methods. Unlike conventional submerged cell exposure, DAVID provided a more physiologically relevant way to dynamically evaluate the toxicity of airborne particles. The mass deposition on custom membrane supports was evaluated at four time points with three particulate aerosol concentrations under three operational flow conditions. The deposition across exposure wells and between experimental trials was demonstrated to be statistically consistent and repeatable. The low variability in deposited dose between membranes allows for the application of DAVID as a reliable tool to investigate initial toxicity of NPs in a rapid manner that is relevant to inhalation toxicity, as multiple cultures of same or different cell lines can be exposed simultaneously. Although DAVID has an engineered environment to sustain cell culture at optimal conditions, the large mass delivery of NPs in a short exposure period reduces the time cells are outside the incubator and the subsequently associated stress. Operation of DAVID at 6 LPM resulted in a favorable delivery of the aerosols to membranes, with mass deposition ranging from 0.18 to 3.0 µg/cm2 depending on the exposure condition of the aerosol and time. Optimization experiments of DAVID demonstrated that 4 LPM provided adequate particle deposition without adversely affecting cell viability. Although DAVID is capable for exposure as designed in this study, further improvements to the wetting of the growth tubes can increase vapor supersaturation in the growth tubes and inherently increase the deposition efficiency to make feasible exposure of cells to NPs at higher operational flow rates and higher particle concentrations. Furthermore, exposing complex cell cultures to NPs in DAVID, ones that can differentiate at the ALI and contain multicellular primary cells, may further improve the in vitro toxicity assessment.
Acknowledgments
The authors would like to thank the Student Research Participation Program at the U.S. Air Force Research Laboratory, 711th Human Performance Wing, Airman Systems Directorate, Bioeffects Division, Molecular Mechanisms Branch administered by the Oak Ridge Institute for Science and Education through an interagency agreement between the U.S. DOE and USAFRL for the support of this work. Special thanks to Drs. Chelsey Simmons and Hugh Fan for research guidance and use of their oxygen plasma treater and UV sterilization devices for the custom cell platforms.
Disclosure statement
No potential conflict of interest was reported by the authors.
Additional information
Funding
References
- Biswas, P., and C. Wu. 2005. Nanoparticles and the environment nanoparticles and the environment. J. Air Waste Manag. Assoc. 55 (6):708–746.
- Bitterle, E., E. Karg, A. Schroeppel, W. G. Kreyling, A. Tippe, G. A. Ferron, O. Schmid, J. Heyder, K. L. Maier, and T. Hofer. 2006. Dose-controlled exposure of A549 epithelial cells at the air – Liquid interface to airborne ultrafine carbonaceous particles. Chemosphere. 65 (10):1784–1790. doi: 10.1016/j.chemosphere.2006.04.035.
- Blank, F., B. M. Rothen-Rutishauser, S. Schurch, and P. Gehr. 2006. An optimized in vitro model of the respiratory tract wall to study particle cell interactions. J. Aerosol Med. 19 (3):392–405. doi: 10.1089/jam.2006.19.392.
- Broßell, D., S. Tröller, N. Dziurowitz, S. Plitzko, G. Linsel, C. Asbach, N. Azong-Wara, H. Fissan, and A. Schmidt-Ott. 2013. A thermal precipitator for the deposition of airborne nanoparticles onto living cells – Rationale and development. J. Aerosol Sci. 63:75–86. doi: 10.1016/j.jaerosci.2013.04.012.
- Buzea, C., I. I. Pacheco, K. Robbie, and C. Buzea. 2007. Nanomaterials and nanoparticles: Sources and toxicity. Biointerphases. 2 (4):MR17–MR71.
- Cooney, D. J., and A. J. Hickey. 2011. Cellular response to the deposition of diesel exhaust particle aerosols onto human lung cells grown at the air-liquid interface by inertial impaction. Toxicol. In Vitr. 25 (8):1953–1965. doi: 10.1016/j.tiv.2011.06.019.
- de Bruijne, K., S. Ebersviller, K. G. Sexton, S. Lake, D. Leith, R. Goodman, J. Jetters, G. W. Walters, M. Doyle-Eisele, R. Woodside, H. E. Jeffries, and I. Jaspers. 2009. Design and testing of electrostatic aerosol in vitro exposure system (EAVES): An alternative exposure system for particles. Inhal. Toxicol. 21 (2):91–101. doi: 10.1080/08958370802166035.
- Diabaté, S., S. Mülhopt, H.-R. Paur, and H. F. Krug. 2008. The response of a co-culture lung model to fine and ultrafine particles of incinerator fly ash at the air–liquid interface. Altern. Lab. Anim. 36 (3):285–298. doi: 10.1177/026119290803600306.
- Donaldson, K., L. Tran, L. A. Jimenez, R. Duffin, D. E. Newby, N. Mills, W. MacNee, and V. Stone. 2005. Combustion-derived nanoparticles: A review of their toxicology following inhalation exposure. Part Fibre Toxicol. 2:1–14.
- Dorf, R. C. (Ed.) 2005. The engineering handbook. 2nd ed. Boca Raton, FL: CRC Press.
- Fröhlich, E., G. Bonstingl, A. Höfler, C. Meindl, G. Leitinger, T. Pieber, and E. Roblegg. 2013. Comparison of two in vitro systems to assess cellular effects of nanoparticles-containing aerosols. Toxicol. In Vitr. 27 (1):409–417. doi: 10.1016/j.tiv.2012.08.008.
- Gentile, F., and P. Decuzzi. 2010. Time dependent dispersion of nanoparticles in blood vessels. JBiSE. 03 (05):517–524. doi: 10.4236/jbise.2010.35072.
- Gray, T. E., K. Guzman, C. W. Davis, L. H. Abdullah, and P. Nettesheim. 1996. Mucociliary differentiation of serially passaged normal human tracheobronchial epithelial cells. Am. J. Respir. Cell. Mol. Biol. 14 (1):104–112. doi: 10.1165/ajrcmb.14.1.8534481.
- Hering, S. V., and M. R. Stolzenburg. 2005. A method for particle size amplification by water condensation in a laminar, thermally diffusive flow. Aerosol Sci. Technol. 39(5):428–436. doi: 10.1080/027868290953416.
- Hinds, W. C. 1999. Aerosol technology: Properties, behavior, and measurement of airborne particles. 2nd ed. New York: John Wiley & Sons Inc.
- Huh, D., B. D. Matthews, A. Mammoto, M. Montoya-Zavala, Y. H. Hsin, and D. E. Ingber. 2010. Reconstituting organ-level lung functions on a chip. Science. 328 (5986):1662–1668. doi: 10.1126/science.1188302.
- Jeannet, N., M. Fierz, M. Kalberer, H. Burtscher, and M. Geiser. 2015. Nano aerosol chamber for in-vitro toxicity (NACIVT) studies. Nanotoxicology. 9 (1):34–42. doi: 10.3109/17435390.2014.886739.
- Kennedy, I. M. 2007. The health effects of combustion-generated aerosols. Proc. Combust. Inst. 31 (2):2757–2770. doi: 10.1016/j.proci.2006.08.116.
- Kim, J. S., T. M. Peters, P. T. O’Shaughnessy, A. Adamcakova-Dodd, and P. S. Thorne. 2013. Validation of an in vitro exposure system for toxicity assessment of air-delivered nanomaterials. Toxicol. In Vitr. 27 (1):164–173. doi: 10.1016/j.tiv.2012.08.030.
- Lednicky, J., M. Pan, J. Loeb, H. Hsieh, A. Eiguren, S. Hering, Z. H. Fan, and C. Wu. 2016. Highly efficient collection of infectious pandemic influenza H1N1 virus (2009) through laminar-flow water based condensation. Aerosol Sci. Technol. 50 (7):i–4. doi: 10.1080/02786826.2016.1179254.
- Lenz, A. G., E. Karg, E. Brendel, H. Hinze-Heyn, K. L. Maier, O. Eickelberg, T. Stoeger, and O. Schmid. 2013. Inflammatory and oxidative stress responses of an alveolar epithelial cell line to airborne zinc oxide nanoparticles at the air-liquid interface: A comparison with conventional, submerged cell-culture conditions. Biomed. Res. Int. 2013:1. doi: 10.1155/2013/652632.
- Lenz, A., E. Karg, B. Lentner, V. Dittrich, C. Brandenberger, B. Rothen-Rutishauser, H. Schulz, G. A. Ferron, and O. Schmid. 2009. A dose-controlled system for air-liquid interface cell exposure and application to zinc oxide nanoparticles. Part Fibre Toxicol. 6 (1):32. doi: 10.1186/1743-8977-6-32.
- Li, J. J., S. Muralikrishnan, C. Ng, L. L. Yung, and B. Bay. 2010. Nanoparticle-induced pulmonary toxicity. Exp. Biol. Med. (Maywood). 235 (9):1025–1033.
- Lichtveld, K. M., S. M. Ebersviller, K. G. Sexton, W. Vizuete, I. Jaspers, and H. E. Jeffries. 2012. In vitro exposures in diesel exhaust atmospheres: Resuspension of PM from filters versus direct deposition of PM from air. Environ. Sci. Technol. 46 (16):9062–9070.
- Longest, P. W., and J. Xi. 2008. Condensational growth may contribute to the enhanced deposition of cigarette smoke particles in the upper respiratory tract. Aerosol Sci. Technol. 42 (8):579–602. doi: 10.1080/02786820802232964.
- McMurry, P. H. 2000. The history of condensation nucleus counters. Aerosol Sci. Technol. 33 (4):297–322. doi: 10.1080/02786820050121512.
- Oberdörster, G. 2001. Pulmonary effects of inhaled ultrafine particles. Int. Arch. Occup. Environ. Health 74 (1):1–8.
- Pan, M., A. Eiguren-Fernandez, H. Hsieh, N. Afshar-Mohajer, S. V. Hering, J. Lednicky, Z. Hugh Fan, and C.-Y. Wu. 2016. Efficient collection of viable virus aerosol through laminar-flow, water-based condensational particle growth. J. Appl. Microbiol. 120(3):805–815. doi: 10.1111/jam.13051.
- Paur, H., F. R. Cassee, J. Teeguarden, H. Fissan, S. Diabate, M. Aufderheide, W. G. Kreyling, H. Otto, G. Kasper, M. Riediker, B. Rothen-Rutishauser, and O. Schmid. 2011. In-vitro cell exposure studies for the assessment of nanoparticle toxicity in the lung — A dialog between aerosol science and biology. J. Aerosol Sci. 42 (10):668–692. doi: 10.1016/j.jaerosci.2011.06.005.
- Peters, A. 2005. Particulate matter and heart disease: Evidence from epidemiological studies. Toxicol. Appl. Pharmacol. 207 (2):477–S482. doi: 10.1016/j.taap.2005.04.030.
- Pezzulo, A. A., T. D. Starner, T. E. Scheetz, G. L. Traver, A. E. Tilley, B.-G. Harvey, R. G. Crystal, P. B. McCray, and J. Zabner. 2011. The air-liquid interface and use of primary cell cultures are important to recapitulate the transcriptional profile of in vivo airway epithelia. AJP Lung Cell. Mol. Physiol. 300 (1):L25–L31. doi: 10.1152/ajplung.00256.2010.
- Rach, J., J. Budde, N. Mohle, and M. Aufderheide. 2014. Direct exposure at the air-liquid interface: Evaluation of an in vitro approach for simulating inhalation of airborne substances. J. Appl. Toxicol. 34 (5):506–515. doi: 10.1002/jat.2899.
- Savi, M., M. Kalberer, D. Lang, M. Ryser, M. Fierz, A. Gaschen, J. RičKa, and M. Geiser. 2008. A novel exposure system for the efficient and controlled deposition of aerosol particles onto cell cultures. Environ. Sci. Technol. 42 (15):5667–5674. doi: 10.1021/es703075q.
- Schwarze, P. E., J. Ovrevik, M. Låg, M. Refsnes, P. Nafstad, R. B. Hetland, and E. Dybing. 2006. Particulate matter properties and health effects: Consistency of epidemiological and toxicological studies. Hum. Exp. Toxicol. 25 (10):559–579. doi: 10.1177/096032706072520.
- Stöber, W., and H. Flachsbart. 1973. An evaluation of nebulized ammonium fluorescein as a laboratory aerosol. Atmos. Environ. 7 (7):737–748. doi: 10.1016/0004-6981(73)90154-6.
- Stone, V., M. R. Miller, M. J. Clift, A. Elder, N. L. Mills, P. Møller, R. P. Schins, U. Vogel, W. G. Kreyling, K. Alstrup Jensen, T. A. Kuhlbusch, P. E. Schwarze, P. Hoet, A. Pietroiusti, A. De Vizcaya-Ruiz, A. Baeza-Squiban, C. Lang Tran, and F. R. Cassee. 2017. Nanomaterials vs ambient ultrafine particles: An opportunity to exchange toxicology knowledge. Environ. Heal. Perspect. 125 (10):1–17.
- Teeguarden, J. G., B. J. Webb-Robertson, K. M. Waters, A. R. Murray, E. R. Kisin, S. M. Varnum, J. M. Jacobs, J. G. Pounds, R. C. Zanger, and A. A. Shvedova. 2011. Comparative proteomics and pulmonary toxicity of instilled single-walled carbon nanotubes, crocidolite asbestos, and ultrafine carbon black in mice. Toxicol. Sci. 120 (1):123–135. doi: 10.1093/toxsci/kfq363.
- Theodore, L., and V. De Paola. 1980. Predicting cyclone efficiency. J. Air Pollut. Control Assoc. 30 (10):1132–1133. doi: 10.1080/00022470.1980.10465160.
- Tu, K. W., and E. O. Knutson. 1984. Total deposition of ultrafine hydrophobic and hygroscopic aerosols in the human respiratory system. Aerosol Sci. Technol. 3 (4):453–465. doi: 10.1080/02786828408959032.
- Volckens, J., L. Dailey, G. Walters, and R. Devlin. 2009. Particle-to-cell deposition of coarse ambient particulate matter increases the production if inflammatory mediators from cultured human airway epithelial cells. Environ. Sci. Technol. 43 (12):4595–4599. doi: 10.1021/es900698a.
- Wu, C., and P. Biswas. 1998. Particle growth by condensation in a system with limited vapor. Aerosol Sci. Technol. 28 (1):1–20. doi: 10.1080/02786829808965508.
- Zavala, J., R. Greenan, Q. T. Krantz, D. M. DeMarini, M. Higuchi, M. I. Gilmour, and P. A. White. 2017. Regulating temperature and relative humidity in air–liquid interface in vitro systems eliminates cytotoxicity resulting from control air exposures. Toxicol. Res. 6 (4):448. doi: 10.1039/C7TX00109F.
- Zavala, J., K. Lichtveld, S. Ebersviller, J. L. Carson, G. W. Walters, I. Jaspers, H. E. Jeffries, K. G. Sexton, and W. Vizuete. 2014. The Gillings sampler – An electrostatic air sampler as an alternative method for aerosol in vitro exposure studies. Chem. Biol. Interact. 220:158–168.
- Zavala, J., B. O’Brien, K. Lichtveld, K. G. Sexton, I. Rusyn, I. Jaspers, and W. Vizuete. 2016. Assessment of biological responses of EpiAirway 3-D cell constructs versus A549 cells for determining toxicity of ambient air pollution. Inhal. Toxicol. 28 (6):251–259. doi: 10.3109/08958378.2016.1157227.