
Abstract
Introduction: The current study evaluates the data quality achievable using a national data bank for reporting radiotherapy parameters relative to the classical manual reporting method of selected parameters.
Methods: The data comparison is based on 1522 Danish patients of the DBCG hypo trial with data stored in the Danish national radiotherapy data bank. In line with standard DBCG trial practice selected parameters were also reported manually to the DBCG database. Categorical variables are compared using contingency tables, and comparison of continuous parameters is presented in scatter plots.
Results: For categorical variables 25 differences between the data bank and manual values were located. Of these 23 were related to mistakes in the manual reported value whilst the remaining two were a wrong classification in the data bank. The wrong classification in the data bank was related to lack of dose information, since the two patients had been treated with an electron boost based on a manual calculation, thus data was not exported to the data bank, and this was not detected prior to comparison with the manual data. For a few database fields in the manual data an ambiguity of the parameter definition of the specific field is seen in the data. This was not the case for the data bank, which extract all data consistently.
Conclusions: In terms of data quality the data bank is superior to manually reported values. However, there is a need to allocate resources for checking the validity of the available data as well as ensuring that all relevant data is present. The data bank contains more detailed information, and thus facilitates research related to the actual dose distribution in the patients.
Introduction
Clinical trials depend upon the ability to report treatment and outcome values. This can be done by manually reporting a few key values or by sending the entire data set to a data bank directly from the treatment planning system. It is often stated that a data bank approach will ensure better data quality, since mistakes occur during the manual reporting stage [Citation1,Citation2]. This might be true, but neglects possible mistakes in a data bank reporting system. Thus, such systems need to be verified in order to validate how the data quality compares to quality of a manual reporting system.
Using a data bank to record treatment data allows the possibility to collect detailed information on the radiotherapy as the entire treatment planning dataset can be submitted with a time cost comparable to or even less than that used to report selected parameters manually. Such an approach will make it possible to address more detailed treatment planning questions in clinical trials, but will also make it possible to access all data for retrospective analyzes. Storage of all the relevant planning data is also the basis for federated databases [Citation3] facilitating international data mining. This will allow researchers to address questions which would be hard or impossible to address using standard randomized phase III trials. However, before starting such studies it is important to validate the data quality of the applied data bank.
There are a number of initiatives around the world to collect large amounts of radiotherapy treatment parameters [Citation4–7]. In Denmark, a national storage facility of DICOM data has been established [Citation8]. It is currently used by a number of clinical trials [Citation9–13] and contains radiotherapy information from more than 5000 patients. This study focuses on the largest clinical trial in the data bank; a clinical randomized trial on hypo-fractionation from the Danish Breast Cancer Group (DBCG) with 1883 patients, of which 1550 patients were Danish. The aim of the current study is to compare the data quality within the data bank relative to the quality of manually reported values; such that this information can be used as a reference of data quality in future trials based on similar data bank systems.
Method
Among 1883 randomized early breast cancer patients for the DBCG trial ‘Hypofractionated Versus Standard Fractionated Whole Breast Irradiation to Node-negative Breast Cancer Patients’ (clinicaltrials.gov NR NCT00909818), 1550 patients were from Denmark, and 1522 of these accepted submission of their treatment plan to the Danish radiotherapy data bank. These 1522 patients are all included in the current analysis between dose parameters from the dose plans in the data bank and the prospectively manually reported parameters. The patients were enrolled from four Danish centers.
The clinical trial is a randomized radiotherapy trial between two post-surgery treatment arms of either 50 Gy/25 fractions (2.0 Gy per fraction) or 40 Gy/15 fractions (2.67 Gy per fraction) with the primary endpoint late radiation morbidity. If indicated by the DBCG guidelines a sequential boost of either 10 or 16 Gy was delivered to the tumor bed (e.g., patients < 50 years or resection margin < 2mm). As part of the clinical trial both radiotherapy and follow-up data were reported to the DBCG database in line with previous DBCG trials. In parallel to the manual reporting all DICOM RT information of the treatment plans were also collected in the national DICOM data bank. The infrastructure of the national DICOM data bank has been described by Westberg et al. [Citation8]. The database consists mainly of three parts (1) A DICOM server that receives data exported from the participating institutions (2) A set of servers to process the data (3) A web interface for accessing the data. Data are only available within the data bank after they are assigned to a specific clinical collaboration, which is done using the web interface. Permission to access the data are user specific and can range from viewing trial aggregated values only from the users own institution, to the ability to download the entire set of data available in the data bank. Institution specific rules for mapping local structure names to trial specific structure names are defined within a given clinical trial in the data bank. The web interface provides direct access to predefined trial specific dose values (e.g., mean dose, maximum dose, and near max dose) and the ability to export the raw DICOM data makes it possible to calculate more specific values not implemented in the web interface.
The current study compares values reported manually versus those obtained from the DICOM data bank. The following parameters were available in both systems and thus used for comparison:
Laterality, i.e., left or right sided breast cancer
Treatment arm (40/50 Gy)
Boost (none/10/16 Gy)
CTV (for non-boost plans):
Minimum dose in percentage of prescribed dose of primary treatment (i.e., 40/50 Gy)
Volume fraction of CTV receiving dose < 95% of prescribed dose
Maximum dose in percentage of prescribed dose
Volume fraction of CTV receiving doses > 105% and ≤107% of prescribed dose
Absolute volume of CTV receiving doses > 107% and ≤110% of prescribed dose
Heart: V20 and V40 for the 50 Gy arm and V17 and V35 for the 40 Gy arm
Left anterior descending artery (LADCA): Maximum dose
Ipsilateral lung: V20 for 50 Gy arm and V17 for 40 Gy arm
Volume of the breast CTV
Date of treatment (the data bank value defined by date of treatment planning CT scan).
Not all of the above items are directly accessible from the submitted data in the data bank since the information is not stored in the DICOM header. For boost treatments one center provided the dose summed over the primary and boost treatment, while the other centers provided the same data as two separate treatment plans. The dose from centers providing separate plans were summed, which was possible since the two plans were planned using the same planning CT. For a few patients a manually calculated electron boost was used for treatment, thus the dose distribution was not available in the data bank. To determine if a boost was delivered and if so the delivered dose (item 2 and 3 in list above), the following was evaluated: (1) number of treatment plans available for the patient, (2) detection of a boost structure in the data, (3) automatic shape detection of DVH (detection of peaks in the differential CTV DVH of the combined treatment) and (4) Near max dose (D0.027 cm3 – the dose related to the upper 0.027 cm3 of the DVH) values for CTV for the combined treatment. Determination of treatment arm (i.e., 40 Gy or 50 Gy), and type of boost were performed by at least two of these methods. Only in a few cases where the determined values disagreed a manual inspection was needed. Laterality (item 1 in the list above) was identified by comparing the summed dose in the left and right half of the CT scan.
Prior to comparison with the manual data a number of automated self-consistency checks were performed on the DICOM data in the data bank. The checks included detection of possible lack of data (e.g., missing dose files or missing boost plan), duplicate data (e.g., two plans for same treatment) and the mapping of local structure names to structure names used in the data bank.
The manual data were obtained directly from the DBCG secretary according to standard procedure in clinical DBCG trials [Citation14].
Comparisons of manual versus the data bank obtained parameters were performed using either x-y scatter plots or contingency tables for continuous or categorical variables respectively. Differences between the data bank and manual values were investigated to clarify which of the two were closest to the actual/true value based on information from the local record and verify systems and by comparing patient specific deviation for a set of dose parameters as described in the results.
Results
shows contingency tables comparing results from the data bank with manually reported values. In 18 cases the trial arm was not identified in the manual data. For six patients the manual and the data bank assignments disagreed. Manual validation of the six treatment plans in the data bank supported the assignment performed by the data bank. For laterality 15 cases were not classified consistently between the two systems. Manual validation of the 15 patient treatment plans found all to agree with the data bank laterality classification. Type of boost classification was not consistent for four patients. Two patients who were reported to have received a boost in the data bank were verified in the local record and verify system to be assigned correctly. The remaining two patients which in the data bank were assigned to have had no boost did actually have a boost treatment. The wrong classification in the data bank was related to a lack of dose information, since the two patients had been treated with an electron boost based on a manual calculation, thus no data were exported to the data bank. The combined error and missing rate for the manual method was 1.5%, 1.3%, and 0.4% for trial arm, laterality, and boost type, respectively. For the data bank no wrong identifications were found for laterality and treatment arm, but an error rate of 0.1% in assignment of boost type was seen.
Table 1. Contingency tables between manual reporting and data submitted to the data bank.
The continuous parameters for which the largest degree of consistency exists between the data bank and manual reported value is shown in , having the manual value on the x-axis and the data bank value on the y-axis. The difference between the third and the first quartile (interquartile range – IQ) of distribution of the differences between the data bank and manual value is shown in the figure. The differences between the two sets of values have been examined for outliers, similar to what is typically used in boxplots initially introduced by Tukey [Citation15]. In line with common practice outliers were defined as data points where the difference between the manual and the data bank value is further outside the first or third quartile than 1.5 times the interquartile range [Citation15]. Similarly, extreme outliers were defined as points further away than three times the interquartile range [Citation15]. If the data were normal distributed the probability of observing an outlier would be 7 × 10⁻³ and an extreme outlier 2 × 10⁻⁶. In the figure the extreme outliers are shown as red points and the remainder as blue points. The percentage of outliers (out) and extreme outliers (ext) are also shown in the figure. The number of data points missing related to the x- and y-axis are also shown in the figure. Finally, a black line of identity is included.
Figure 1. Comparison between values of manual and data bank for: date of RT, CTV volume, minimum dose to CTV, maximum dose to LADCA, CTV maximum, and 1-V95 values (Vx–x% of volume covered by the prescribed dose). IQ is the inter quartile range of the differences between the data bank and manual value. The percentage of outliers and extreme outliers (definition see text) is shown as well as the number of missing data on the x- and y-axis. Red points represent extreme outliers. Two points in subsection c with manual CTV values above 700% are outside the displayed area. Misunderstanding of the interpretation of the specific values in the manual reporting system is seen in subsection e–f, but most pronounced in subsection f.
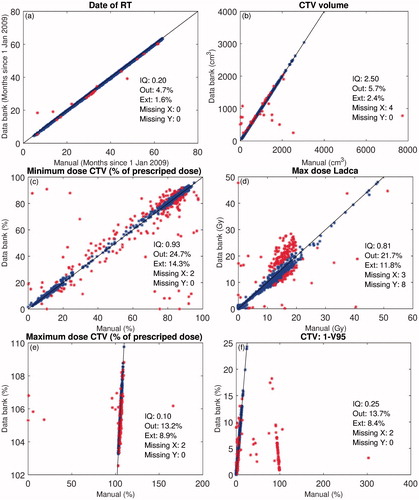
The date of radiotherapy data in demonstrates a close to perfect line except for a few extreme outliers shown as red points. The same tendency is seen for the CTV volume in with a larger spread of the red points. The red points could potentially indicate that the data bank did not contain the correct treatment plans. However, if the data bank did contain a wrong treatment plan it is unlikely that the reported CTV volume would agree with the manually reported value. Given that the CTV is manually delineated a volume difference between delineations on two separate CT scans of the same patient will likely differ more than 5 cm3 knowing that the median CTV volume is 627 cm3 (5 cm3 volume difference corresponds to a radius difference of 0.14 mm for a spherical CTV; 5 cm3 is also only twice the interquartile range seen in ). Selection of all the patients with CTV volume deviations of more than 5 cm3 results in a set of 152 patients. Of these patients the dates of the CT scan were between −21 to 0 days relative to the manual reported start of treatment except for four patients. Except for these four cases the plans in the data bank are thus at least representative for the dose distribution in the patient, even if a re-plan should have been performed. For the last four patients their reported V20/V17 ipsilateral lung value are at the maximum 0.2% different from the manually reported value, indicating that the data bank plans are identical to the plans used for manual reporting. The dominating effect for observed differences in is therefore uncertainties in the manual reporting process and not due to incorrect plans in the data bank.
is an example of data with a higher level of deviation between the two methods of reporting, and is an example of the problems related to reporting maximum and minimum values as opposed to near maximum and minimum values as recommended in the ICRU report 83 [Citation16]. However, ICRU 83 was published after the DBCG hypo trial was initiated, which is part of the reason why no near max or min doses were reported manually. The large spread in data values for LADCA in is related to the presence of a steep dose gradient next to LADCA. Small differences in the interpretation of the structure position in different computer systems leads to large uncertainties in the maximum dose. The uncertainty will increase as the dose gradient next to LADCA increases. The largest dose gradient will be at doses close to half the prescribed dose which is also reflected in the figure as increased deviations in that dose area. The eight missing LADCA values in the data bank, is due to a local decision not to delineate LADCA on these eight right sided treatment plans.
illustrates some of the problems in manual reporting of more complicated dose parameters. Both for the CTV maximum dose and in particular for 1-V95 for the CTV, it is clear that not all users have the same understanding of the individual parameters to report. For the CTV maximum some points are reported as percent over-dosage and others as percentage of prescribed dose. However, the problems are clearly more severe for the 1-V95 in which a large subset has been reported as V95, which is directly accessible in all planning systems. The wrong 1-V95 data are almost entirely from one of the contributing centers, but that center has only reported approximately 20% of their data in that format. Further plots of CTV dose coverage as well as dose to ipsilateral lung and heart is available in the Supplementary material.
In a large number of the presented figures the fraction of extreme outliers was approximately 10%. This value is a clear indication that quite long tails are present for the difference between the two set of reported values. Given the information from the data bank it is easy to see that a number of the manual values simply deviate by an order of magnitude (one zero too many or less during manual typing) or interchange of two digits.
Discussion
A national DICOM data bank has been clinically operating in Denmark since 2010 [Citation17]. In the current study it is shown that the obtainable data quality of such a data bank exceeds the quality of manual reporting used previously. The number of detected assignment errors in the data bank was related to two patients who were given an electron boost, which was not documented in the data bank, since the boost dose was not calculated in the local treatment planning system but was based on a manual calculation. These two assignment errors correspond to an error rate of 0.1% which is much lower than the error rate observed for the manual reported values.
The fraction of extreme outliers was approximately 10% for a large number of the reported parameters. This might initially seem very high but a mistake in typing all the digits correctly is likely to result in an extreme outlier, in particular if it is one of the first digits which are mistyped. The value of 10% is thus probably a reflection of the error rate most people have in typing numbers into a computer system. Some of the obviously mistyped and in particular missing manual data could have been correct if a detailed inspection of the manual data had been performed by cross linking to other information such as randomization, pathology, size of resection margin and age of patient. However, most of the parameters related to delivered dose would probably be very difficult to locate during a validation based only on manual data.
The high level of data quality of the data bank is of course positive and provides a solid basis for future retrospective studies. But probably more importantly, data banks can be the basis for international data trials, either based on centralized data or by using distributed learning methods, as suggested by Skripcak et al. [Citation3], which reduces the legal issues related to the exchange of data between different countries. The data bank can thus be used as the backbone in a number of international studies using, e.g., deep learning methods if the users choose to do so. Whether the current results can be extrapolated to other radiotherapy DICOM data banks can be debated. However, DBCG do have a long lasting tradition of clinical trials and the DICOM standard is an international accepted standard, thus it seems likely that comparisons between other data banks and manually data would not result in deviations significantly smaller than those in the current study.
All transmissions of DICOM data from the individual institutions to the data bank were performed on secure lines administered by the Danish national health system. One of the main problems in collecting treatment data is related to legal issues of privacy. It is therefore important that all transmissions of patient sensitive information are performed on secure lines, where all data transmissions are encrypted and the sender can validate the identity of the receiver. A common pitfall for people setting up quick data exchange between institutions is to use transmission protocols not design with security in mind (e.g., FTP), without encapsulating all network transmissions in a secure way. It should thus be stressed that it is important to spend quite some resources in designing a data bank such that confidentiality of the data is ensured at all times.
Even though the data quality of the data bank system seems superior, there are a number of challenges compared to the manual system – challenges which all data bank systems need to address. The first is related to exporting data from the participating institutions to the data bank, which is not a part of the clinical routine and often a manual step, thus data might not have been exported at all. Since the data bank does not have any additional knowledge about the number of expected patients, large numbers of treatment plans might be missing. The second challenge is that data has to be assigned to one or more trials in the data bank system, in order to allow access for other institutions. Such an assignment is needed in all data bank systems except if they are designed for a single clinical trial. However, this issue is to some degree a technical problem, and in the data bank in this study the users currently have to supply the additional information using the web interface. Unfortunately, many users find this additional step confusing when using the data bank. Also the naming of structures which may be performed manually in the local treatment planning system is an important issue. There are international recommendations for the naming of structures [Citation18–20], and it can be strongly recommended to follow these, or maybe even more importantly to use ‘scripts’ in the local treatment planning systems to ensure local consistency of structure names, since that is central for a correct structure mapping in data banks. An additional approach could be to implement automatic structure recognition methods in data banks as proposed by McIntosh et al. [Citation21], demonstrating an accuracy of 92% and therefore could be useful in pin-pointing incorrect structure mappings.
Due to the manual processes related to data banks, there are multiple causes that can result in the presence of incorrect data in data banks. Data validation is needed to ensure that all data has been submitted and to obtain a high level of data quality. The current data bank uses data from the treatment planning systems which can differ from the data in the record and verify system. An example of this was detected during the initial validation of the data bank values where a nonstandard boost was detected - prescribed in the treatment planning system as 2 Gy in 10 fractions and not 5 fractions. The correct boost had been delivered, but the fractionation error was only corrected in the record and verify system. There is therefore a need to invest time to develop computer programs for the specific clinical trials to check the integrity of the data. The specific amount of time needed is difficult to estimate, but a data bank reporting system does not necessarily mean less manual work in the end, but it does provide a lot more opportunities to automate and apply new technologies to data and answer new questions. There is definitely a need for allocation of human resources if a data bank should be in clinical operation for a large number of clinical trials. The needed resources obvious depend on the actual data bank implementation, but even for the most automated systems it is likely that a least one full time position is needed to support customers, validate data quality, and perform bug-fix/development.
In summary the data bank was superior to manually reported values in terms of data quality. This study therefore provides a sound technical basis for transitioning future DBCG RT trials and studies to the national radiotherapy data bank. All the errors detected in this study regarding the manual reporting to the DBCG database in the DBCG hypo trial will obviously be corrected. But potentially more important data banks contain more detailed information. Thus, new relevant values may in the future be extracted from the submitted dose plan data compared to the limited number of predefined values reported manually.
Carsten_Brink_et_al._Supplementary_material.zip
Download Zip (1.9 MB)Acknowledgments
This work is supported by CIRRO – The Lundbeck FoundationCenter for Interventional Research in Radiation Oncology and by The Danish Council for Strategic Research. BVO also acknowledge supported by the Danish Cancer Society. CB, ELL, SLK, and JW acknowledge support from AgeCare (Academy of Geriatric Cancer Research), an international research collaboration based at Odense University Hospital, Denmark.
Disclosure statement
No potential conflict of interest was reported by the authors.
References
- Roelofs E, Persoon L, Nijsten S, et al. Benefits of a clinical data warehouse with data mining tools to collect data for a radiotherapy trial. Radiother Oncol. 2013;108:174–179.
- Roelofs E, Persoon L, Qamhiyeh S, et al. Design of and technical challenges involved in a framework for multicentric radiotherapy treatment planning studies. Radiother Oncol. 2010;97:567–571.
- Skripcak T, Belka C, Bosch W, et al. Creating a data exchange strategy for radiotherapy research: Towards federated databases and anonymised public datasets. Radiother Oncol. 2014;113:303–309.
- Fairchild A, Aird E, Fenton PA, et al. Eortc radiation oncology group quality assurance platform: establishment of a digital central review facility. Radiother Oncol. 2012;103:279–286.
- Källman HE, Halsius E, Olsson M, et al. Dicom metadata repository for technical information in digital medical images. Acta Oncol. 2009;48:285–288.
- Laprise NK, Hanusik R, Fitzgerald TJ, et al. Developing a multi-institutional PACS archive and designing processes to manage the shift from a film to a digital-based archive. J Digit Imaging. 2009;22:15–24.
- Roelofs E, Dekker A, Meldolesi E, et al. International data-sharing for radiotherapy research: an open-source based infrastructure for multicentric clinical data mining. Radiother Oncol. 2014;110:370–374.
- Westberg J, Krogh S, Brink C, et al. A DICOM based radiotherapy plan database for research collaboration and reporting. J Phys: Conf Ser. 2014;489:012100.
- Zukauskaite R, Hansen CR, Brink C, et al. Analysis of CT-verified loco-regional recurrences after definitive IMRT for HNSCC using site of origin estimation methods. Acta Oncol. 2017;56:1554–1561.
- Møller DS, Nielsen TB, Brink C, et al. Heterogeneous FDG-guided dose-escalation for locally advanced NSCLC (the NARLAL2 trial): design and early dosimetric results of a randomized, multi-centre phase-III study. Radiother Oncol. 2017;124:311–317.
- Hansen O, Knap MM, Khalil A, et al. A randomized phase II trial of concurrent chemoradiation with two doses of radiotherapy, 60Gy and 66Gy, concomitant with a fixed dose of oral vinorelbine in locally advanced NSCLC. Radiother Oncol. 2017;123:276–281.
- Pan Y, Brink C, Knap M, et al. Acute esophagitis for patients with local-regional advanced non small cell lung cancer treated with concurrent chemoradiotherapy. Radiother Oncol. 2016;118:465–470.
- Rønjom MF, Brink C, Bentzen SM, et al. External validation of a normal tissue complication probability model for radiation-induced hypothyroidism in an independent cohort. Acta Oncol. 2015;54:1301–1309.
- Mouridsen H, Christiansen P, Jensen MB, et al. Provision of data from the clinical database and of biological material from the tumour bank of the danish breast cancer cooperative group 2008–2017. Submitted for Acta Oncol. 2017.
- Dawson R. How significant is a boxplot outlier? J Stat Educ. 2011;19:1–13.
- ICRU Report 83. Prescribing, Recording, and Reporting Photon-Beam IMRT. Technical report, International commission on radiation units and measurements, 7010 Woodmont Avenue Bethesda, Maryland 20814 U.S.A, 2010.
- Westberg J, Jensen HR, Bertelsen A, et al. Reduction of Cone-beam CT scan time without compromising the accuracy of the image registration in IGRT. Acta Oncol. 2010;49:225–229.
- Santanam L, Hurkmans C, Mutic S, et al. Standardizing naming conventions in radiation oncology. Int J Radiat Oncol Biol Phys. 2012;83:1344–1349.
- Nyholm T, Olsson C, Agrup M, et al. A national approach for automated collection of standardized and population-based radiation therapy data in Sweden. Radiother Oncol. 2016;119:344–350.
- Denton TR, Shields LBE, Hahl M, et al. Guidelines for treatment naming in radiation oncology. J Appl Clin Med Phys. 2016;17:123–138.
- McIntosh C, Svistoun I, Purdie TG. Groupwise conditional random forests for automatic shape classification and contour quality assessment in radiotherapy planning. IEEE Trans Med Imaging. 2013;32:1043–1057.