
 ?Mathematical formulae have been encoded as MathML and are displayed in this HTML version using MathJax in order to improve their display. Uncheck the box to turn MathJax off. This feature requires Javascript. Click on a formula to zoom.
Abstract
Background
Analyses of clinical outcomes following radiotherapy (RT) have advanced our understanding of fundamental radiobiological characteristics in head and neck squamous cell carcinoma (HNSCC). Low fractionation sensitivity appears to be a common feature, as well as susceptibility to changes in overall treatment time (OTT). Large tumors should be harder to cure if a successful RT requires the sterilization of all clonogenic cells. Congruently, primary tumor volume has proven to be an important parameter. However, most findings come from an era when p16-negative HNSCC was the dominant tumor type. HPV-associated, p16-positive, oropharyngeal tumors (OPSCC) are more radiosensitive and have better outcome. The current study aims to investigate the role of primary tumor volume, OTT and estimate α-ratio for p16-positive OPSCC, and to quantify the differences in radiosensitivity depending on p16-status.
Methods
A cohort of 523 patients treated with RT was studied using a tumor control probability (TCP)-model that incorporates primary tumor volume (V) raised to an exponent c, OTT and α-estimation. The significance of V was also investigated in Cox-regression models.
Results
In the p16-positive cohort (n = 433), the volume exponent was 1.44 (95%CI 1.06–1.91), compared to 0.90 (0.54–1.32) for p16-negative tumors (n = 90). Hazard ratios per tumor volume doubling were 2.37 (1.72–3.28) and 1.83 (1.28–2.62) for p16-positive and p16-negative, respectively. The estimated α
-ratio was 9.7 Gy (−2.3–21.6), and a non-significant daily loss of 0.30 Gy (−0.17–0.92) was found. An additional dose of 6.8 Gy (interquartile range 4.8-9.1) may theoretically counteract the more radioresistant behavior of p16-negative tumors.
Conclusion
Primary tumor volume plays a crucial role in predicting local tumor response, particularly in p16-positive OPSCC. The estimated α/β-ratio for p16-positive oropharyngeal tumors aligns with previous HNSCC studies, whereas the impact of prolonged OTT was slightly less than previously reported. The differences in radiosensitivity depending on p16-status were quantified. The findings should be validated in independent cohorts.
Background
In classical radiobiological target theory, the number of clonogenic tumor cells provides a key parameter for predicting tumor response [Citation1]. It is assumed that cure probability is determined solely by the number of surviving cells after radiotherapy (RT), making the number of initial tumor cells of utmost importance. In clinical cohorts of head and neck squamous cell carcinoma (HNSCC) patients, it has been shown that the outcome is dependent on tumor volume [Citation2–4]. Some studies have incorporated tumor volume in mathematical tumor control probability (TCP)-models and have quantitatively determined its impact. In a cohort of 51 patients, Johnsson et al. estimated the number of clonogenic cells to be proportional to tumor volume raised to the power of 0.85[Citation5]. Brenner obtained similar results and suggested that the number of cells to be sterilized is directly proportional to the tumor volume (i.e., tumor volume raised to the power of 1) [Citation5]. A much weaker volume dependence was proposed by Bentzen et al. who estimated an increase in tumor cells by the square root of the tumor volume [Citation6].
The linear-quadratic model (LQ-model) offers a clinically useful method for comparing fractionation schedules and predicting radiation responses [Citation7] For HNSCC, an α/β-ratio of 10 Gy is often assumed [Citation8] Considering the relatively high α/β-estimate, HNSCC has not been the subject of hypo-fractionation trials, which instead have proven successful in breast and prostate cancer with lower α/β-estimates [Citation9, Citation10] Instead, previous trials in HNSCC have investigated hyper-fractionation to exploit the radiobiological difference between tumor and normal tissue [Citation11–14]. In a meta-analysis, hypofractionation was found to increase overall survival by 8.1% at 5 years [Citation15]. Additionally, accelerated fractionation to counter-act the negative impact of tumor proliferation during treatment, has received much attention in HNSCC [Citation16–18]. For rapidly proliferating tumors, it should be beneficial to shorten the overall treatment time (OTT) without exceeding the normal tissue tolerance [Citation19]. Numerous trials have investigated the shortening of OTT [Citation20–23], and in a meta-analysis accelerated treatment was shown to increase overall survival with 2.2% at 5 years [Citation15].
However, data in most of these studies originate from an era when p16-negative HNSCC was the predominant tumor type. In the last decades the disease panorama has changed. Human papillomavirus (HPV) associated tumors, with p16-positivity as a surrogate marker, represent a distinct tumor type in the oropharynx, occurring in typically younger patients with less co-morbidities, with increasing incidence predominantly in developed countries [Citation24]. The p16-positive tumors appear to be more radiosensitive and have a substantially better prognosis compared to p16-negative tumors[Citation25]. The more radiosensitive phenotype could possibly reflect a different underlying radiobiology. Thereby, findings from p16-negative cohorts of α/β-ratio, importance of tumor volume and OTT may not necessarily apply to p16-positive patients.
In the present study our primary objective was to assess the importance of tumor volume in p16-positive and p16-negative oropharyngeal squamous cell carcinoma (OPSCC). Additionally, we aimed to investigate OTT, estimate the α/β-ratio, and quantify the difference in radiosensitivity between p16-positive and p16-negative OPSCC.
Methods
Cohort
The study cohort has been presented previously [Citation4]. In brief, the cohort consists of 523 patients with OPSCC who were treated with curative RT, including 433 p16-positive and 90 p16-negative individuals. Primary tumor volume (GTV-T) was determined by the treating physician and delineated on computed tomography images. Three different fractionation schedules were used to treat the primary tumor: 68.0 Gy in 34 fractions, 68.0 Gy in 43 fractions (1.1 + 2.0 Gy/day) or 73.1 Gy in 34 fractions, with OTT of median 46, 31 and 47 days, respectively (Supplementary Figure 1), using 3D conformal or intensity-modulated RT. In the present study, treatment failure refers to failure within the treated primary tumor volume (i.e., at T-site). For the TCP model, failure was defined as failure within three years.
Tumor control probability model
First, we analyzed the data in a traditional target theory model. Assuming a Poisson dose-response model, TCP is defined as:
where
the number of surviving clonogenic tumor cells after RT, is determined by the initial number of clonogenic cells,
and the surviving fraction,
:
where
can be expressed as
Here, is a proportionality constant,
is the primary tumor volume raised to the power of
representing the importance of tumor volume. Thus
Assuming the same treatment for all patients, the expression could be simplified to
(Equation 1)
(Equation 1)
According to the LQ-model, the surviving fraction for a single irradiation is given by:
where
and
are constants and
denotes the irradiation dose. For multiple irradiations with
fractions, the surviving fraction becomes:
Prolonging the overall treatment time ) might counteract the treatment efficacy and could be incorporated in the model according to:
where γ is a constant. The full TCP-expression for treatment schedules with
daily fractions of
Gray, and for the part of the cohort receiving twice daily irradiation (
and
respectively) assuming full sublethal damage repair in between the fractions, can be expressed as:
(Equation 2)
(Equation 2)
The parameters were fitted for different values of
using a non-linear least square method separately for the p16-positive and p16-negative cohort. The value of
resulting in the lowest residual sum of squares was regarded as the best fit for the data. The
-value was converted to a daily loss in Gy by calculating the additional number,
of 2 Gy fractions needed for compensation,
(Equation 3)
(Equation 3)
Based on the parameters in Equation 2, outcome predictions were estimated for individual patients. To illustrate the difference between p16-positive and p16-negative tumors, predictions were made for fictive patients with a primary tumor volume of 0-100 cm3, receiving RT of 68.0 Gy in 34 fractions over 47 days. The additional dose that a p16-negative tumor would require to have the same theoretical chance of cure as an equally large p16-positive tumor was estimated by defining:
by re-arranging Equation 2, assuming the same treatment schedule as above, and omitting the difference in OTT, the expression becomes:
(Equation 4)
(Equation 4)
Cox regression analyses
In addition to the TCP model, the Cox-regression approach incorporates a time-to-event dimension. To allow a clinically relevant interpretation of the Cox-Regression-estimate, we performed a log2 -transformation of the GTV-T volume and analyzed it as a continuous variable. Thereby, the estimate corresponds to the increased risk of local failure per tumor volume doubling.
Statistical analyses
In the Cox-Regression analyses, log2-GTV-T and age were analyzed as continuous variables. Hemoglobin (Hb) was dichotomized at 130 g/dL based on a previous receiver-operator-characteristics analysis of the cohort [Citation4]. Performance status was dichotomized (WHO ≥1/Karnofsky ≤80 vs. better), and smoking was categorized according to former/present smoker vs. never-smoker. Proportional hazard assumptions were tested with Schönfeld residual tests. The Cox-Regression analyses were conducted according to the complete-case principle; hence, patients with missing values were omitted from the analysis. In the TCP model, local failures within 3 years were regarded as events. P-values <0.05 were considered statistically significant. Bootstrapping was used to determine the confidence interval for Ap16+ and Ap16-. Comparisons of non-parametric data between groups were analyzed by the Wilcoxon rank sum test. All analyses were performed in R using the libraries survival, survminer and minpack.lm.
Results
An overview of the cohort is presented in Supplementary table 1. There were 36 patients with p16-positive tumors and 26 patients with p16-negative tumors experiencing a local failure. Primary tumor volume was significantly smaller for patients with p16-positive tumors (median 12.8 cm3 vs. 20.2 cm3, p < 0.001), whereas the nodal tumor volume was significantly larger for patients with p16-positive tumors (median 12.7 cm3 vs. 7.8 cm3, p = 0.001).
TCP-models
In the p16-positive cohort, the simplest TCP model (Equation 1) assuming the same treatment for all patients, estimated the volume exponent to 1.32 (95% confidence interval [CI] 0.91–1.73). Inclusion of the fractionation schedules and individual OTT allowed a more detailed analysis, including determination of the
- and
-values. The analysis according to Equation 2 was iterated for different values of
with the best fit resulting in an
/
-ratio of 9.7 Gy ( and ). As illustrated, the volume exponent
was not affected by changes in the
-value, consistently falling within the range of 1.4–1.5. The
-value corresponds to a daily loss of 0.30 Gy (95%CI −0.17 – 0.92) if the treatment was delivered with 2.0 Gy/fraction (Equation 3).
Figure 1. Fit of the TCP-model parameters (red, dotted line),
(
-ratio, solid black line),
(blue, dashed line) in Equation 2 for different values of A (x-axis). Green line denotes the residual sum of squares from the fit. In (a) the p16-cohort of 433 patients and in (b) the corresponding p16-negative cohort of 90 patients (with a fixed
-ratio).
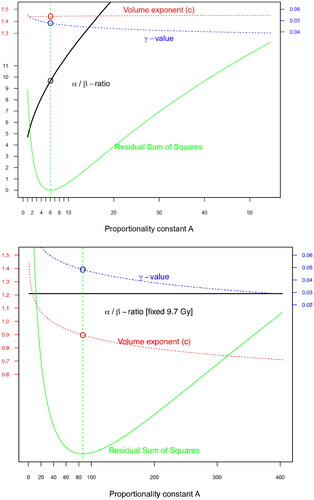
Table 1. Fitted parameters in Equation 2.
In the p16-negative cohort, the smaller number of patients limited the number of parameters that could be included in the model (Equation 2). Therefore, a fixed /
-ratio of 9.7 Gy was used ( and ). In the model, the radioresistant phenotype of p16-negative tumors was reflected in the proportionality constant
The parameters determined for the p16-positive and p16-negative cohorts were used to predict outcomes for the patients using Equation 2 ().
Figure 2. Estimated probability of local failure using the TCP-model in Equation 2, incorporating primary tumor volume (x-axis), fractionation schedule (black, red and blue) and overall treatment time for the individual patients. Model predictions for p16-negative (darkgreen dotted lines) and p16-positive (dashed line) tumors treated with 68.0 Gy/34 fractions over 47 days are shown, as well as outcome for the actual patients (p16-positive tumor without failure (+), p16-positive tumor with failure (triangles), p16-negative tumor without failure (empty circles), p16-negative tumor with failure (filled circles)). horizontal bars denote the proportion of patients with failure, grouped per 20 cm3, with 95% confidence interval (vertical lines) for p16-positive (black, longer bars, filled error lines) and p16-negative (darkgreen, shorter bars, dot-dashed lines).
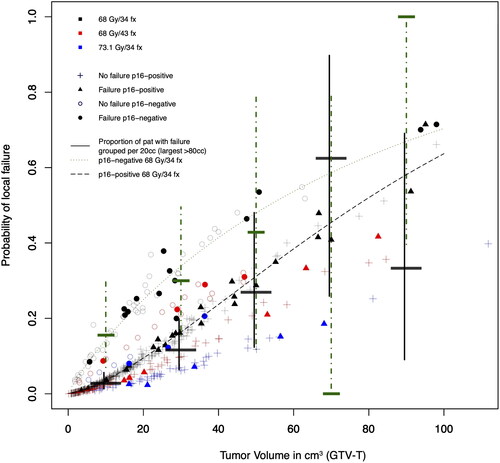
Next, we wanted to quantify the difference in radiosensitivity depending on p16-status. Based on the size of the primary tumor volume in individual patients with p16-negative tumors, the additional dose required to compensate for the radioresistant phenotype to achieve the same estimated probability as a corresponding p16-positive tumor was calculated (Equation 4). The calculations indicated that an additional dose of median 6.8 Gy (interquartile range 4.8–9.1) would theoretically give a p16-negative tumor the same chance of cure as a p16-positive tumor.
Cox regressions
In univariable Cox-regression analysis, the hazard ratio (HR) of local failure per tumor volume doubling for p16-positive and p16-negative patients was 2.5 (95%CI 1.9–3.4) and 1.9 (95%CI 1.3–2.7), respectively (Supplementary Table 2). Multivariable analyses including performance status and smoking status yielded similar results (). These results indicate that the risk of local failure doubles when the tumor volume doubles.
Table 2. Multivariable Cox-Regression for patients with p16-positive and p16-negative tumors. Primary tumor volume (GTV-T) was log2-transformed and included as continuous parameter.
Discussion
The results of our study support the radiobiological concept of clonogenic tumor cells, and that primary tumor volume is a key predictor of local tumor response. The importance of primary tumor volume is more pronounced in patients with p16-positive compared to those with p16-negative tumors. The estimated α-ratio for p16-positive oropharyngeal tumors is comparable to previous results of HNSCC in general [Citation8]. The models predict that an additional dose of 6.8 Gy is needed to compensate for the radioresistant p16-negative phenotype. The impact of prolonging overall treatment time was lower than previously reported. [Citation16]
Primary tumor volume has a major impact on local control in the current study. The estimate of the volume exponent c in the p16-positive cohort indicates that the number of clonogenic cells increases at least proportionally to the tumor volume, and possibly even more. Likewise, the Cox-Regression of log2(tumor volume) is > 2 for the p16-positive cohort, indicating that the risk of local failure at least doubles with each tumor volume doubling. Both the TCP model and the Cox regression model demonstrate a stronger impact of tumor volume for p16-positive compared to p16-negative tumors and previous studies. In a TCP model for head and neck cancer by Bentzen et al. the corresponding c-value was estimated to be 0.27 in a cohort of 181 OPSCC patients [Citation6]. Using a somewhat different approach, Brenner studied four clinical datasets and found that the assumption of proportionality between clonogenic cells and tumor volume (i.e., assuming c = 1) was consistent with the data [Citation5]. For head and neck cancer, Johnson et al. used a TCP model according to Equation 1 for 51 patients [Citation26]. Without incorporating overall treatment time or alpha/beta-estimations and assuming the same treatment for all patients, they found a volume exponent c of 0.85 (95%CI 0.40–1.29) for the primary tumor. Presumably, a large proportion of the patients had p16-negative tumors, and the estimate is thereby well in line with the current findings. Using Cox-Regression analyses, several previous studies report the impact of tumor volume. Some studies report significant HR for dichotomized groups [Citation2, Citation27, Citation28], while others use tumor volume as a continuous parameter [Citation29–31]. Although there are some varying results [Citation32–34], there is substantial evidence supporting tumor volume as a fundamental prognosticator. The more pronounced impact of tumor volume in p16-positive tumors compared with p16-negative tumors in the present study contrasts with previous reports [Citation35]. Carpén et al. investigated a cohort of 72 patients with p16 positive and 19 patients with p16-negative OPSCC and found a significant impact of primary tumor volume in overall survival only for p16-negative patients [Citation36]. Davis et al. found no impact of primary tumor volume for disease-free survival in a cohort of 53 patients with p16-positive tumors [Citation32]. Consistent with our present findings a recent study investigated the risk of distant metastases, and found a higher impact of tumor volume in p16-positive patients compared with p16-negative patients [Citation37]. When analyzing tumor volume for p16-positive and p16-negative patients, it should be noted that the relationship between primary and nodal tumor volume differs. In our cohort, patients with p16-positive tumors had significantly smaller primary tumor volume, and significantly larger nodal volume compared to patients with p16-negative tumors. Moreover, cystic nodal metastases are more common in p16-positive tumors [Citation38]. Previous studies have shown differences in radiation response at the nodal site compared with the primary site [Citation12, Citation23]. Therefore analyses using total tumor volume (i.e., the sum of primary and nodal tumor volume) in cohorts of patients with mixed p16-status [Citation37, Citation39] might potentially affect the results.
Other biomarkers may provide additional prognostication besides tumor volume. As displays, p16-status seems to shift the two curves along the y-axis, illustrating its prognostic utility. However, both curves have a considerable slope, emphasizing the importance of considering p16-status together with tumor volume. There are indications that other markers may also be associated with tumor volume. Linge et al. found a significant interaction between hypoxic gene profiles and tumor volume, where the gene profile only provided prognostic value in small tumors [Citation39].
Smoking is a risk factor for developing HNSCC [Citation40]. Individuals with more than 10 pack-years who develop a p16-positive tumor have a significantly worse prognosis compared to nonsmokers [Citation25]. Moreover, smoking has been shown to affect the outcome of RT, regardless of p16-status [Citation41]. In our current analysis, only a statistically non-significant trend of increased risk of local failure was found. A recent study suggests that the time since cessation affects the impact of pack years [Citation42]. Unfortunately, neither pack-years nor time since cessation was available in the present cohort.
The present estimates of c = 1.44 and HR 2.4 (p16-positive tumors) suggest that the negative factors associated with large tumor volumes increase by more than a factor of one. In a recent study, we analyzed 323 HNSCC patients examined with hypoxia-PET [Citation43]. The hypoxic fraction was found to increase with tumor volume, i.e., the proportion of hypoxic cells was higher in larger tumors. Since hypoxia confers radioresistance, this phenomenon could partly explain the current findings.
The current results indicate that p16-positive tumors are not particularly sensitive to changes in fractionation size, well in line with previous α-estimates for HNSCC in general [Citation8, Citation44, Citation45]. In the current cohort, only the α-term was found to be significant, further indicating a low sensitivity to changes in fractionation size. Estimations of α
-ratio are highly influenced by the model used and the inclusion of co-varying factors. Suwinski et al. found that omitting OTT yielded a lower estimate of α
-ratio in their cohort of rectal cancer [Citation46]. In the present cohort, overall treatment time and fractionation size are also interrelated. Since fraction doses of 1.1 + 2.0 Gy (total dose 68.0 Gy) were used for the patients with the shortest OTT, comparisons with a 2.0 Gy-daily schedule to 68.0 Gy result in negative
-values and, hence, negative α
-ratio if OTT is omitted (Supplementary Figure 3). Therefore, the current result should be interpreted cautiously, as the different fractionation schedules were few and linked to variations in OTT.
Overall treatment time has been thoroughly studied for HNSCC. The present TCP model indicates, although not statistically significant, that 0.3 Gy is needed to counteract the negative effect on tumor control caused by a one-day’s prolongation of OTT. Previous estimates suggest a slightly larger loss, 0.5–0.7 Gy/day [Citation16, Citation17, Citation44]. On the other hand, the CHART trial showed maintained locoregional control with a 12 Gy reduction in total dose and a shortening of OTT by 33 days [Citation47]. Without considering the reduction in fraction dose, this could be interpreted as the time factor being 0.36 Gy/day. It has been suggested that OTT affects outcomes differently depending on tumor differentiation, with the benefit of shortened OTT only for moderately and well-differentiated tumors [Citation47, Citation48]. Further, OTT seems to primarily affect tumor response at the T-site, but not the response at the N-site [Citation23]. In preclinical models the magnitude of the time factor was cell-line dependent [Citation49]. Thereby, the impact of OTT may be heterogenous and related to factors not included in the present study. We found no difference in the magnitude of the time factor depending on p16-status. This is also supported by the DAHANCA 6/7 trials where moderately accelerated treatment improved outcomes for both p16-positive and p16-negative patients [Citation50]. According to some studies, tumor proliferation does not occur at a constant pace during RT. Withers et al. published an analysis based on nearly 500 OPSCC patients and suggested that rapid re-population after a certain “kickoff time” was a significant determinant for outcome [Citation51]. Later, Dubben re-analyzed the same data set and found conflicting results [Citation52]. Preclinical studies indicate a biphasic repopulation, congruent with accelerated re-population after a kickoff-time [Citation53]. Similarly, retrospective analyses of clinical results suggest that treatment gaps occurring after more than two weeks affected outcomes to a higher degree compared with treatment gaps earlier during treatment [Citation54]. In the present data set, the TCP model could neither confirm nor refute the existence of a specific kickoff time before potential accelerated re-population begins (Supplementary Figure 4).
The different response of p16-positive and p16-negative tumors was parametrized in the current study. According to the model, an additional dose of a median 6.8 Gy would be needed to account for the radioresistant p16-negative phenotype. It should be noted that this is a purely theoretical estimate, predicted by the model using the fitted values from the TCP model. In the MARCH database, analyzing altered fractionation for HNSCC, no interaction between fractionation schedules and p16-status was found [Citation55]. It should be noted that patients with p16-negative tumors generally have a worse prognosis, with a higher incidence of secondary cancers and deaths from other causes [Citation56]. The potential gain of escalated treatments for p16-negative tumors is purely theoretical and should be carefully balanced against increased risk of treatment-related side effects which is not investigated in the present study.
The current study has several limitations and weaknesses. Firstly, the analyses are solely based on tumor response at the T-site and do not take the N-site into account, which may hamper its clinical relevance. The estimation of α-ratio is based on only three fractionation schedules. Future studies with larger variations in fractionation schedules are needed to confirm the results. Moreover, the estimated impact of OTT relies on the efficacy obtained by the accelerated schedule using 43 fractions. It cannot be ruled out that the efficacy assigned to the OTT to part is caused by other interrelated parameters, i.e., the use of twice daily irradiations. It is possible that an incomplete sublethal damage recovery between the intra-daily fractions would yield a similar response pattern. We also lack information about tumor differentiation, which previously has been shown to affect OTT analyses. [Citation48] The study does not take the efficacy obtained with concomitant chemotherapy into account. Lastly, the differential effect for intensified treatment schedules between small and large tumors [Citation12, Citation27, Citation57] is not explained by the present TCP model.
To conclude, the present study supports the radiobiological significance of considering primary tumor volume as an essential parameter for local control. p16-positive tumors have an -estimate comparable to other HNSCC, and prolonging OTT may impair outcome. Moreover, we quantified the difference in radiosensitivity between p16-positive and p16-negative tumors. Validation of these findings in other independent cohorts is necessary. Predictions by the TCP model could be used to identify patients with a high risk of local failure and guide the intensification of treatment in future clinical trials.
Data availibility statement
Research data are not available at this time.
Supplemental Material
Download MS Word (241.1 KB)Acknowledgements
The authors are most grateful for the generous sharing of data from the ARTSCAN trial [Citation22] by Professor Björn Zackrisson, Department of Radiation Sciences, Oncology, Umeå University, Umeå, Sweden, and from the perspective PET-trial [Citation58] by MD PhD Johanna Sjövall, Department of Otorhinolaryngology – Head and Neck Surgery, Skåne University Hospital, Lund University, Lund, Sweden.
Disclosure statement
No potential conflict of interest was reported by the author(s)
Additional information
Funding
References
- Munro TR, Gilbert CW. The relation between tumour lethal doses and the radiosensitivity of tumour cells. Br J Radiol. 1961;34(400):246–251. doi: 10.1259/0007-1285-34-400-246.
- Lok BH, Setton J, Caria N, et al. Intensity-modulated radiation therapy in oropharyngeal carcinoma: effect of tumor volume on clinical outcomes. Int J Radiat Oncol Biol Phys. 2012;82(5):1851–1857. doi: 10.1016/j.ijrobp.2011.03.029.
- Chao KSC, Ozyigit G, Blanco AI, et al. Intensity-modulated radiation therapy for oropharyngeal carcinoma: impact of tumor volume. Int J Radiat Oncol Biol Phys. 2004;59(1):43–50. doi: 10.1016/j.ijrobp.2003.08.004.
- Adrian G, Carlsson H, Kjellén E, et al. Primary tumor volume and prognosis for patients with p16-positive and p16-negative oropharyngeal squamous cell carcinoma treated with radiation therapy. Radiat Oncol. 2022;17(1):107. doi: 10.1186/s13014-022-02074-7.
- Brenner DJ. Dose, volume, and tumor-control predictions in radiotherapy. Int J Radiat Oncol Biol Phys. 1993;26(1):171–179. doi: 10.1016/0360-3016(93)90189-3.
- Bentzen SM, Johansen LV, Overgaard J, et al. Clinical radiobiology of squamous cell carcinoma of the oropharynx. Primary tumor volume and prognosis for patients with p16-positive and p16-negative oropharyngeal squamous cell carcinoma treated with radiation therapy. Int J Radiat Oncol Biol Phys. 1991;20:1197–1206. doi: 10.1016/0360-3016(91)90228-v.
- McMahon SJ. The linear quadratic model: usage, interpretation and challenges. Phys Med Biol. 2018;64(1):01TR01. doi: 10.1088/1361-6560/aaf26a.
- van Leeuwen CM, Oei AL, Crezee J, et al. The alfa and beta of tumours: a review of parameters of the linear-quadratic model, derived from clinical radiotherapy studies. Radiat Oncol. 2018;13(1):96. doi: 10.1186/s13014-018-1040-z.
- Widmark A, Gunnlaugsson A, Beckman L, et al. Ultra-hypofractionated versus conventionally fractionated radiotherapy for prostate cancer: 5-year outcomes of the HYPO-RT-PC randomised, non-inferiority, phase 3 trial. Lancet. 2019;6736:1–11.
- Murray Brunt A, Haviland JS, Wheatley DA, et al. Hypofractionated breast radiotherapy for 1 week versus 3 weeks (FAST-Forward): 5-year efficacy and late normal tissue effects results from a multicentre, non-inferiority, randomised, phase 3 trial. Lancet. 2020;395(10237):1613–1626. doi: 10.1016/S0140-6736(20)30932-6.
- You R, Liu YY-L, Xie Y-L, et al. Hyperfractionation compared with standard fractionation in intensity-modulated radiotherapy for patients with locally advanced recurrent nasopharyngeal carcinoma: a multicentre, randomised, open-label, phase 3 trial. Lancet. 2023;6736:1–11.
- Horiot JC, Le Fur R, N’Guyen T, et al. Hyperfractionation versus conventional fractionation in oropharyngeal carcinoma: final analysis of a randomized trial of the EORTC cooperative group of radiotherapy. Radiother Oncol. 1992;25(4):231–241. doi: 10.1016/0167-8140(92)90242-m.
- Pinto LH, Canary PC, Araújo CM, et al. Prospective randomized trial comparing hyperfractionated versus conventional radiotherapy in stages III and IV oropharyngeal carcinoma. Int J Radiat Oncol Biol Phys. 1991;21(3):557–562. doi: 10.1016/0360-3016(91)90670-y.
- Beitler JJ, Zhang Q, Fu KK, et al. Final results of local-regional control and late toxicity of rtog 9003: a randomized trial of altered fractionation radiation for locally advanced head and neck cancer. Int J Radiat Oncol Biol Phys. 2014;89(1):13–20. doi: 10.1016/j.ijrobp.2013.12.027.
- Lacas B, Bourhis J, Overgaard J, et al. Role of radiotherapy fractionation in head and neck cancers (MARCH): an updated meta-analysis. Lancet Oncol. 2017;18(9):1221–1237. doi: 10.1016/S1470-2045(17)30458-8.
- Withers HR, Peters LJ, Taylor JMG, et al. Local control of carcinoma of the tonsil by radiation therapy: an analysis of patterns of fractionation in nine institutions. Int J Radiat Oncol Biol Phys. 1995;33(3):549–562. doi: 10.1016/0360-3016(95)00228-Q.
- Bentzen SM, Thames HD. Clinical evidence for tumor clonogen regeneration: interpretations of the data. Radiother Oncol. 1991;22(3):161–166. doi: 10.1016/0167-8140(91)90019-d.
- Fowler JF, Lindstrom MJ. Loss of local control with prolongation in radiotherapy. Int J Radiat Oncol Biol Phys. 1992;23(2):457–467. doi: 10.1016/0360-3016(92)90768-d.
- Skladowski K, Maciejewski B, Golen M, et al. Continuous accelerated 7-days-a-week radiotherapy for head-and-neck cancer: long-term results of phase III clinical trial. Int J Radiat Oncol Biol Phys. 2006;66(3):706–713. doi: 10.1016/j.ijrobp.2006.05.026.
- Saunders M, Dische S, Barrett A, et al. Continuous, hyperfractionated, accelerated radiotherapy (CHART) versus conventional radiotherapy in non-small cell lung cancer: mature data from the randomised multicentre trial. Radiother Oncol. 1999;52(2):137–148. doi: 10.1016/s0167-8140(99)00087-0.
- Bourhis J, Lapeyre M, Tortochaux J, et al. Phase III randomized trial of very accelerated radiation therapy compared with conventional radiation therapy in squamous cell head and neck cancer: a GORTEC trial. J Clin Oncol. 2006;24(18):2873–2878. doi: 10.1200/JCO.2006.08.057.
- Zackrisson B, Kjellén E, Söderström K, et al. Mature results from a Swedish comparison study of conventional versus accelerated radiotherapy in head and neck squamous cell carcinoma - The ARTSCAN trial. Radiother Oncol. 2015;117(1):99–105. doi: 10.1016/j.radonc.2015.09.024.
- Overgaard J, Hansen HS, Specht L, et al. Five compared with six fractions per week of conventional radiotherapy of squamous-cell carcinoma of head and neck: DAHANCA 6 and 7 randomised controlled trial. Lancet. 2003;362(9388):933–940. doi: 10.1016/s0140-6736(03)14361-9.
- Chaturvedi AK, Anderson WF, Lortet-Tieulent J, et al. Worldwide trends in incidence rates for oral cavity and oropharyngeal cancers. J Clin Oncol. 2013;31(36):4550–4559. doi: 10.1200/JCO.2013.50.3870.
- Ang KK, Harris J, Wheeler R, et al. Human papillomavirus and survival of patients with oropharyngeal cancer. N Engl J Med. 2010;363(1):24–35. doi: 10.1056/NEJMoa0912217.
- Johnson CR, Thames HD, Huang DT, et al. The tumor volume and clonogen number relationship: tumor control predictions based upon tumor volume estimates derived from computed tomography. Int J Radiat Oncol Biol Phys. 1995;33(2):281–287. doi: 10.1016/0360-3016(95)00119-j.
- Adrian G, Gebre‐Medhin M, Kjellén E, et al. Altered fractionation diminishes importance of tumor volume in oropharyngeal cancer: subgroup analysis of ARTSCAN‐trial. Head Neck. 2020;42(8):2099–2105. doi: 10.1002/hed.26142.
- Strongin A, Yovino S, Taylor R, et al. Primary tumor volume is an important predictor of clinical outcomes among patients with locally advanced squamous cell cancer of the head and neck treated with definitive chemoradiotherapy. Int J Radiat Oncol Biol Phys. 2012;82(5):1823–1830. doi: 10.1016/j.ijrobp.2010.10.053.
- Panje C, Riesterer O, Glanzmann C, et al. Neutrophil-lymphocyte ratio complements volumetric staging as prognostic factor in patients treated with definitive radiotherapy for oropharyngeal cancer. BMC Cancer. 2017;17(1):643. doi: 10.1186/s12885-017-3590-0.
- Schüttrumpf L, Marschner S, Scheu K, et al. Definitive chemoradiotherapy in patients with squamous cell cancers of the head and neck - results from an unselected cohort of the clinical cooperation group “personalized radiotherapy in head and neck cancer. Radiat Oncol. 2020;15(1):7. doi: 10.1186/s13014-019-1452-4.
- Adrian G. Comment on Russo et al. Does tumor volume have a prognostic role in oropharyngeal squamous cell carcinoma? A systematic review and meta-analysis. Cancers. 2022;14(17):4283. doi: 10.3390/cancers14174283.
- Davis KS, Lim CM, Clump DA, et al. Tumor volume as a predictor of survival in human papillomavirus-positive oropharyngeal cancer. Head Neck. 2016;38(Suppl 1): e1613–7. doi: 10.1002/hed.24287.
- Nathu RM, Mancuso AA, Zhu TC, et al. The impact of primary tumor volume on local control for oropharyngeal squamous cell carcinoma treated with radiotherapy. Head Neck. 2000;22(1):1–5. doi: 10.1002/(SICI)1097-0347(200001)22:1<1::AID-HED1>3.0.CO;2-6.
- Hermans R, Op de Beeck K, Van den Bogaert W, et al. The relation of CT-determined tumor parameters and local and regional outcome of tonsillar cancer after definitive radiation treatment. Int J Radiat Oncol Biol Phys. 2001;50(1):37–45. doi: 10.1016/s0360-3016(00)01559-5.
- Mendenhall WM, Mancuso AA, Strojan P, et al. Impact of primary tumor volume on local control after definitive radiotherapy for head and neck cancer. Head Neck. 2014;36:1363–1367.
- Carpén T, Saarilahti K, Haglund C, et al. Tumor volume as a prognostic marker in p16-positive and p16-negative oropharyngeal cancer patients treated with definitive intensity-modulated radiotherapy. Strahlenther Onkol. 2018;194(8):759–770. doi: 10.1007/s00066-018-1309-z.
- Kjems J, Håkansson KE, Kristensen CA, et al. The influence of tumor volume on the risk of distant metastases in head and neck squamous cell carcinomas. Radiother Oncol. 2023;186:109771. doi: 10.1016/j.radonc.2023.109771.
- Huang YH, Yeh CH, Cheng NM, et al. Cystic nodal metastasis in patients with oropharyngeal squamous cell carcinoma receiving chemoradiotherapy: relationship with human papillomavirus status and failure patterns. PLOS One. 2017;12(7):e0180779. doi: 10.1371/journal.pone.0180779.
- Linge A, Lohaus F, Löck S, et al. HPV status, cancer stem cell marker expression, hypoxia gene signatures and tumour volume identify good prognosis subgroups in patients with HNSCC after primary radiochemotherapy: a multicentre retrospective study of the German cancer consortium radiation. Radiother Oncol. 2016;121(3):364–373. doi: 10.1016/j.radonc.2016.11.008.
- Hashibe M, Brennan P, Chuang SC, et al. Interaction between tobacco and alcohol use and the risk of head and neck cancer: pooled analysis in the international head and neck cancer epidemiology consortium. Cancer Epidemiol Biomarkers Prev. 2009;18(2):541–550. doi: 10.1158/1055-9965.EPI-08-0347.
- Grønhøj C, Jensen JS, Wagner S, et al. Impact on survival of tobacco smoking for cases with oropharyngeal squamous cell carcinoma and known human papillomavirus and p16-status: a multicenter retrospective study. Oncotarget. 2019;10(45):4655–4663. doi: 10.18632/oncotarget.27079.
- Broughman JR, Xiong DD, Moeller BJ, et al. Rethinking the 10-pack-year rule for favorable human papillomavirus–associated oropharynx carcinoma: a multi-institution analysis. Cancer. 2020;126(12):2784–2790. doi: 10.1002/cncr.32849.
- Hildingsson S, Gebre-Medhin M, Zschaeck S, et al. Hypoxia in relationship to tumor volume using hypoxia PET-imaging in head & neck cancer – A scoping review. Clin Transl Radiat Oncol. 2022;36:40–46. doi: 10.1016/j.ctro.2022.06.004
- Maciejewski B, Withers HR, Taylor JMG, et al. Dose fractionation and regeneration in radiotherapy for cancer of the oral cavity and oropharynx: tumor dose-response and repopulation. Int J Radiat Oncol Biol Phys. 1989;16(3):831–843. doi: 10.1016/0360-3016(89)90503-8.
- Barton MB, Keane TJ, Gadalla T, et al. The effect of treatment time and treatment interruption on tumour control following radical radiotherapy of laryngeal cancer. Radiother Oncol. 1992;23(3):137–143. doi: 10.1016/0167-8140(92)90323-m.
- Suwinski R, Wzietek I, Tarnawski R, et al. Moderately low alpha/beta ratio for rectal cancer may best explain the outcome of three fractionation schedules of preoperative radiotherapy. Int J Radiat Oncol Biol Phys. 2007;69(3):793–799. doi: 10.1016/j.ijrobp.2007.03.046.
- Dische S, Saunders M, Barrett A, et al. A randomised multicentre trial of CHART versus conventional radiotherapy in head and neck cancer. Radiother Oncol. 1997;44(2):123–136. doi: 10.1016/s0167-8140(97)00094-7.
- Hansen O, Overgaard J, Hansen HS, et al. Importance of overall treatment time for the outcome of radiotherapy of advanced head and neck carcinoma: dependency on tumor differentiation. Radiother Oncol. 1997;43(1):47–51. doi: 10.1016/s0167-8140(97)01904-x.
- Baumann M, Petersen C, Wolf J, et al. No evidence for a different magnitude of the time factor for continuously fractionated irradiation and protocols including gaps in two human squamous cell carcinoma in nude mice. Radiother Oncol. 2001;59(2):187–194. doi: 10.1016/s0167-8140(01)00283-3.
- Lassen P, Eriksen JG, Krogdahl A, et al. The influence of HPV-associated p16-expression on accelerated fractionated radiotherapy in head and neck cancer: evaluation of the randomised DAHANCA 6&7 trial. Radiother Oncol. 2011;100(1):49–55. doi: 10.1016/j.radonc.2011.02.010.
- Withers HR, Taylor JMG, Maciejewski B. The hazard of accelerated tumor clonogen repopulation during radiotherapy. Acta Oncol. 1988;27(2):131–146. doi: 10.3109/02841868809090333.
- Dubben HH. Local control, TCD50 and dose-time prescription habits in radiotherapy of head and neck tumours. Radiother Oncol. 1994;32(3):197–200. doi: 10.1016/0167-8140(94)90018-3.
- Petersen C, Zips D, Krause M, et al. Repopulation of FaDu human squamous cell carcinoma during fractionated radiotherapy correlates with reoxygenation. Int J Radiat Oncol Biol Phys. 2001;51(2):483–493. doi: 10.1016/s0360-3016(01)01686-8.
- Tarnawski R, Fowler J, Skladowski K, et al. How fast is repopulation of tumor cells during the treatment gap? Int J Radiat Oncol Biol Phys. 2002;54(1):229–236. doi: 10.1016/s0360-3016(02)02936-x.
- Lassen P, Lacas B, Pignon JP, et al. Prognostic impact of HPV-associated p16-expression and smoking status on outcomes following radiotherapy for oropharyngeal cancer: the MARCH-HPV project. Radiother Oncol. 2018;126(1):107–115. doi: 10.1016/j.radonc.2017.10.018.
- Gorphe P, Classe M, Ammari S, et al. Patterns of disease events and causes of death in patients with HPV-positive versus HPV-negative oropharyngeal carcinoma. Radiother Oncol. 2022;168:40–45. doi: 10.1016/j.radonc.2022.01.021.
- Soliman M, Yaromina A, Appold S, et al. GTV differentially impacts locoregional control of non-small cell lung cancer (NSCLC) after different fractionation schedules: subgroup analysis of the prospective randomized CHARTWEL trial. Radiother Oncol. 2013;106(3):299–304. doi: 10.1016/j.radonc.2012.12.008.
- Sjövall J, Wahlberg P, Almquist H, et al. A prospective study of positron emission tomography for evaluation of neck node response 6 weeks after radiotherapy in patients with head and neck squamous cell carcinoma. Head Neck. 2016;38 Suppl 1:E473–9. doi: 10.1002/hed.24021.