
Abstract
Context: The relationship between cadmium (Cd) and the cognition of the elderly is indistinct.
Objective: To summarise the studies on the relationship between the cognition of the elderly and Cd.
Methods: Literatures were searched in PubMed, Web of Science, China National Knowledge Infrastructure (CNKI), and Wan fang database on April 25, 2022. The entries in the STROBE statement were used to evaluate the literature quality; all the quantitative studies that met the requirements were systematically summarised.
Results: Blood Cd was negatively correlated with the cognitive ability of the elderly, corresponding to different cognitive ability assessment methods, the regression coefficients were: −0.11 (−0.20, −0.03), −0.46 (−0.71, −0.21), −0.54 (−0.90, −0.17), −0.19 (−0.37, −0.01), and −2.29 (−3.41, −1.16). The regression coefficients between urinary Cd level and cognition score were −1.42 (−2.38, −0.46), and 0.76 (−1.28, −0.23). When dietary Cd increased by 1 μg/kg, the composite z-score decreased by 3.64 (p = 0.001). There was no significant correlation between drinking water Cd, fingernail Cd and cognition (p > 0.05).
Conclusion: We concluded that blood Cd (including whole blood and plasma), urine Cd and dietary Cd were negatively correlated with the cognition of the elderly, but the relationship between Cd in drinking water and fingernails and cognition was not statistically significant.
Keywords:
Introduction
Cadmium (Cd) is a toxic and non-essential transition metal (Genchi et al. Citation2020). Occupational exposure and smoking are common forms of human exposure to Cd (Satarug et al. Citation2010). In addition, because of the presence of Cd in the atmosphere, water and soil, Cd in diet is also a major source of Cd in the human body (Zhang and Reynolds Citation2019). Human exposure to Cd may lead to a variety of diseases and injuries (Waalkes Citation2003; Satarug et al. Citation2017; Kumar and Sharma Citation2019; Reyes-Hinojosa et al. Citation2019), including cognitive impairment (Karri et al. Citation2016; Gustin et al. Citation2018).
Cognitive impairment (CI) is a common disease in the elderly, which is the result of cognitive decline, and the main symptoms are decreased attention and memory (Campbell et al. Citation2013). Severe cognitive impairment can transform into dementia (Eshkoor et al. Citation2015), which affects the normal life of the patients and their families. In recent years, with the increasing prevalence of Alzheimer’s disease (Alzheimer's Association Citation2016), the decline of cognitive function in the aged has attracted wide attention. Long-term exposure to Cd causes cognitive decline due to the neurotoxicity of Cd. The possible physiological mechanism is that Cd can induce neuronal cell apoptosis, increase the permeability of the blood-brain barrier (BBB), and induce oxidative stress (Méndez-Armenta and Ríos Citation2007; Wang and Du Citation2013; Branca et al. Citation2018). Studies showed that Cd might be a cause of neurodegenerative diseases such as Alzheimer’s disease and Parkinson’s disease (Chin-Chan et al. Citation2015; Huat et al. Citation2019). There are a large number of studies that showed an association between Cd and cognitive ability in children (Gustin et al. Citation2018; Liu Z et al. Citation2019), but there is little research on the relationship between Cd and cognitive ability in the elderly.
Exposure to Cd can be assessed in several ways, including direct measurements of Cd in blood, urine, fingernails or hair, and estimates of Cd in the human body by assessing Cd in food or drinking water (Kang et al. Citation2013; Garner and Levallois Citation2016; Ahn et al. Citation2017). Different sample media can reflect the accumulation and exposure of cadmium in different ways. Similarly, there are several ways to assess the cognitive abilities of the aged, including the Montreal Cognitive Assessment (MOCA) (Nasreddine et al. Citation2005), the Mini-Mental State Examination (MMSE) (Trivedi Citation2017), the Diagnostic and Statistical Manual of Mental Disorders (DSM) (Regier et al. Citation2013), and The Community Screening Instrument for Dementia (CSID) (Liu SI et al. Citation2005), etc. These varied methods to measure Cd and cognitive function make the relationship between Cd and cognitive function more complex.
The purpose of this study was to provide a comprehensive review of the epidemiological studies on the relationship between Cd and cognitive decline in the elderly, to reveal the relationship between Cd and cognitive decline in this group of people.
Methods
Search strategy
This systematic review was conducted according to the Guidelines of the Preferred Reporting Items for Systematic reviews and Meta-Analyses (PRISMA), and was prospectively registered with PROSPERO, with ID CRD42021275795.
Relevant studies published in English and Chinese were searched in PubMed, Web of Science, China National Knowledge Infrastructure (CNKI), and Wan fang database on April 25, 2022, without applying any date restrictions. The search terms, developed based on Medical Subject Headings (MeSH) in PubMed and applied to other databases, are as follows: (Cd) AND ("aged" OR "elderly") AND ("cognition" OR "cognitive function" OR "cognitive functions" OR "function, cognitive" OR "functions, cognitive"). To avoid omissions, references in the relevant literatures were manually screened. We give the retrieval process in PubMed as an example in Table A1 in the Appendix.
Study selection
The inclusion criteria were as follows: (1) Clearly defined the participants as the elderly and give the age limit or average age; (2) Quantitatively evaluated the cognitive function of the elderly, by using the internationally recognised cognitive function scale, or the self-created scale that can effectively evaluate the cognitive ability of the elderly; (3) Observational study, there were statistics that could indicate the relationship between Cd and cognition.
The exclusion criteria were: (1) Duplicate literatures; (2) Literatures with the same sample; (3) Non-original papers like reviews, comments, letters to the editors, or reports, etc.; (4) The subjects were patients with Alzheimer’s disease; (5) Qualitative analysis of the relationship between Cd and cognition without sufficient data.
Alzheimer’s disease is a neurodegenerative disease manifested as cognitive decline as well as memory loss, and it’s the most common form of dementia (Sun et al. Citation2018; Scheltens et al. Citation2021). Studies have shown a correlation between Cd and Alzheimer’s disease mortality (Min and Min Citation2016; Peng Q et al. Citation2017), and the circulatory Cd of patients with Alzheimer’s disease was significantly higher than the controls (Xu et al. Citation2018). Therefore, in order to explain the relationship between Cd and cognitive decline in the elderly more clearly, we excluded the study on cognitive decline caused by Alzheimer’s disease.
Two researchers screened the papers independently, and the differences were resolved through negotiation. In cases of disagreement, a third researcher was consulted.
Data extraction
We extracted the first author’s name, publication year, country, study design, sample size, the average age of subjects, sample media of Cd, the Cd measurement methods, cognition assessment methods, statistical methods, and effect values from all selected articles.
Data extraction was carried out by two researchers, separately. Differences were resolved through negotiation, and a third researcher would be consulted if necessary.
Quality of the studies
The quality assessment was conducted according to the strengthening the reporting of observational studies in epidemiology (STROBE) statement. Twelve of these items were used to evaluate the quality of the literature. The answer of "yes" was recorded as 1 point, "no" or "unclear" score meant the score was 0, and the total of the score was 12. 0–6 was classified as low quality, 7–9 as medium quality, and 10–12 as high quality.
The quality assessment was conducted by two researchers independently. Differences were to be resolved through negotiation, and the third researcher would be consulted if necessary.
Evaluation of the relationship between cd and cognitive ability
Due to the heterogeneity among sample media of Cd, assessment methods of cognitive ability and statistical methods in the included studies, we were unable to conduct a quantitative combined meta-analysis. Not all of the articles we included focussed separately on Cd and cognitive performance. We extracted all the statistical indicators that could shed light on the relationship between Cd and cognitive ability. In combination with our study quality assessment, the relationship between Cd and cognitive ability was qualitatively evaluated. In order to visually display the results, we used R 4.1.2 to summarise all the statistics in the forest plots.
Results
Search results
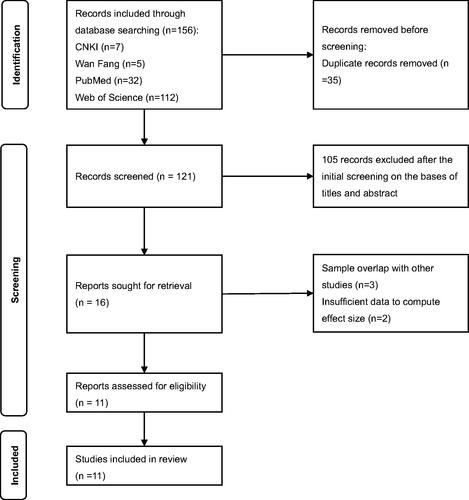
A total of 156 articles (7 from CNKI, 5 from Wan Fang, 32 from PubMed, 112 from Web of Science) were retrieved, of which 121 were left after removing the duplicates. 105 studies were excluded based on title/abstract: 13 are not at human level (animal experiments or molecular studies), 10 are reviews or reports, 10 are Alzheimer’s disease studies, 26 specialised on the relationship of Cd to other neurological diseases or only Cd, and 46 studies involved participants who were not the elderly. 5 studies were excluded after the full-text screening, 3 of which have overlapped samples with other studies, the other 2 have insufficient data. Finally, the remaining 11 articles (Emsley et al. Citation2000; Gao et al. Citation2008; Yi-bin et al. Citation2009; Ghazali et al. Citation2013; Hongyu et al. Citation2018; Iqbal et al. Citation2018; Peng Y et al. Citation2020; Hang et al. Citation2021; Xiao et al. Citation2021; Huang and Ren Citation2022; Sasaki and Carpenter Citation2022) were included for quality assessment and data analysis. The flow chart is shown in .
Figure 1. Flow chart of literature retrieval and selection (CNKI: China National Knowledge Infrastructure; Wan Fang: Wan Fang Data Knowledge Service Platform).
Quality assessments
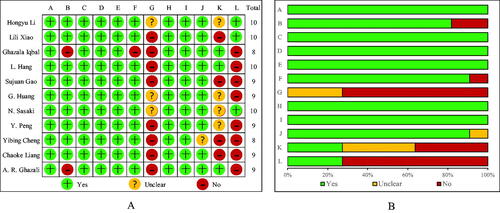
We considered the quality of the 11 articles to be acceptable. The median quality rating score was 9, the highest score is 10 and the lowest is 8. The specific assessment details are shown in .
Figure 2. Quality assessment of included articles based on STROBE Statement (A) Each included study was evaluated for quality and scored according to the STROBE statement. (B) Item evaluations in STROBE statement are presented as percentages across all included studies. A: Present key elements of study design early in the paper. B: Describe the setting, locations, and relevant dates, including periods of recruitment, exposure, follow-up and data collection. C: Cohort study—Give the eligibility criteria, and the sources and methods of selection of participants. Describe methods of follow-up. Case-control study—Give the eligibility criteria, and the sources and methods of case ascertainment and control selection. Give the rationale for the choice of cases and controls. Cross-sectional study—Give the eligibility criteria, and the sources and methods of selection of participants. D: Clearly define all outcomes, exposures, potential confounders and give diagnostic criteria, if applicable. E: For each variable of interest, give sources of data and details of methods of assessment (measurement). F: Describe any efforts to address potential sources of bias. G: Explain how the study size was arrived at. H: Explain how quantitative variables were handled in the analyses. If applicable, describe which groupings were chosen, and why. I: Describe all statistical methods, including those used to control for confounding. J: Explain how missing data were addressed. K: Cohort study—If applicable, explain how loss to follow-up was addressed. Case-control study—If applicable, explain how matching of cases and controls was addressed. Cross-sectional study—If applicable, describe analytical methods taking account of sampling strategy. L: Describe any sensitivity analyses.
Characteristics of studies
A total of 11 articles were included in this study, they were published between 2000 and 2022. All the papers were observational studies, including 1 case-control study (Iqbal et al. Citation2018), 1 cohort study (Hang et al. Citation2021), and 9 cross-sectional studies (Emsley et al. Citation2000; Gao et al. Citation2008; Yi-bin et al. Citation2009; Ghazali et al. Citation2013; Hongyu et al. Citation2018; Peng Y et al. Citation2020; Xiao et al. Citation2021; Huang and Ren Citation2022; Sasaki and Carpenter Citation2022). Six of these studies measured whole blood Cd (Hongyu et al. Citation2018; Iqbal et al. Citation2018; Hang et al. Citation2021; Xiao et al. Citation2021; Huang and Ren Citation2022; Sasaki and Carpenter Citation2022), one measured plasma Cd (Gao et al. Citation2008), two measured urine Cd (Peng Y et al. Citation2020; Sasaki and Carpenter Citation2022), one measured dietary Cd (Yi-bin et al. Citation2009), one measured drinking water Cd (Emsley et al. Citation2000) and one measured fingernail Cd (Ghazali et al. Citation2013), it should be noted that N. Sasaki et al. included both blood and urine Cd in their study. The minimum sample size was 54 and the maximum was 2879. All of the subjects in one article (Peng Y et al. Citation2020) were men. Among these papers, seven (Emsley et al. Citation2000; Gao et al. Citation2008; Yi-bin et al. Citation2009; Ghazali et al. Citation2013; Iqbal et al. Citation2018; Xiao et al. Citation2021; Sasaki and Carpenter Citation2022) aimed to explore the relationship between heavy metals and the cognitive ability of the elderly, including the relationship between Cd and the cognitive ability of the elderly, one (Huang and Ren Citation2022) aims to explore the interaction between ω-6 fatty acids and blood Cd on cognitive ability in the elderly, while the remaining three (Hongyu et al. Citation2018; Peng Y et al. Citation2020; Hang et al. Citation2021;) separately explored the relationship between Cd and the cognitive ability of the elderly. Of the 11 studies, six were conducted in China (Emsley et al. Citation2000; Gao et al. Citation2008; Yi-bin et al. Citation2009; Peng Y et al. Citation2020; Hang et al. Citation2021; Xiao et al. Citation2021), three in the United States (Hongyu et al. Citation2018; Huang and Ren Citation2022; Sasaki and Carpenter Citation2022), one in Pakistan (Iqbal et al. Citation2018) and one in Selangor Malaysia (Ghazali et al. Citation2013). Cd measurement mainly uses two kinds of instruments: inductively coupled plasma mass spectrometry (ICP-MS) and atomic absorption spectroscopy (AAS). The detailed contents of literature characteristics can be seen in Table A2 in the Appendix.
Measurement of cognition
In these 11 articles, a total of 12 cognitive ability scoring methods appeared, and 7 of these studies had multiple methods (Gao et al. Citation2008; Yi-bin et al. Citation2009; Ghazali et al. Citation2013; Hongyu et al. Citation2018; Hang et al. Citation2021; Huang and Ren Citation2022; Sasaki and Carpenter Citation2022). The measurement method used for each article is shown in Table A3 in the Appendix. The measurement methods include: Consortium to Establish a Registry for Alzheimer’s Disease (CERAD) Word List Learning Test, CREAD word list recall test, Animal Fluency test, Digital Symbol Substitution test (DDST), Mini-Mental State Examination (MMSE), Community Screening Instrument for Dementia (CSID), IU Story Recall test, Boston Naming test, Stick Design test, Delayed Stick Design test, IU Token test, Diagnostic and statistical manual of mental disorders (4th ed), Montreal Cognitive Assessment (MoCA). Four researches (Gao et al. Citation2008; Yi-bin et al. Citation2009; Hongyu et al. Citation2018; Hang et al. Citation2021) used a composite cognitive z-score to evaluate cognitive ability: one of them (Hongyu et al. Citation2018) used four scoring methods (CREAD word list learning test, CREAD word list recall test, animal Fluency test, DDST) to calculate z-score; while another one (Hang et al. Citation2021) used nine scoring methods (CREAD word list learning test, CREAD word list recall test, Animal Fluency test, CSID, IU Story Recall test, Boston Naming test, Stick Design test, Delayed Stick Design test, IU Token test); the other two (Gao et al. Citation2008; Yi-bin et al. Citation2009) used the same six assessment methods (CREAD word list learning test, CREAD word list recall test, Animal Fluency test, CSID,IU Story Recall test, IU Token test) to calculate z-score. Z-score is calculated by the average of standardised scores of the other cognitive tests. One study (Huang and Ren Citation2022) used the combined scores of CERAD test, Animal Fluency Test, and DSST to judge the level of cognitive ability. N. Sasaki et al. (Sasaki and Carpenter Citation2022) used both CREAD and DSST scores for multiple linear regression analysis. Meanwhile, in the study of A. R. Ghazali et al. (Ghazali et al. Citation2013), scores of MMSE and MOCA were simultaneously used to analyse the relationship between Cd and cognitive ability. In the remaining four articles (Emsley et al. Citation2000; Iqbal et al. Citation2018; Peng Y et al. Citation2020; Xiao et al. Citation2021), only one cognition assessment method appeared. MMSE was used to assess cognitive ability to obtain cognitive scores for analysis in a total of 4 studies (Ghazali et al. Citation2013; Iqbal et al. Citation2018; Peng Y et al. Citation2020; Xiao et al. Citation2021). See Table A3 for details.
Objectives and measurements method
The measures describing the relationship between Cd and cognitive ability in all of the articles included in our review were heterogeneous and therefore could not be combined. As shown in Table A4 in the Appendix, there are three main types of outcomes.
Cd and cognition
All the results describing Cd and cognitive ability in the 11 included literatures were summarised and classified according to the selected statistical indicators to draw three forest plots.
Cd in blood or plasma and cognition
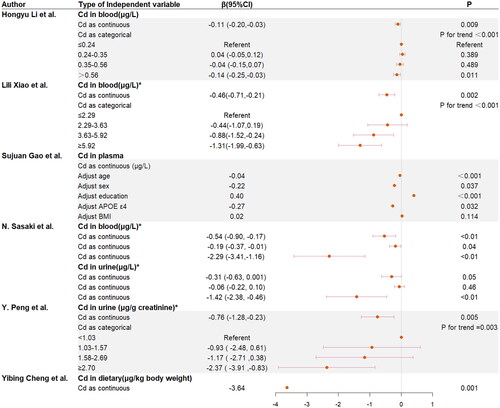
As shown in , blood Cd as a continuous variable was significantly negative with cognition score, regardless of whether log-transform was carried out, and regardless of the cognition assessment methods used: when blood Cd increased by 1 μg/L, composite z-score decreased by 0.11(95%CI: −0.20 to −0.03) (p = 0.001), and the Mini-Mental State Examination (MMSE) score decreased by 0.46 (95% CI: −0.71 to −0.21) when log-transformed blood Cd increased by 1-SD (p < 0.05). The three regression coefficients in N. Sasaki et al.’ s study correspond to CERAD immediate recall, CERAD delayed recall and DSST with log-transformed Cd, respectively, and they are all negative. When blood Cd was used as a classification variable, compared with the lowest quartile group, composite z-score decreased 0.14 (95% CI: −0.25 to −0.03) in the highest quartile group (p = 0.011), and MMSE score decreased 1.31 (95% CI: −1.99 to −0.63) in the highest quartile group, P for trend < 0.001. In , the Pearson’s r of blood Cd and cognitive ability is −0.42 (p < 0.001). Therefore, there is a negative correlation between blood Cd and cognitive ability score.
Figure 3. Association between cognition assessment scores and Cd levels. * Continuous log-transformed Cd levels. Covariates in the study of Hongyu Li et al. are: age, gender, ethnicity, education, poverty–income ratio, marital status, alcohol consumption, diabetes, hypertension, stroke and coronary heart disease. Covariates in the study of Lili Xiao et al. are: gender, age, education, annual income, BMI, cigarette smoking, alcohol drinking, insomnia, and physical activity, Ca, Ti, V, Cu, Zn, As, Se, Rb, Mo, Cd, Ba, and Pb. Covariates in the study of N. Sasaki et al. are: age, sex, race/ethnicity, education level, depression, diabetes, cigarette smoking, and alcohol consumption. Covariates in the study of Yibin Cheng et al. are: gender, age, education level, whether to watch TV or listen to the radio, BMI.
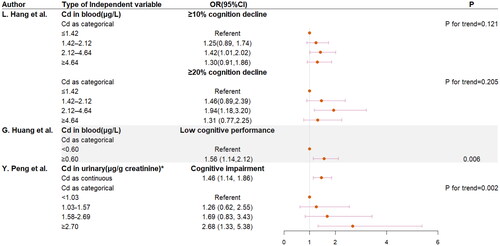
Blood Cd was associated with cognitive decline after three years, as shown in , compared with the lowest quartile group, participants in the third quartile group were more likely to show cognitive decline [OR(95%CI) was 1.42 (1.01,2.02) in 10% cognition decline, OR(95%CI) was 1.94 (1.18,3.20) in 20% cognition decline]. The group with high Cd levels was more likely to show low cognitive performance than the normal group [OR(95%CI) was 1.56 (1.14,2.12)].
Figure 4. Logistic regression between cognition decline, low cognitive performance or cognitive impairment and Cd levels. * Continuous log-transformed Cd levels. Covariates in the study of L. Hang et al. are: age, gender, marriage status, house holding status, education, APOE genotype, BMI, smoking, alcohol consumption, T2DM, HBP, HTC, HTG, LHDLC and HLDLC. Covariates in the study of G. Huang et al. are: age, gender, BMI, race, marital status, educational level, annual household income, drinking, work activity, recreational activities, depression, hypertension, diabetes, stroke, CHF, heart attack, TC, GHb, 25(OH)D. Covariates in the study of Y. Peng et al. are: age, BMI, education level, household income, and tobacco smoking.
The relationship between plasma Cd and cognition is shown in . The regression coefficient was negative when adjusting for age, sex or APOE ε4. However, the regression coefficient was positive when education level was adjusted, and there was no statistical significance when BMI was adjusted. We considered that the sample size might be too small.
Cd in urine and cognition
shows that Cd level in the urine was significantly negative with DSST score (β(95%CI): −1.42(-2.38, −0.46)), but the correlation between CERAD immediate recall, CERAD delayed recall and Cd was not significant. MMSE score decreased by 0.76 (95%CI: −1.28 to −0.23) when urinary Cd concentration increased by 2 times (p = 0.005). Compared with the lowest quartile group, participants in the fourth quartile group had 2.37 lower MMSE score (95%CI: −3.91 to −0.83), P for trend = 0.003. shows that the increasing of log2-transformed Cd in urine was associated with increased risk of cognitive impairment (OR:1.46; 95% CI: 1.14 to 1.86). In addition to this, compared with the lowest quartile group, participants in the highest quartile group had a higher risk of cognitive impairment (OR:2.68; 95% CI:1.33 to 5.38).
Cd in diet, drinking water or fingernail and cognition
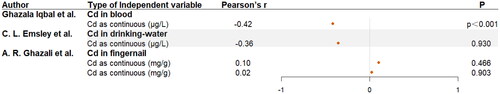
As is shown in , when dietary Cd increased by 1 μg/kg, composite z-score decreased by 3.64 (p = 0.001).
There was no significant correlation between drinking water Cd, fingernail Cd and cognitive ability score in .
Figure 5. Correlation between cognition assessment scores and Cd levels. Covariates in the study of C. L. Emsley et al. are: gender, age, education.
Discussion
The purpose of this review is to summarise all the evidence on the relationship between Cd in humans or in the environment and cognitive performance in older adults. To the best of our knowledge, this is the first systematic review of the issue. Cd is a toxic heavy metal that accumulates in the body and can cause a variety of toxic effects, including neurotoxicity (Satoh et al. Citation2002; Lafuente Citation2013). In recent years, due to the aggravation of environmental pollution, the effects of chronic toxic substances in the environment on human health have attracted extensive attention (Briffa et al. Citation2020). Along with the ageing of human society, the health problems of the elderly have become a research hotspot. Severe cognitive decline will lead to the occurrence of various types of dementia, which will affect the normal life of patients and their families (Moye et al. Citation2013; Lindenberger Citation2014).
The literatures we included used a variety of methods to assess the cognitive abilities of the elderly, but all used internationally recognised tools which can effectively reflect the cognitive abilities of the elderly. Using different sample media to measure Cd, we found that whole blood Cd, plasma Cd, urine Cd and dietary Cd are related with cognitive ability, but nail Cd and drinking water Cd have no association with cognitive ability in the elderly. Because of the high transfer rate of Cd from soil to plants, diet is the main source of Cd in the human body except for smoking and occupational exposure (Satarug et al. Citation2010). Cd from the occupational environment, tobacco or food can be absorbed into the bloodstream by inhalation and ingestion and then reach various tissues and organs through the blood circulation (Bimonte et al. Citation2021). Cd in blood mainly exists in red blood cells and plasma, hence recent Cd exposure can be reflected by measuring Cd in whole blood and plasma (Nordberg and Nordberg Citation2022). The kidney is the organ with the highest Cd level after long-term low dose exposure (Yang et al. Citation2020; Yan and Allen Citation2021). Only 0.01–0.02% of Cd in the human body is excreted through urine and faeces (Nordberg and Nordberg Citation2022). Cd bound to metallothionein is taken up by the renal tubules when reaching the kidney, mainly stored in the renal cortex, and only a small amount not absorbed is excreted through urine (Satarug et al. Citation2020). Therefore, urinary Cd is the measurement of Cd burden in the human body and kidney. The drinking water Cd in the study we included was far away from the limit (Emsley et al. Citation2000), and Cd ingested through drinking water is not the main source for Cd accumulation in human body (Mezynska and Brzóska Citation2018). According to a study of preschoolers, there was no statistically significant correlation between nail Cd and blood Cd concentrations, and nail Cd cannot be used as a measure of Cd in the human body (Oliveira et al. Citation2021). A possible reason for this is that studies have shown nails as biomarkers reflect Cd exposure over a period of time of approximately 6 months prior to nail clipping (Slotnick and Nriagu Citation2006), but do not reflect the accumulation of Cd and current levels in human, and Cd is mainly metabolised in urine and faeces (Nordberg and Nordberg Citation2022), not nails.
The neurotoxicity of Cd has been demonstrated in animal studies: continuous exposure to Cd through drinking water in adolescent and adult mice directly leads to a decrease in hippocampal-dependent learning and memory (Wang H et al. Citation2018; Citation2022) and Cd can lead to neuronal atrophy and hippocampal cell apoptosis in rats, and affect the structure and function of the hippocampus, thus leading to the decrease of recognition memory (Pulido et al. Citation2019). Exposure of lactating female mice to Cd caused significant memory impairment in F1 mice (Halder et al. Citation2016). Studies on the relationship between Cd and cognition are still limited and the mechanism has not been fully elucidated. Possible reasons for Cd to cause cognitive decline are: Cd affects nerve chemicals glycine and gamma aminobutyric acid release, undermining the balance between excitation–inhibition in synaptic neurotransmission (Branca et al. Citation2018). It can enter cerebrospinal fluid through the blood-brain barrier, causing damage to specifically the hippocampus (Karri et al. Citation2016). Cd also simulates and interferes with the function of Ca2+, which affects neurotransmitter release (Marshall et al. Citation2019; Bakulski et al. Citation2020).
In addition, Cd may interact with other metals in influencing cognitive ability (Goyer Citation1997; Karri et al. Citation2016). One of the included studies (Emsley et al. Citation2000) discussed the interaction between Cd and other metals affecting the cognitive abilities of the elderly. Although there was no independent correlation between drinking water Cd and cognitive ability of the elderly, this study showed that there was an interaction between drinking water Cd and zinc: zinc was positively correlated with cognitive ability at low levels of Cd, and zinc was negatively correlated with cognitive ability at high levels of Cd. Studies have shown that Cd and zinc have opposite toxic effects (Yu et al. Citation2021). Zinc, an essential trace element for the human body, can resist the toxic effects of Cd to some extent (Tang et al. Citation2014; Richter et al. Citation2017), which may affect the relationship between Cd in drinking water and the cognitive ability of the elderly.
We know that only three of the included studies (Hongyu et al. Citation2018; Peng Y et al. Citation2020; Hang et al. Citation2021;) specifically studied Cd and cognitive performance in older adults, while the other eight (Emsley et al. Citation2000; Gao et al. Citation2008; Yi-bin et al. Citation2009; Ghazali et al. Citation2013; Iqbal et al. Citation2018; Xiao et al. Citation2021; Huang and Ren Citation2022; Sasaki and Carpenter Citation2022) included other neurotoxicants. Of the eight studies that included other neurotoxicants, only one (Xiao et al. Citation2021) included Cd together with other neurotoxicants in one model, and the other seven examined the relationship between Cd and cognitive function separately. In the article of Xiao et al. lasso regression was used to screen variables, and then generalised linear regression was used to create a multi-metal model with 12 metals to isolate the relationship between Cd and cognition from other metals.
The strengths and significance of our study are as follows. This study systematically and comprehensively evaluated the existing literatures on the relationship between Cd and cognitive ability in the elderly, which had not been conducted in previous studies. A total of 10,396 subjects were involved in this study, covering many countries and regions, which can systematically and truly reflect the relationship between Cd and the elderly. Most of the original research aims to study the relationship between heavy metals and cognitive ability of the elderly. Therefore, regardless of whether the relationship between Cd and the elderly is statistically significant, it will be published, which greatly reduces publication bias (Lin and Chu Citation2018). Cognitive impairment in the elderly is a disease caused by a variety of complex factors. Understanding the relationship between Cd and cognitive impairment in the elderly is of great significance for the prevention, early diagnosis and symptomatic treatment of cognitive impairment in the elderly (Eshkoor et al. Citation2015; Kim et al. Citation2019).
In addition, we noted that among the included studies, participants in China and Pakistan had significantly higher levels of Cd than the participants in the United States. The difference could be due to diet: more than 80 percent of all food sources of Cd come from grains, vegetables and potatoes (Olsson et al. Citation2005).
There are still some limitations in our study. The 11 articles included in this study adopted different cognitive measurement methods and measured Cd of different biological samples, and most of them were in one study, which could not be directly combined quantitatively. Therefore, the quality of the included articles will greatly affect the quality of our systematic review. Due to the limitations of research type and purpose, all the studies we included were observational studies, which were not as capable as experimental studies to demonstrate causality. We suggest that longitudinal studies should be performed to improve the reliability of evidence when researching the relationship between Cd and cognitive performance in the elderly.
Conclusions
Through the systematic review and summary of these literatures, we concluded that blood Cd (including whole blood, plasma) and urine Cd were negatively correlated with the cognitive ability of the elderly, and increased levels of Cd would lead to an increased incidence of cognitive impairment. There was a negative correlation between dietary Cd and cognitive ability in the elderly. The relationship between Cd in drinking water and fingernails and cognitive ability was not statistically significant.
Disclosure statement
No potential conflict of interest was reported by the author(s).
Data availability statement
Data sharing is not applicable to this article as no new data were created or analysed in this study.
Additional information
Funding
References
- Alzheimer's Association 2016. 2016 Alzheimer’s disease facts and figures. Alzheimers Dement. 12(4):459–509.
- Ahn SC, Chang JY, Lee JS, Yu HY, Jung AR, Kim JY, Choi JW, et al. 2017. Exposure factors of cadmium for residents in an abandoned metal mine area in Korea. Environ Geochem Health. 39(5):1059–1070.
- Bakulski KM, Seo YA, Hickman RC, Brandt D, Vadari HS, Hu H, Park SK. 2020. Heavy metals exposure and alzheimer’s disease and related dementias. JAD. 76(4):1215–1242.
- Bimonte VM, Besharat ZM, Antonioni A, Cella V, Lenzi A, Ferretti E, Migliaccio S. 2021. The endocrine disruptor cadmium: a new player in the pathophysiology of metabolic diseases. J Endocrinol Invest. 44(7):1363–1377.
- Branca JJV, Morucci G, Pacini A. 2018. Cadmium-induced neurotoxicity: still much ado. Neural Regen Res. 13(11):1879–1882.
- Briffa J, Sinagra E, Blundell R. 2020. Heavy metal pollution in the environment and their toxicological effects on humans. Heliyon. 6(9):e04691.
- Campbell NL, Unverzagt F, LaMantia MA, Khan BA, Boustani MA. 2013. Risk factors for the progression of mild cognitive impairment to dementia. Clin Geriatr Med. 29(4):873–893.
- Chin-Chan M, Navarro-Yepes J, Quintanilla-Vega B. 2015. Environmental pollutants as risk factors for neurodegenerative disorders: alzheimer and Parkinson diseases. Front Cell Neurosci. 9:124.
- Emsley CL, Gao S, Li Y, Liang C, Ji R, Hall KS, Cao J, et al. 2000. Trace element levels in drinking water and cognitive function among elderly Chinese. Am J Epidemiol. 151(9):913–920.
- Eshkoor SA, Hamid TA, Mun CY, Ng CK. 2015. Mild cognitive impairment and its management in older people. Clin Interv Aging. 10:687–693.
- Gao S, Jin Y, Unverzagt FW, Ma F, Hall KS, Murrell JR, Cheng Y, et al. 2008. Trace element levels and cognitive function in rural elderly Chinese. J Gerontol A Biol Sci Med Sci. 63(6):635–641.
- Garner R, Levallois P. 2016. Cadmium levels and sources of exposure among Canadian adults. Health Rep. 27(2):10–18.
- Genchi G, Sinicropi MS, Lauria G, Carocci A, Catalano A. 2020. The effects of cadmium toxicity. Int J Environ Res Public Health. 17(11):3782.
- Ghazali AR, Kamarulzaman F, Normah CD, Ahmad M, Ghazali SE, Ibrahim N, Said Z, et al. 2013. Levels of Metallic Elements and Their Potential Relationships to Cognitive Function among Elderly from Federal Land Development Authority (FELDA) Settlement in Selangor Malaysia. Biol Trace Elem Res. 153(1-3):16–21.
- Goyer RA. 1997. Toxic and essential metal interactions. Annu Rev Nutr. 17:37–50.
- Gustin K, Tofail F, Vahter M, Kippler M. 2018. Cadmium exposure and cognitive abilities and behavior at 10 years of age: a prospective cohort study. Environ Int. 113:259–268.
- Halder S, Kar R, Galav V, Mehta AK, Bhattacharya SK, Mediratta PK, Banerjee BD. 2016. Cadmium exposure during lactation causes learning and memory-impairment in F1 generation mice: amelioration by quercetin. Drug Chem Toxicol. 39(3):272–278.
- Hang L, Liqin S, Xi C, Sisi W, Yibin C, Shaobin L, Liang D, et al. 2021. Higher blood cadmium level is associated with greater cognitive decline in rural Chinese adults aged 65 or older. Sci Total Environ. 756:144072.
- Hongyu L, Zhihui W, Zhen F, Mingming Y, Nanjin W, Hongyan W, Ping Y. 2018. Associations between blood cadmium levels and cognitive function in a cross-sectional study of US adults aged 60 years or older. BMJ open. 8(4):e020533.
- Huang G, Ren G. 2022. Interaction between ω-6 fatty acids intake and blood cadmium on the risk of low cognitive performance in older adults from National Health and Nutrition Examination Survey (NHANES) 2011-2014. BMC Geriatr. 22(1):292.
- Huat TJ, Camats-Perna J, Newcombe EA, Valmas N, Kitazawa M, Medeiros R. 2019. Metal toxicity links to alzheimer’s disease and neuroinflammation. J Mol Biol. 431(9):1843–1868.
- Iqbal G, Zada W, Mannan A, Ahmed T. 2018. Elevated heavy metals levels in cognitively impaired patients from Pakistan. Environ Toxicol Pharmacol. 60:100–109.
- Kang MY, Cho SH, Lim YH, Seo JC, Hong YC. 2013. Effects of environmental cadmium exposure on liver function in adults. Occup Environ Med. 70(4):268–273.
- Karri V, Schuhmacher M, Kumar V. 2016. Heavy metals (Pb, Cd, As and MeHg) as risk factors for cognitive dysfunction: a general review of metal mixture mechanism in brain. Environ Toxicol Pharmacol. 48:203–213.
- Kim H, Lee S, Ku BD, Ham SG, Park WS. 2019. Associated factors for cognitive impairment in the rural highly elderly. Brain Behav. 9(5):e01203.
- Kumar S, Sharma A. 2019. Cadmium toxicity: effects on human reproduction and fertility. Rev Environ Health. 34(4):327–338.
- Lafuente A. 2013. The hypothalamic-pituitary-gonadal axis is target of cadmium toxicity. An update of recent studies and potential therapeutic approaches. Food Chem Toxicol. 59:395–404.
- Lin L, Chu H. 2018. Quantifying publication bias in meta-analysis. Biometrics. 74(3):785–794.
- Lindenberger U. 2014. Human cognitive aging: corriger la fortune? Science. 346(6209):572–578.
- Liu SI, Prince M, Chiu MJ, Chen TF, Sun YW, Yip PK. 2005. Validity and reliability of a Taiwan Chinese version of the community screening instrument for dementia. Am J Geriatr Psychiatry. 13(7):581–588.
- Liu Z, Cai L, Liu Y, Chen W, Wang Q. 2019. Association between prenatal cadmium exposure and cognitive development of offspring: a systematic review. Environ Pollut. 254(Pt B):113081.
- Marshall TM, Dardia GP, Colvin KL, Nevin R, Macrellis J. 2019. Neurotoxicity associated with traumatic brain injury, blast, chemical, heavy metal and quinoline drug exposure. Altern Ther Health Med. 25(1):28–34.
- Méndez-Armenta M, Ríos C. 2007. Cadmium neurotoxicity. Environ Toxicol Pharmacol. 23(3):350–358.
- Mezynska M, Brzóska MM. 2018. Environmental exposure to cadmium-a risk for health of the general population in industrialized countries and preventive strategies. Environ Sci Pollut Res Int. 25(4):3211–3232.
- Min JY, Min KB. 2016. Blood cadmium levels and Alzheimer’s disease mortality risk in older US adults. Environ Health. 15(1):69.
- Moye J, Marson DC, Edelstein B. 2013. Assessment of capacity in an aging society. Am Psychol. 68(3):158–171.
- Nasreddine ZS, Phillips NA, Bédirian V, Charbonneau S, Whitehead V, Collin I, Cummings JL, Chertkow H. 2005. The Montreal Cognitive Assessment, MoCA: a brief screening tool for mild cognitive impairment. J Am Geriatr Soc. 53(4):695–699.
- Nordberg M, Nordberg GF. 2022. Metallothionein and cadmium toxicology-historical review and commentary. Biomolecules. 12(3):360.
- Oliveira AS, Costa EAC, Pereira EC, Freitas MAS, Freire BM, Batista BL, Luz MS, Olympio KPK. 2021. The applicability of fingernail lead and cadmium levels as subchronic exposure biomarkers for preschool children. Sci Total Environ. 758:143583.
- Olsson IM, Eriksson J, Oborn I, Skerfving S, Oskarsson A. 2005. Cadmium in food production systems: a health risk for sensitive population groups. Ambio. 34(4-5):344–351.
- Peng Q, Bakulski KM, Nan B, Park SK. 2017. Cadmium and Alzheimer’s disease mortality in U.S. adults: updated evidence with a urinary biomarker and extended follow-up time. Environ Res. 157:44–51.
- Peng Y, Li Z, Yang X, Yang L, He M, Zhang H, Wei X, et al. 2020. Relation between cadmium body burden and cognitive function in older men: a cross-sectional study in China. Chemosphere. 250:126535.
- Pulido G, Treviño S, Brambila E, Vazquez-Roque R, Moreno-Rodriguez A, Peña Rosas U, Moran-Perales JL, et al. 2019. The administration of cadmium for 2, 3 and 4 months causes a loss of recognition memory, promotes neuronal hypotrophy and apoptosis in the hippocampus of rats. Neurochem Res. 44(2):485–497.
- Regier DA, Kuhl EA, Kupfer DJ. 2013. The DSM-5: classification and criteria changes. World Psychiatry. 12(2):92–98.
- Reyes-Hinojosa D, Lozada-Pérez CA, Zamudio Cuevas Y, López-Reyes A, Martínez-Nava G, Fernández-Torres J, Olivos-Meza A, et al. 2019. Toxicity of cadmium in musculoskeletal diseases. Environ Toxicol Pharmacol. 72:103219.
- Richter P, Faroon O, Pappas RS. 2017. Cadmium and cadmium/zinc ratios and tobacco-related morbidities. Int J Environ Res Public Health. 14(10):1154.
- Sasaki N, Carpenter DO. 2022. Associations between metal exposures and cognitive function in American Older Adults. Int J Environ Res Public Health. 19(4):2327.
- Satarug S, G CG, D AV, Phelps KR. 2020. Cadmium and lead exposure, nephrotoxicity, and mortality. Toxics. 8(4):86.
- Satarug S, Garrett SH, Sens MA, Sens DA. 2010. Cadmium, environmental exposure, and health outcomes. Environ Health Perspect. 118(2):182–190.
- Satarug S, Vesey DA, Gobe GC. 2017. Kidney cadmium toxicity, diabetes and high blood pressure: the perfect storm. Tohoku J Exp Med. 241(1):65–87.
- Satoh M, Koyama H, Kaji T, Kito H, Tohyama C. 2002. Perspectives on cadmium toxicity research. Tohoku J Exp Med. 196(1):23–32.
- Scheltens P, De Strooper B, Kivipelto M, Holstege H, Chételat G, Teunissen CE, Cummings J, van der Flier WM. 2021. Alzheimer’s disease. Lancet. 397(10284):1577–1590.
- Slotnick MJ, Nriagu JO. 2006. Validity of human nails as a biomarker of arsenic and selenium exposure: a review. Environ Res. 102(1):125–139.
- Sun BL, Li WW, Zhu C, Jin WS, Zeng F, Liu YH, Bu XL, et al. 2018. Clinical research on alzheimer’s disease: progress and perspectives. Neurosci Bull. 34(6):1111–1118.
- Tang L, Qiu R, Tang Y, Wang S. 2014. Cadmium-zinc exchange and their binary relationship in the structure of Zn-related proteins: a mini review. Metallomics. 6(8):1313–1323.
- Trivedi D. 2017. Cochrane Review Summary: mini-Mental State Examination (MMSE) for the detection of dementia in clinically unevaluated people aged 65 and over in community and primary care populations. Prim Health Care Res Dev. 18(6):527–528.
- Waalkes MP. 2003. Cadmium carcinogenesis. Mutat Res. 533(1-2):107–120.
- Wang B, Du Y. 2013. Cadmium and its neurotoxic effects. Oxid Med Cell Longev. 2013:898034.
- Wang H, Abel GM, Storm DR, Xia Z. 2022. Adolescent cadmium exposure impairs cognition and hippocampal neurogenesis in C57BL/6 mice. Environ Toxicol. 37(2):335–348.
- Wang H, Zhang L, Abel GM, Storm DR, Xia Z. 2018. Cadmium exposure impairs cognition and olfactory memory in male C57BL/6 Mice. Toxicol Sci. 161(1):87–102.
- Xiao L, Zan G, Qin J, Wei X, Lu G, Li X, Zhang H, et al. 2021. Combined exposure to multiple metals and cognitive function in older adults. Ecotoxicol Environ Saf. 222:112465.
- Xu L, Zhang W, Liu X, Zhang C, Wang P, Zhao X. 2018. Circulatory levels of toxic metals (Aluminum, Cadmium, Mercury, Lead) in patients with alzheimer’s disease: a quantitative meta-analysis and systematic review. J Alzheimers Dis. 62(1):361–372.
- Yan LJ, Allen DC. 2021. Cadmium-induced kidney injury: oxidative damage as a unifying mechanism. Biomolecules. 11(11):1575.
- Yang H, Tang J, Guo D, Zhao Q, Wen J, Zhang Y, Obianom ON, et al. 2020. Cadmium exposure enhances organic cation transporter 2 trafficking to the kidney membrane and exacerbates cisplatin nephrotoxicity. Kidney Int. 97(4):765–777.
- Yi-bin C, Yin-Long J, Feng M. 2009. Study on Dietary Intake of Trace Elements and Cognitive Function in Some Sichuan Rural Elderly. J Environ Health. 26(07):565–568.
- Yu HT, Zhen J, Leng JY, Cai L, Ji HL, Keller BB. 2021. Zinc as a countermeasure for cadmium toxicity. Acta Pharmacol Sin. 42(3):340–346.
- Zhang H, Reynolds M. 2019. Cadmium exposure in living organisms: a short review. Sci Total Environ. 678:761–767.
Appendix
Table A1. Search strategy in PubMed (up to April 25, 2022).
Table A2. Characteristics of included studies.
Table A3. Assessment methods of cognition in the included studies.
Table A4. List of outcome measures extracted from included studies.