
Abstract
Background
Early antimicrobial therapy is crucial regarding the prognosis of vertebral osteomyelitis, but early pathogen diagnosis remains challenging.
Objective
In this study, we aimed to differentiate the types of pathogens in iatrogenic vertebral osteomyelitis (IVO) and native vertebral osteomyelitis (NVO) to guide early antibiotic treatment.
Methods
A total of 145 patients, who had confirmed spinal infection and underwent metagenomic next-generation sequencing (mNGS) testing, were included, with 114 in the NVO group and 31 in the IVO group. Using mNGS, we detected and classified 53 pathogens in the 31 patients in the IVO group and 169 pathogens in the 114 patients in the NVO group. To further distinguish IVO from NVO, we employed machine learning algorithms to select serum biomarkers and developed a nomogram model.
Results
The results revealed that the proportion of the Actinobacteria phylum in the NVO group was approximately 28.40%, which was significantly higher than the 15.09% in the IVO group. Conversely, the proportion of the Firmicutes phylum (39.62%) in the IVO group was markedly increased compared to the 21.30% in the NVO group. Further genus-level classification demonstrated that Staphylococcus was the most common pathogen in the IVO group, whereas Mycobacterium was predominant in the NVO group. Through LASSO regression and random forest algorithms, we identified 5 serum biomarkers including percentage of basophils (BASO%), percentage of monocytes (Mono%), platelet volume (PCT), globulin (G), activated partial thromboplastin time (APTT) for distinguishing IVO from NVO. Based on these biomarkers, we established a nomogram model capable of accurately discriminating between the two conditions.
Conclusion
The results of this study hold promise in providing valuable guidance to clinical practitioners for the differential diagnosis and early antimicrobial treatment of vertebral osteomyelitis.
Introduction
The estimated incidence of vertebral osteomyelitis is 2.4 cases per 100,000 individuals, with a higher prevalence observed in the elderly population, particularly those aged 70 and above, where the incidence rate is 6.5 cases per 100,000 individuals [Citation1]. Native vertebral osteomyelitis (NVO) is the most common type of vertebral osteomyelitis, typically resulting from the hematogenous spread of pathogens from infections originating in sites other than the intervertebral disc [Citation2]. The pathogenesis of iatrogenic vertebral osteomyelitis (IVO) involves direct contact with exogenous pathogens, often caused by the dissemination of infection through surgical procedures or other medical interventions [Citation3]. Surgical procedures can introduce pathogens directly into the vertebral body and surrounding tissues, leading to local infection spread [Citation4, Citation5]. Infections stemming from medical interventions at other sites can also be disseminated to the vertebral body and surrounding tissues via the bloodstream, triggering an infection. Furthermore, invasive conservative treatments such as acupuncture may also contribute to the occurrence of vertebral osteomyelitis as these methods can introduce pathogens and result in infection under certain circumstances [Citation6–8].
The clinical presentation of vertebral osteomyelitis is often atypical and may be accompanied by elevated inflammatory markers, with the possibility of fever or absence of fever [Citation9]. However, definitive diagnosis of vertebral osteomyelitis often relies on microbiological evidence. Factors such as the time-consuming nature of bacterial culture, difficulties in obtaining local spinal samples, and the specific culture requirements of certain pathogens can lead to delays, missed diagnoses, or misdiagnoses [Citation10]. Without timely initiation of targeted early treatment, vertebral osteomyelitis can erode the vertebral body, its appendages, and surrounding tissues, leading to the formation of paravertebral, epidural, or psoas abscesses and resulting in neurological compression symptoms and severe consequences such as paralysis [Citation9]. Therefore, during the early stages of the disease, empirical antimicrobial therapy should be initiated and continued until microbiological and pathological examinations of intervertebral disc tissue, vertebral endplates, or purulent cavity specimens are obtained, which may involve image-guided puncture or surgical procedures, to establish the microbiological or pathological diagnosis of vertebral osteomyelitis and determine appropriate antibiotic selection for the corresponding pathogens. Such a strategy helps improve the effectiveness of early treatment and prevent potential severe consequences [Citation11].
According to McHenry’s research report [Citation12], Staphylococcus aureus has been identified as the most common microorganism in primary vertebral osteomyelitis in Western countries, followed by Escherichia coli. However, in a study conducted in China, Mycobacterium tuberculosis was reported as the most common microorganism in vertebral osteomyelitis, followed by Staphylococcus aureus and Brucella, among others [Citation13]. These reported differences suggest potential variations in the infectious pathogens of vertebral osteomyelitis across different regions and types. Understanding the differences in pathogen types in vertebral osteomyelitis in different regions and types is of considerable clinical importance. First, it can provide epidemiological evidence for the early use of antibiotics in patients with vertebral osteomyelitis. Second, it contributes to the development of region-specific infection control strategies, including optimization of preventive measures and surveillance methods. Metagenomic next-generation sequencing (mNGS) plays an increasingly important role in clinical infection diagnosis. mNGS is a high-throughput sequencing technology that allows for comprehensive sequencing of all microbial DNA in a sample without the need for preselection or cultivation of specific microorganisms [Citation14]. In traditional clinical infection diagnosis, specific pathogens often require cultivation and identification, a process that is time-consuming and limited by the detection methods available for known pathogens. Metagenomic next-generation sequencing in clinical infection diagnosis offers a comprehensive and unbiased detection method, enabling physicians to identify pathogens more quickly and accurately, guide appropriate treatment strategies, and contribute to disease monitoring and control [Citation15]. Currently, mNGS has been widely applied in the diagnosis of vertebral osteomyelitis [Citation16, Citation17].
In this study,. we aim to utilize mNGS technology to analyze the composition of pathogens in patients with IVO and NVO in China. The objective is to provide clinical research data to support empirical antibiotic use in the absence of early pathogen-specific evidence. By conducting mNGS sequencing on vertebral osteomyelitis samples, we will explore the differences in pathogen composition and further elucidate the similarities and differences in infectious pathogens between these two types of vertebral osteomyelitis. The results of this study will provide new insights for the clinical management and treatment of IVO and NVO in China. Additionally, we will discuss potential mechanisms and clinical implications of the differences in pathogen composition and propose directions and recommendations for future research.
Method
Study design
The samples included in this study were obtained from patients with vertebral osteomyelitis who underwent surgery or local puncture in the Department of Spine Surgery at Xiangya hospital, from December 2019 to December 2022. The inclusion criteria were as follows: 1) patients had a confirmed diagnosis of vertebral osteomyelitis, including radiological and laboratory evidence suggestive of spinal infection as well as positive metagenomic next-generation sequencing (mNGS) results from postoperative lesion tissue samples; 2) study subjects were clearly categorized into the IVO group and the NVO group; 3) patients and their families who participated in this study provided explicit consent to participate in the research and signed informed consent forms.
The exclusion criteria were as follows: 1) patients for whom complete surgical records or medical records could not be obtained; 2) patients with other severe neurological or medical conditions (such as severe cardiac disease, pulmonary disease, renal insufficiency, etc.) that could substantially impact the research outcomes; 3) patients with other spine-related disorders (such as spinal tumors or traumatic spinal injuries); 4) patients with immune system disorders or patients undergoing immunosuppressive therapy could affect the research results; 5) patients with concomitant infections in other sites prior to surgery.
Diagnostic criteria for IVO were as follows: 1) medical history—patients must have a clear history of iatrogenic procedures associated with vertebral osteomyelitis, including open spinal surgery, minimally invasive spinal surgery, other relevant surgeries (such as cardiac surgery, orthopedic surgery, etc.), spinal acupuncture, dialysis, etc.; 2) temporal association—the onset of vertebral osteomyelitis must occur within 1 month after the iatrogenic procedure; 3) clinical features—patients must exhibit symptoms and signs related to the surgical intervention, such as redness, swelling, discharge, and pain at the surgical site; 4) imaging evidence—spinal imaging studies (such as X-rays, CT scans, or MRI) must demonstrate features of vertebral infection and osteomyelitis at the surgical site, such as intervertebral space narrowing, bone destruction, and abscess formation; 5) pathogen identification—the type of pathogen must be determined through mNGS analysis of specimens obtained from the affected site.
The diagnostic criteria for NVO were as follows: 1) typical symptoms and signs—patients typically present with back pain, possibly accompanied by fever and systemic malaise. Localized pain may progressively worsen, especially at night or with activity. Patients may also exhibit symptoms of intervertebral disc rupture, nerve compression, and spinal cord damage. The patient’s symptoms were unrelated to iatrogenic procedures, and there was no evidence of adjacent joint or soft tissue infection; 2) laboratory investigations—blood tests may reveal elevated levels of inflammatory markers such as C-reactive protein (CRP) and white blood cell count. These indicators are helpful in confirming the presence of infection and assessing its severity; 3) imaging studies—X-rays and magnetic resonance imaging (MRI) are commonly used imaging modalities. X-rays can show vertebral destruction and osteoporosis, although they may be less sensitive in early-stage disease. MRI provides more detailed images, revealing inflammation, edema, and lesions associated with vertebral osteomyelitis; 4) pathogen identification—the type of pathogen must be determined through mNGS analysis of specimens obtained from the affected site.
This study was approved by the Ethics Committee of Xiangya Hospital, Central South University (Ethics Review Number: 201303232). We provided a comprehensive overview of the study’s objectives and procedures to all enrolled participants and their families and obtained written informed consent from them.
Metagenomic next-generation sequencing and analysis (mNGS)
Nucleic acid extraction
The collected samples were aseptically sealed and stored at −20 °C or transported on dry ice to the molecular laboratory for immediate mNGS detection. DNA extraction and purification were performed on 200 µL of cell-free supernatant samples using the QIAamp DNA Micro Kit (QIAGEN, Hilden, Germany) following the manufacturer’s instructions. The concentration and quality of the extracted DNA were assessed using a Qubit 3.0 Fluorometer (Invitrogen, Q33216) and agarose gel electrophoresis (Major Science, UVC1-1100).
Library generation and sequencing
The construction of DNA libraries was carried out following the operating instructions of the QIAseq Ultralow Input Library Kit (Qiagen) for library preparation. To assess library quality, the Qubit 3.0 Fluorometer (Invitrogen, Q33216) and Agilent 2100 Bioanalyzer (Agilent Technologies, Palo Alto, USA) were employed. Subsequently, DNA libraries that met the quality criteria and possessed different barcode tags were pooled together. The pooled libraries were subjected to sequencing using the Illumina Nextseq 550 sequencing platform (Illumina, San Diego, USA) with a SE75 bp sequencing strategy.
Bioinformation pipeline
Following the acquisition of sequencing data, a series of data processing steps were performed to generate high-quality data. The initial steps involved the removal of connectors and low-quality, low-complexity, and short sequences. Subsequently, human-derived sequences that matched the human reference database (hg38) were eliminated using SNAP software. The remaining data were then aligned to a comprehensive microbial genome database using the Burrows–Wheeler Alignment algorithm. This database comprises an extensive collection of microbial genomes sourced from NCBI, encompassing over 30,000 microorganisms, including 17,748 bacterial species, 11,058 viral species, 1,134 fungal species, and 308 parasite species. Through this analysis, the microbial composition of the samples was determined.
The criteria for defining positive results in the metagenomic next-generation sequencing (mNGS) analysis were established as follows:
For bacteria (excluding TB), fungi (excluding Cryptococcus), and parasites: detection with sequencing coverage ranking among the top 10 pathogens identified and absence in the negative control (NTC); or sample/NTC with a ratio of reads per million mapped reads (RPM) greater than 10.
For viruses, tuberculosis, and Cryptococcus: detection of at least one specific sequence not found in the NTC or a sample/NTC RPM ratio greater than 5.
By applying these criteria, the presence of specific microorganisms was determined, allowing for the assessment of the microbial composition in the samples.
Routine laboratory test data collection
We obtained the following comprehensive set of routine laboratory test data at the time of admission for the study cohort: tubercle bacillus antibody (TB.antibody), interferon-γ release assays (IGRAs), white blood cell count (WBC), red blood cell count (RBC), hemoglobin levels (HGB), platelet count (PLT), neutrophil count (Neut), lymphocyte count (lymph), eosinophil count (EO), basophil count (BASO), monocyte count (Mono), percentage of neutrophils (Neut%), percentage of lymphocytes (Lymph%), percentage of basophils (BASO%), percentage of eosinophils (Eo%), percentage of monocytes (Mono%), red blood cell distribution width (RDW), platelet volume (PCT), mean platelet volume (MPV), total protein (TP), albumin levels (A), globulin levels (G), albumin/globulin ratio (AG), alanine aminotransferase levels (ALT), aspartate aminotransferase levels (AST), blood urea nitrogen levels (BUN), creatinine levels (Cr), triglyceride levels (TG), cholesterol levels (Chol), high-density lipoprotein levels (HDL), low-density lipoprotein levels (LDL), glucose levels (BS), prothrombin time (PT), activated partial thromboplastin time (APTT), international normalized ratio (INR), D dimer levels (DD), erythrocyte sedimentation rate (ESR), C-reactive protein levels (CRP), and procalcitonin levels.
Statistical analysis
All statistical analyses and graphical representations were performed using R software version 4.3.0. The ‘CBCgrps’ package was utilized for the statistical analysis of baseline characteristics and patient laboratory results. For continuous variables following a normal distribution, descriptive statistics are presented as the mean ± standard deviation (mean ± SD), and group differences were compared using t tests. For continuous variables not following a normal distribution, descriptive statistics are presented as medians (25th percentile, 75th percentile), and group differences were compared using nonparametric tests. Categorical data were described as numbers (percentages), and group differences were compared using the Chi-square test. Statistical significance was considered when the p value was less than 0.05. Percentage stacked plots were generated using the ‘Seurat,’ ‘ggplot2,’ and ‘ggalluvial’ packages. ROC curves and calculation of the area under the curve (AUC) were generated using the ‘pROC’ and ‘ggplot2’ packages. Chord diagrams were created using the ‘circlize’ package. Correlation heatmaps were generated using the ‘corrplot’ package. LASSO regression for variable selection (nfold set to 40) was performed using the ‘glmnet’ package. Random forest model fitting (ntrees set to 41 for the optimal model) was conducted using the ‘randomForest’ package, and the top ten most important variables were selected from the random forest model. Logistic regression model fitting and calibration plot generation were performed using the ‘rms’ package.
Result
Characteristics of study participants
In this study, a total of 145 patients were included, with 114 patients in the NVO group and 31 patients in the IVO group. The characteristics of the study population are summarized in . Regarding sex distribution, the majority of patients were male, accounting for 56% (81/145) of the total cohort. In the NVO group, 57% (65/114) were male, while in the IVO group, 52% (16/31) were male. The sex distribution did not show a statistically significant difference between the groups (p = 0.739). The age of the patients ranged from 52 to 67 years, with a median age of 58 years (interquartile range: 52-67 years). The median age was similar between the NVO group (median: 58 years, interquartile range: 51.25-66 years) and the IVO group (median: 62 years, interquartile range: 53-67.5 years), with no significant difference observed (p = 0.316). Body temperature measurements were consistent across the entire cohort, with a median value of 36.5 °C (interquartile range: 36.5-36.8 °C). No significant difference in body temperature was found between the NVO group (median: 36.5 °C, interquartile range: 36.5-36.8 °C) and the IVO group (median: 36.5 °C, interquartile range: 36.5-36.8 °C) (p = 0.889). The duration of the disease course ranged from 30 to 180 days, with a median duration of 60 days (interquartile range: 30-180 days). The median disease course was 75 days (interquartile range: 30-180 days) in the NVO group and 60 days (interquartile range: 20-120 days) in the IVO group. However, the difference in the disease course between the two groups was not statistically significant (p = 0.241).
Table 1. Characteristics and comparison between groups.
Classifying the pathogens of IVO and NVO at the phylum level
Through mNGS detection, we identified a total of 53 pathogens from 31 patients in the IVO group and 169 pathogens from 114 patients in the NVO group. The bacterial pathogens were classified into the following phyla: Actinobacteria, Bacteroidetes, Firmicutes, Fusobacteria, Proteobacteria, and Tenericutes. Additionally, fungi and viruses were analyzed as separate categories along with the bacterial classification at the phylum level. To visualize the relationships between different groups and phyla, we generated a group-phylum chord diagram. The raw data included the counts of each phylum in different groups. We calculated the total counts of each phylum within each group and used these data to construct the chord diagram. In the diagram, each group is represented by a different color, and the phyla are connected by chords, with the width of the chords indicating the respective phylum counts. By examining the chord diagram (), we observed both differences and similarities between different groups and phyla.
Figure 1. Classifying the pathogens of IVO and NVO at the phylum levelA, Group-phylum chord diagram. B, Group-phylum percentage stacked chord diagram. C, The differences in proportions of various phyla between the two groups (IVO and NVO) are illustrated by a bidirectional bar chart.
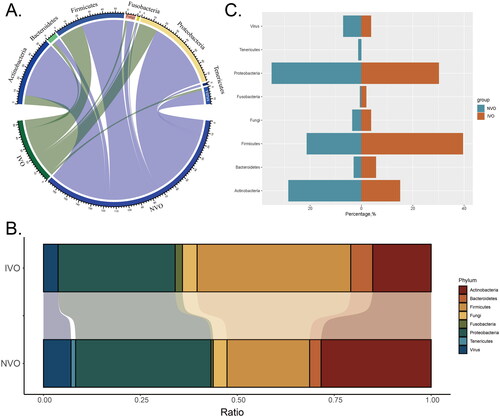
We visualized the percentages of different phyla belonging to various infection types and microbial taxa using a percentage stacked chord diagram (). Each group in the diagram is represented by a different color, and each stacked element in the diagram represents a phylum. By examining the stacked elements in the diagram, we observed the following proportions in the NVO group: Proteobacteria accounted for the largest proportion, approximately 34.91%, followed by Actinobacteria, which accounted for approximately 28.40%. Firmicutes and viruses accounted for approximately 21.30% and 7.10% of the proportions, respectively. In the IVO group, Firmicutes had the highest proportion, approximately 39.62%. Proteobacteria and Actinobacteria accounted for approximately 30.19% and 15.09% of the proportions, respectively. The proportions of other phyla were relatively smaller. Through this percentage stacked chord diagram, we were able to visually compare the distribution of phyla percentages between different groups. There were differences in the proportions of phyla among the different groups.
A bidirectional bar chart was used to illustrate the differences in proportions of various phyla between the two groups (IVO and NVO) (). In the NVO group, Actinobacteria accounted for approximately 28.40%, while in the IVO group, Actinobacteria accounted for 15.09%. In contrast, the proportion of Firmicutes in the IVO group (39.62%) was significantly higher than that in the NVO group (21.30%).
Classifying the pathogens of IVO and NVO at the genus level
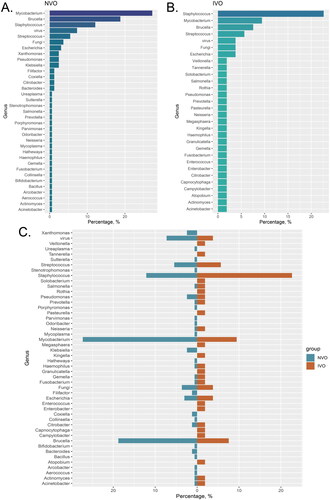
We calculated the proportions of different pathogen species in the IVO and NVO groups. In the NVO group, Mycobacterium (27.27%) had the highest proportion among all pathogen genera. Additionally, Brucella (18.79%) and Staphylococcus (12.12%) also accounted for substantial proportions in NVO (). In the IVO group, Staphylococcus was the predominant genus with the highest proportion among all pathogens (22.64%). This indicates the important role and influence of Staphylococcus in IVO. Furthermore, Mycobacterium (9.43%) and Brucella (7.54%) also occupied considerable proportions in IVO (). The bidirectional bar graph clearly illustrates the comparison of pathogen proportions between the two groups. Staphylococcus was more dominant in the IVO group, while Mycobacterium had a larger proportion in the NVO group ().
Figure 2. Classifying the pathogens of IVO and NVO at the genus level A, The bar chart illustrates the distribution of different pathogen species in the Native Vertebral Osteomyelitis (NVO) group. B, The bar chart illustrates the distribution of different pathogen species in the Iatrogenic Vertebral Osteomyelitis (IVO) group. C, The bidirectional bar graph demonstrates the distribution differences of pathogen species between the NVO and IVO groups.
Comparison of routine serological indicators of IVO and NVO
We performed a comprehensive analysis of the collected data. summarizes the distribution of study participants across various variables, including the total number of individuals (n = 145) and their classification based on the presence of IVO or NVO. The statistical significance of observed differences is represented by p values. This table encompasses a wide range of variables associated with participants’ laboratory parameters and biomarkers. For instance, the distribution of TB antibodies revealed no significant differences between the NVO and IVO groups. However, in the case of interferon-gamma release assays (IGRAs), a significant difference was observed between the NVO and IVO groups, the proportion of Mycobacterium tuberculosis infection was higher in the NVO group. Furthermore, the table presents participants’ hematological parameters, including white blood cell count (WBC), red blood cell count (RBC), hemoglobin (HGB), and platelet count (PLT). Among these parameters, we observed significant differences in PLT, HGB, BASO%, and Mono% between the NVO and IVO groups. Additionally, other variables included liver function markers (ALT and AST), kidney function markers (BUN and Cr), lipid profile markers (TG, Chol, HDL, and LDL), and coagulation markers (PT, APTT, INR, DD, and ESR). Notably, several of these markers exhibited significant differences between the NVO and IVO groups, implying diverse biomarker profiles associated with distinct types of vertebral osteomyelitis. Finally, we evaluated the presence of procalcitonin, a biomarker indicating bacterial infection. Although there was a slightly higher proportion of positive cases in the IVO group, the difference did not reach statistical significance. further illustrate the observed significant differences or trends in parameters between the IVO and NVO groups using box plots and scatter plots. In conclusion, our univariate analysis of routine laboratory parameters in the two patient groups revealed distinctive distributions across various variables, accentuating significant differences in certain parameters between the NVO and IVO groups. These findings suggest disparate laboratory parameters and biomarker profiles between iatrogenic vertebral osteomyelitis and native vertebral osteomyelitis.
Figure 3. Comparison of routine serological indicators of IVO and NVOA-J, The observed significant differences or trends in parameters between the IVO and NVO groups are illustrated by box plots and scatter plots (*P<0.05, **P<0.01, ***P<0.001). K, Receiver operating characteristic (ROC) analysis for each variable based on the IVO and NVO groups. L, The bar chart represents the ranking of area under the curve (AUC) values for all ROC curves.
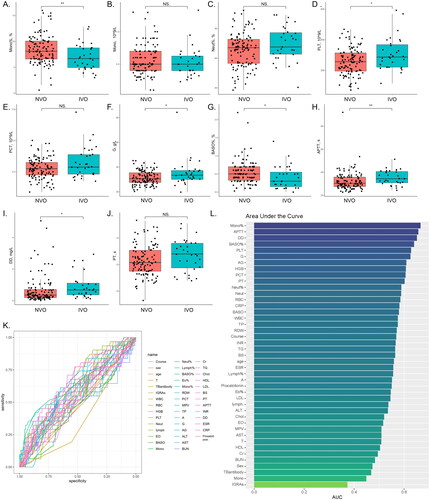
Table 2. Comparison of variables between the total study population, NVO and IVO.
We conducted receiver operating characteristic (ROC) analysis for each variable based on the IVO and NVO groups () and calculated the area under the curve (AUC) () to evaluate their diagnostic ability in distinguishing IVO and NVO. Notably, the AUC values ranged from 0.373 to 0.665, indicating varying discriminatory capabilities among different variables. Variables with higher AUC values, such as Mono%, APTT, DD, BASO%, PLT, as well as variables with lower AUC values, such as IGRAs, Mono, and TB antibodies, demonstrated relatively good diagnostic ability in differentiating IVO and NVO. Conversely, indicators with AUC values close to 0.5 suggested limited discriminatory power. However, further validation and investigation of these variables are necessary to determine their clinical relevance and to advance the development of diagnostic algorithms for distinguishing IVO and NVO.
Selection of key indicators in IVO and construction of column plot through machine learning
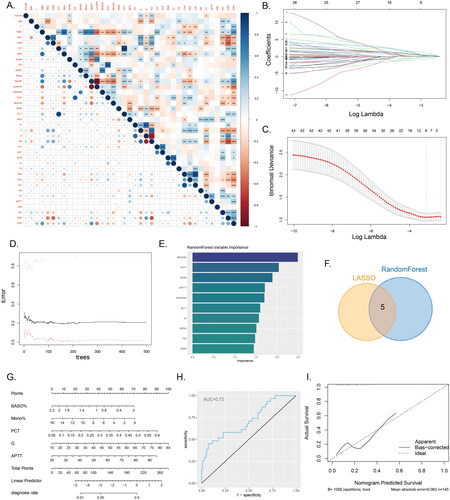
We conducted an analysis of the correlations among all continuous variables and generated a correlation heatmap (). The results of the correlation heatmap indicated significant associations among the included variables. Consequently, we employed two machine learning algorithms, namely LASSO regression and random forest, to select the relevant variables for distinguishing between IVO and NVO. Using LASSO regression, we identified 9 relevant variables: IGRAs, WBC, PLT, BASO%, Mono%, PCT, G, Cr, and APTT (). Based on the results from random forest, we selected the top ten variables ranked by variable importance, which were Mono%, PCT, BUN, APTT, BASO%, ALT, G, RDW, TG, and ESR (). The intersection of the LASSO regression and random forest results yielded 5 common variables: BASO%, Mono%, PCT, G, and APTT (). Using these 5 variables, we developed a logistic regression model and visualized the model’s results through a nomogram (). The model’s performance was evaluated using ROC curves and calibration curves. The area under the ROC curve was 0.72 (), indicating moderate discriminative ability. A calibration curve was constructed based on the data from all samples (). This further demonstrates the model’s ability to provide accurate predictions.
Figure 4. Machine learning and nomogram A, The correlation heatmap displays the correlations between various continuous variables. (*P<0.05, **P<0.01, ***P<0.001). B-C, Variable selection using LASSO regression. D-E, Variable selection using a random forest model to identify the top ten important variables. F, The Venn diagram illustrates the intersection between the results of LASSO regression and the random forest model. G, Nomogram model used to differentiate IVO and NVO. H, ROC curve of the nomogram model. I, Calibration curve of the nomogram model.
Discussion
According to the recommendations of disease guidelines, antimicrobial therapy should be initiated in the early stages of vertebral osteomyelitis [Citation18, Citation19]. However, in the early phase of the disease, the specific pathogenic species causing vertebral osteomyelitis often cannot be determined as microbiological culture or diagnostic analysis requires obtaining a specimen from the affected site through puncture or surgical procedures. Consequently, clinicians can only rely on empirical broad-spectrum antibiotics for early-stage empirical antimicrobial treatment of patients with vertebral osteomyelitis [Citation12]. Reports from various regions worldwide have shown variations in the types of pathogens causing vertebral osteomyelitis. These differences may be influenced by factors such as economic status, healthcare conditions, lifestyle habits, and racial disparities among different countries and regions. Based on available reports on vertebral osteomyelitis in China, it has been found that the most common pathogen is Mycobacterium tuberculosis, which differs from the conclusion drawn in countries such as the United States, where Staphylococcus aureus is frequently reported [Citation13, Citation20]. In this study, we further analyzed the distribution of pathogenic species in IVO and NVO vertebral osteomyelitis using metagenomic next-generation sequencing (mNGS). We also evaluated the differences in routine laboratory indicators between the IVO and NVO groups, selected key differentiating indicators through machine learning, and constructed a diagnostic nomogram specific to IVO. We hope that this study will provide data support for early empirical antimicrobial treatment of vertebral osteomyelitis in China.
First, we described the characteristics of the study participants. A total of 145 patients were included in this study, with 114 in the NVO group and 31 in the IVO group. The IVO group accounted for 21.3% of all included vertebral osteomyelitis cases, which is higher than the reported proportion of 10-15% in other studies [Citation21]. However, the higher proportion of IVO in this study may be attributed to the fact that this study was conducted at the largest spinal surgery center in our province, and all IVO patients included in this study were referrals from lower-level hospitals, which may introduce certain selection bias. There were no statistically significant differences observed in the sex distribution, age, body temperature measurements, and duration of disease among the study population. These characteristic descriptions provide basic information about the study participants and demonstrate the similarity between the two groups in these features, helping to ensure the comparability of the study and the reliability of the results.
Next, we classified the pathogens in the IVO and NVO groups. Using mNGS, we detected 53 pathogens in 31 patients in the IVO group and 169 pathogens in 114 patients in the NVO group. We categorized these pathogens based on their phylum and observed variations in the phylum proportions between the two groups. In the NVO group, Actinobacteria accounted for approximately 28.40%, which was higher than the 15.09% in the IVO group. In contrast, the proportion of Firmicutes was significantly higher in the IVO group (39.62%) than in the NVO group (21.30%). Further classification based on the genus revealed that Staphylococcus had the highest proportion in the IVO group, whereas Mycobacterium had the highest proportion in the NVO group, followed by other genera. These results suggest a potential association between specific pathogens and different types of vertebral osteomyelitis. Based on these findings, empirical antibiotic treatment for IVO may involve the use of antibiotics effective against Staphylococcus aureus, such as high-dose β-lactams (e.g. nafcillin or oxacillin) [Citation22]. For NVO, antibiotic selection can be guided by the results of interferon-gamma release assays (IGRAs) [Citation23]. If IGRAs are positive, consideration can be given to a four-drug regimen for antituberculosis therapy, while in cases where IGRAs are negative or results are not available, antibiotics effective against both Staphylococcus aureus and Mycobacterium tuberculosis, such as the combination of levofloxacin and rifampicin, may be used [Citation24].
The positive rate of mNGS in diagnosing spinal infections is significantly higher than that of traditional detection methods. According to the research by Zhang et al. [Citation13], for microbial infections in the spinal region, the positive rate of microbial cultures is less than 20%, while the detection positive rate of mNGS exceeds 85%. The low positive rate of microbial cultures has significantly impacted our clinical decision-making as spine surgeons, unable to guide us in selecting antibiotic medications. However, with the clinical application of mNGS, spine surgeons have gained confidence in using postoperative antibiotic medications for vertebral osteomyelitis. Moreover, as reported by this study, the use of targeted antibiotics based on mNGS results can enable patients with spinal infections to achieve a clinical cure faster. Additionally, mNGS is more efficient, often requiring only 1-2 days to obtain results, which represents a significant improvement compared to traditional microbial culture.
For a clinician, accurately interpreting an mNGS report is crucial for distinguishing between pathogenic and non-pathogenic microorganisms. An mNGS test of a clinical specimen will list all detected microorganisms and their relative abundances, allowing us to identify potential pathogens based on these data combined with clinical symptoms. Although mNGS does not usually provide direct information on antibiotic sensitivity, we guide antibiotic selection by integrating the known resistance patterns of the pathogens and the results of available microbial culture and sensitivity tests. In selecting antimicrobial therapy, we prioritize antibiotics that cover the primary pathogens, are highly sensitive to these pathogens, and have fewer side effects; in cases of multiple infections, broad-spectrum antibiotics or combination therapy may be necessary to ensure coverage of all potential pathogens. Clinicians also need to consider the pharmacokinetic properties of the drugs, side effects, interactions with other medications, and the patient’s specific conditions (such as renal function, liver function, allergies, etc.). During treatment, we assess the effectiveness of the therapy by monitoring the patient’s clinical response and laboratory indicators, adjusting the treatment plan as needed. The goal is to improve treatment success rates, reduce unnecessary use of antibiotics, and curb the development of antibiotic resistance.
Furthermore, we identified five cases of iatrogenic tuberculous vertebral osteomyelitis. We thoroughly reviewed the medical history and relevant examinations of these patients and found no evidence to suggest any data errors. A literature search also revealed reports of iatrogenic tuberculous infections, indicating that iatrogenic Mycobacterium tuberculosis vertebral osteomyelitis may have been overlooked in the past [Citation25–27].
By conducting univariate analysis on the routine laboratory parameters of the two patient groups, we revealed the distribution patterns of participants across different variables and highlighted significant differences between the IVO and NVO groups in certain parameters. These findings suggest potential differences in laboratory parameters and biomarker expression between IVO and NVO. To further identify biomarkers capable of distinguishing between IVO and NVO, we employed two machine learning algorithms, LASSO regression and random forest, after accounting for collinearity effects [Citation28]. As a result, we selected five biomarkers that enabled differentiation of IVO and NVO, namely, BASO%, Mono%, PCT, G, and APTT. Based on these five variables, we developed a column chart model aimed at achieving accurate diagnosis of IVO and NVO. Our model demonstrated good diagnostic performance in our study, with an AUC value of 0.72. This indicates that our model provides some reference value for distinguishing between IVO and NVO.
In conclusion, we conducted a detailed analysis of the distribution of pathogenic species in IVO and NVO using mNGS and assessed the differences between the two groups in terms of routine laboratory parameters. However, we acknowledge several limitations of the study, such as the relatively small sample size and the restriction of the study scope to a specific region and patient population. Therefore, we plan in future to further expand the sample size and conduct multicenter studies to validate and generalize our findings.
Conclusion
In summary, we successfully identified the common pathogens of vertebral osteomyelitis in the Chinese population by applying mNGS technology. The results revealed that Staphylococcus species were the most prevalent pathogens in iatrogenic vertebral osteomyelitis patients, while Mycobacterium species were the most common pathogens in NVO patients. Additionally, through the application of machine learning techniques and the analysis of a series of serological markers, we identified the importance of BASO%, Mono%, PCT, G, and APTT in distinguishing between IVO and NVO. Based on these markers, we developed a diagnostic model for differentiation. It is anticipated that the findings of this study will provide valuable insights for clinicians and offer more effective means for the differential diagnosis and early antimicrobial therapy of vertebral osteomyelitis.
Ethics approval and consent to participate
This study was approved by the Ethics Committee of Xiangya Hospital, Central South University (Ethics Review Number: 201303232). We provided a comprehensive overview of the study’s objectives and procedures to all enrolled participants and their families and obtained written informed consent from them.
Authors contributions
HX and GQ played crucial roles in this study, as they jointly performed the tasks of data analysis and paper writing. Simultaneously, the other authors made valuable contributions in data collection and case discussions. LQ, ZG, LY, LY, TM, LS, and ZH were responsible for gathering relevant data and participated in the discussion and analysis of cases. All authors reviewed the manuscript.
Consent for publication
All authors agree to publish this paper.
Data availability and materials statement
The raw data underlying this article can be obtained from the supplementary data or the corresponding author.
Supplemental Material
Download Zip (25.7 KB)Acknowledgements
We are grateful for the help and support provided by the Department of Spine Surgery, Xiangya Hospital of Central South University. We also need to thank the Big Data Center of Central South University for its help and support.
Disclosure statement
No potential conflict of interest was reported by the author(s).
Additional information
Funding
References
- Grammatico L, Baron S, Rusch E, et al. Epidemiology of vertebral osteomyelitis (VO) in France: analysis of hospital-discharge data 2002-2003. Epidemiol Infect. 2008;136(5):1–14. doi: 10.1017/S0950268807008850.
- Ablin G, Erickson TC. Osteomyelitis of cervical vertebrae (and quadriparesis) secondary to urinary tract infection: case report and review of literature. J Neurosurg. 1958;15(4):455–459. doi: 10.3171/jns.1958.15.4.0455.
- Bose B. Quadriparesis following cervical epidural steroid injections: case report and review of the literature. Spine J. 2005;5(5):558–563. doi: 10.1016/j.spinee.2005.03.015.
- Masuda S, Shimizu T, Sono T, et al. Recurrence rate after posterior percutaneous screw fixation without anterior debridement for pyogenic spondylitis compared with conservative treatment: a propensity score-matched analysis. Eur Spine J. 2023;32(12):4265–4271. doi: 10.1007/s00586-023-07800-7.
- Grossi O, Lamberet R, Longis PM, et al. Risk factors for Cutibacterium acnes spinal implant-associated infection: a case-case-control study. Clin Microbiol Infect. 2020;26(6):743–747. doi: 10.1016/j.cmi.2019.10.018.
- Bang MS, Lim SH. Paraplegia caused by spinal infection after acupuncture. Spinal Cord. 2006;44(4):258–259. doi: 10.1038/sj.sc.3101819.
- Yao Y, Hong W, Chen H, et al. Cervical spinal epidural abscess following acupuncture and wet-cupping therapy: a case report. Complement Ther Med. 2016;24:108–110. doi: 10.1016/j.ctim.2015.12.002.
- Yamashita H, Tsukayama H, Tanno Y, et al. Adverse events in acupuncture and moxibustion treatment: a six-year survey at a national clinic in Japan. J Altern Complement Med. 1999;5(3):229–236. doi: 10.1089/acm.1999.5.229.
- Fragío Gil JJ, González Mazarío R, Salavert Lleti M, et al. Vertebral osteomyelitis: clinical, microbiological and radiological characteristics of 116 patients. Med Clin (Barc). 2020;155(8):335–339. doi: 10.1016/j.medcli.2019.12.029.
- Berbari EF, Kanj SS, Kowalski TJ, et al. Executive summary: 2015 infectious diseases society of America (IDSA) clinical practice guidelines for the diagnosis and treatment of native vertebral osteomyelitis in adults. Clin Infect Dis. 2015;61(6):859–863. doi: 10.1093/cid/civ633.
- Chew FS, Kline MJ. Diagnostic yield of CT-guided percutaneous aspiration procedures in suspected spontaneous infectious diskitis. Radiology. 2001;218(1):211–214. doi: 10.1148/radiology.218.1.r01ja06211.
- McHenry MC, Easley KA, Locker GA. Vertebral osteomyelitis: long-term outcome for 253 patients from 7 cleveland-area hospitals. Clin Infect Dis. 2002;34(10):1342–1350. doi: 10.1086/340102.
- Zhang G, Zhang H, Hu X, et al. Clinical application value of metagenomic next-generation sequencing in the diagnosis of spinal infections and its impact on clinical outcomes. Front Cell Infect Microbiol. 2023;13:1076525. doi: 10.3389/fcimb.2023.1076525.
- Miao Q, Ma Y, Wang Q, et al. Microbiological diagnostic performance of metagenomic next-generation sequencing when applied to clinical practice. Clin Infect Dis. 2018;67(suppl_2):S231–s240. doi: 10.1093/cid/ciy693.
- Li N, Cai Q, Miao Q, et al. High-Throughput metagenomics for identification of pathogens in the clinical settings. Small Methods. 2021;5(1):2000792. doi: 10.1002/smtd.202000792.
- Wang G, Long J, Zhuang Y, et al. Application of metagenomic next-generation sequencing in the detection of pathogens in spinal infections. Spine J. 2023;23(6):859–867. doi: 10.1016/j.spinee.2023.02.001.
- Peng M, Li W, Li F, et al. Mycobacterium xenopi related spine infections: a case report and systematic literature review. One Health. 2023;16:100502. doi: 10.1016/j.onehlt.2023.100502.
- Khanna K, Sabharwal S. Spinal tuberculosis: a comprehensive review for the modern spine surgeon. Spine J. 2019;19(11):1858–1870. doi: 10.1016/j.spinee.2019.05.002.
- Ferry T, Kolenda C, Laurent F, et al. Personalized bacteriophage therapy to treat pandrug-resistant spinal Pseudomonas aeruginosa infection. Nat Commun. 2022;13(1):4239. doi: 10.1038/s41467-022-31837-9.
- Bettini N, Girardo M, Dema E, et al. Evaluation of conservative treatment of non specific spondylodiscitis. Eur Spine J. 2009;18(Suppl 1):143–150. doi: 10.1007/s00586-009-0979-8.
- Yagdiran A, Paul G, Meyer-Schwickerath C, et al. Clinical features and outcome of vertebral osteomyelitis after spinal injection: is it worth the price? Infection. 2023;51(3):599–607. doi: 10.1007/s15010-023-02024-9.
- Zimmerli W. Clinical practice. Vertebral osteomyelitis. N Engl J Med. 2010;362(11):1022–1029. doi: 10.1056/NEJMcp0910753.
- Hu X, Zhang H, Li Y, et al. Analysis of the diagnostic efficacy of the QuantiFERON-TB gold in-tube assay for preoperative differential diagnosis of spinal tuberculosis. Front Cell Infect Microbiol. 2022;12:983579. doi: 10.3389/fcimb.2022.983579.
- Schrenzel J, Harbarth S, Schockmel G, et al. A randomized clinical trial to compare fleroxacin-rifampicin with flucloxacillin or vancomycin for the treatment of staphylococcal infection. Clin Infect Dis. 2004;39(9):1285–1292. doi: 10.1086/424506.
- deWit D. Hospital-acquired tuberculosis. Med J Aust. 1995;163(8):428–431. doi: 10.5694/j.1326-5377.1995.tb124663.x.
- Swaminathan N, Perloff SR, Zuckerman JM. Prevention of Mycobacterium tuberculosis transmission in health care settings. Infect Dis Clin North Am. 2021;35(4):1013–1025. doi: 10.1016/j.idc.2021.07.003.
- Graves SK, Augusto O, Viegas SO, et al. Tuberculosis infection risk, preventive therapy care Cascade and incidence of tuberculosis disease in healthcare workers at Maputo Central hospital. BMC Infect Dis. 2019;19(1):346. doi: 10.1186/s12879-019-3966-7.
- Deo RC. Machine learning in medicine. Circulation. 2015;132(20):1920–1930. doi: 10.1161/CIRCULATIONAHA.115.001593.