
Abstract
Introduction
Estimated glomerular filtration rate (eGFR) and urine albumin/creatinine ratio (ACR) are insensitive biomarkers for early detection of hypertension-mediated organ damage (HMOD). In this nationwide cross-sectional study, we assessed potential biomarkers for early HMOD in healthy persons and patients with hypertension. We hypothesised that plasma levels of biomarkers: (1) are different between healthy controls and patients with hypertension, (2): can classify patients with hypertension according to the degree of hypertension severity.
Design and methods
Patients with hypertension prescribed ≥2 antihypertensive agents were selected from a multicentre study. Healthy controls were selected from an ongoing study of living kidney donor candidates. Uncontrolled hypertension was defined as systolic daytime ambulatory blood pressure ≥135 mmHg. Kidney HMOD was defined by ACR > 3.0 mg/mmol or eGFR < 60 mL/min/1.73 m2. Patients with hypertension were categorised into three groups: (1) controlled hypertension; (2) uncontrolled hypertension without kidney HMOD; (3) uncontrolled hypertension with kidney HMOD. Fifteen biomarkers were analysed using a Luminex bead-based immunoassay, and nine fell within the specified analytical range.
Results
Plasma levels of Interleukin 1 receptor antagonist (IL-1RA), neutrophil gelatinase-associated lipocalin (NGAL) and uromodulin were significantly different between healthy controls (n = 39) and patients with hypertension (n = 176). In regression models, with controlled hypertension (n = 55) as the reference category, none of the biomarkers were associated with uncontrolled hypertension without (n = 59) and with (n = 62) kidney HMOD. In models adjusted for cardiovascular risk factors and eGFR, osteopontin (OPN) was associated with uncontrolled hypertension without kidney HMOD (odds ratio (OR) 1.77 (1.05–2.98), p = 0.03), and regulated upon activation normal T-cell expressed and secreted (RANTES) with uncontrolled hypertension with kidney HMOD (OR 0.57 (0.34–0.95), p = 0.03).
Conclusions
None of the biomarkers could differentiate our hypertension groups when established risk factors were considered. Plasma OPN may identify patients with uncontrolled hypertension at risk for kidney HMOD.
PLAIN LANGUAGE SUMMARY
What is the context?
In order to tailor individualised hypertension treatment, a risk assessment for cardiovascular disease (CVD) must be performed. This includes evaluation of established hypertension-mediated organ damage (HMOD), such as the presence of kidney damage and associated risk factors. Today, kidney function is assessed by blood and urine samples. However, today’s blood and urine samples are not sensitive enough to capture kidney damage due to hypertension at a stage when prevention may be most effective.
What is new?
In this study, we evaluated plasma levels of biomarkers related to endothelial and kidney cell pathology, inflammation and fibrosis in healthy patients and patients with hypertension. We hypothesised that plasma levels of biomarkers could differentiate between different degrees of hypertension severity.
Healthy controls had lower Interleukin 1 receptor antagonist (IL-1RA) and neutrophil gelatinase-associated lipocalin (NGAL) levels, but higher uromodulin compared to patients with hypertension. Except for osteopontin (OPN), all biomarkers showed significant trends in median biomarker levels across study groups. However, as hypertension severity increased, the median plasma OPN levels also rose. None of the biomarker could consistently differentiate the hypertension severity groups after considering established risk factors. However, OPN may be an early biomarker for kidney damage in hypertension.
What is the impact?
Biomarkers for early detection of organ damage in hypertension may guide targeted treatment. Plasma OPN may have potential to identify those at risk for hypertensive kidney damage. However, the studied biomarkers lack consistent discrimination across hypertension severity levels.
Introduction
Arterial hypertension affects about 35% of the adult population and is an important modifiable risk factor for cardiovascular and progressive kidney disease [Citation1–3]. Still, 30% of treated patients have uncontrolled hypertension, remaining at risk for developing hypertension-mediated organ damage (HMOD) [Citation3,Citation4]. In order to tailor individualised hypertension treatment, a risk assessment for cardiovascular disease (CVD) must be performed. This includes evaluation of established HMOD, such as e.g. the presence of kidney damage [Citation1]. Low-grade inflammation and fibrosis may play a crucial role in the pathogenesis of hypertension and HMOD, and biomarkers may help to identify patients with the highest risk of complications [Citation5].
Inflammation usually follows three stages: increased vascular permeability, leukocyte recruitment and activation of tissue-repair processes. Inflammation is necessary for an acute response to injury and further healing. However, it can become harmful when the acute response does not resolve and becomes chronic [Citation6]. Hypertension is associated with chronic inflammation in key tissues and organs that regulate blood pressure, such as the kidneys and blood vessels [Citation6, Citation7], which might induce further organ damage and increased blood pressure [Citation8,Citation9]. Hypertension induces arterial changes including smooth muscle cell transition to myofibroblasts, augmented collagen and arterial wall thickening, and kidney changes including mesenchymal transition of tubular epithelial cells, tubulointerstitial injury and fibrosis [Citation7,Citation10]. Kidney and vascular HMOD acts as a crucial intermediate stage between cardiovascular risk factors and advanced CVD or chronic kidney disease (CKD) [Citation11]. In kidney biopsy studies, tubulointerstitial injury and fibrosis are highly prognostic for subsequent kidney failure, but cannot be reliably detected by standard clinical measures [Citation12]. Vascular HMOD can be examined by pulse wave velocity [Citation11]. However, the reproducibility of these measurements is low and depends on the operator, and they are only available at specialised centres [Citation11]. Biomarkers readily available for clinical use that can reflect early inflammation, vascular and kidney tubule and interstitial disease may provide additional information on the risk of CKD and CVD, above and beyond estimated glomerular filtration rate (eGFR) and albuminuria. Several biomarkers of kidney and endothelial cell pathology, and markers of inflammation and fibrosis are of interest ( and ). The nucleotide-binding domain, leucine-rich-containing family, pyrin domain-containing 3 (NLRP3) inflammasome initiates inflammation through two signals; Signal I, triggered by damage-associated molecular patterns (DAMPs), and pathogen-associated molecular patterns (PAMPs) on toll-like receptors (TLR), and cytokine receptors such as tumour necrosis factor(TNF)-receptor, and Signal II, activated by DAMPs like microcrystals, reactive oxygen species (ROS) and adenosine triphosphate (ATP) via P2X purinoceptor 7 (P2X7). Once activated, the inflammasome activates caspase-1, which converts proinflammatory interleukin-1ß (IL-1ß) and interleukin-18 (IL-18) into their active forms. IL-1ß and IL-18 are primarily produced by monocytes and macrophages and bind to receptors on immune and vascular cells, causing inflammation. The anti-inflammatory cytokine interleukin 1 receptor antagonist (IL-1RA) antagonizes IL-1ß. Activation of TLR, NLRP3 inflammasome and the TLR MyD88 dependent and independent pathways leads to increased nuclear factor-κB (NF-kB) activity and to the release of chemokines and extracellular matrix proteins, such as IL-1β, TNF, monocyte chemoattractant protein-1 (MCP-1), regulated upon activation normal T-cell expressed and secreted (RANTES) and osteopontin (OPN). Chronic inflammations result in tissue damage over time. Endothelial injury, inflammation, and shear stress cause the release of von Willebrand factor (vWF), while neutrophil gelatinase-associated lipocalin (NGAL) and uromodulin are markers of kidney injury. In this cross-sectional nationwide multicenter study, we aimed to assess the plasma levels of IL-1RA, Il-18, TNF, MCP-1, OPN, RANTES, vWF-A2, NGAL and uromodulin in patients with hypertension and in healthy controls. Further, we aimed to study the associations between biomarkers, severity of hypertension and kidney HMOD. We hypothesised that: (1) plasma levels of biomarkers are different between healthy controls and patients with hypertension, and (2): plasma levels of biomarkers can classify patients with hypertension according to the degree of hypertension severity.
Figure 1. Illustration depicting potential biomarkers associated with endothelial and kidney cell pathology, inflammation, and fibrosis in the context of hypertension and hypertension mediated organ damage.
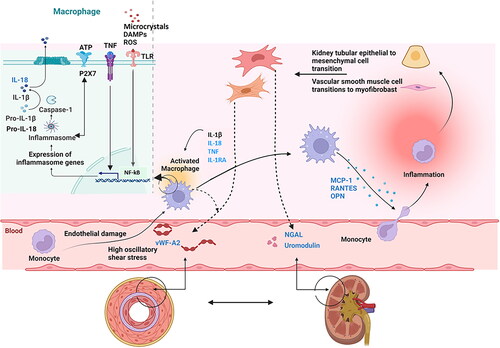
Table 1. Panel of plasma biomarkers included in this study.
Design and methods
Study population
We selected patients with hypertension from a large nationwide multicentre study that recruited participants between 2017 and 2022 (identifier: NCT03209154) [Citation13]. They were ≥18 years old, being prescribed ≥2 antihypertensive agents (or ≥1 fixed-dose combination pill), on a stable treatment regimen for at least 4 weeks, with eGFR >30 mL/min/1.73 m2 and urine albumin/creatinine ratio (ACR) < 300 mg/mmol (Supplementary Table S1) [Citation13]. This study, part of a clinical trial on non-adherent patients with uncontrolled hypertension, examined the impact of therapeutic drug monitoring (TDM) on antihypertensive drugs over 6 months. High-risk patients (e.g. ACR > 300 mg/mmol or eGFR <30 mL/min/1.73 m2) were excluded due to unacceptable risk. Healthy controls were selected from an ongoing study of living kidney donors (identifier: NCT03729557) [Citation14]. They were ≥18 years old, either accepted as living kidney donors, or evaluated for donation, and not found eligible due to immunological incompatibility, donor withdrawal or other non-medical causes, or family members related to donors or recipients and blood donors evaluated and fulfilling the Norwegian transplantation protocol for living kidney donors. Individuals accepted as kidney donors were examined prior to donation. An established collaboration with all regional and university hospitals in Norway allowed all Norwegian living kidney donors to participate (Supplementary Table S1) [Citation14].
The healthy controls and patients with hypertension were age and sex matched to the greatest extent possible, and the preanalytical blood sampling conditions were the same. Patients with hypertension were selected into three groups based on the severity of hypertension and presence of kidney HMOD; 1) controlled hypertension, 2) uncontrolled hypertension without kidney HMOD or 3) uncontrolled hypertension with kidney HMOD. Uncontrolled hypertension was defined as systolic daytime ambulatory blood pressure ≥135 mmHg, and kidney HMOD as ACR >3.0 mg/mmol or eGFR <60 mL/min/1.73 m2. Patients using systemic immunosuppressive medications were excluded.
The study was approved by the Regional Ethical Committee and conducted in accordance with the Declaration of Helsinki and consistent with International Conference of Harmonisation (ICH)/Good Clinical Practice. All participants provided a signed written informed consent. Registration of patient data followed national personal data laws and was approved by local data safety officers. Review of the data supporting these findings is possible upon reasonable request to the corresponding author.
Demographic and clinical characteristics
All patients underwent a structured physician-patient interview collecting information about demographic and lifestyle data, socioeconomic factors and medical and family history [Citation13,Citation14]. We recorded the patients’ weight, height and calculated body mass index (BMI). Diabetes was defined as self-reported diabetes, HbA1c ≥ 48 mmol/mol, or the use of antidiabetic agents. Cardiovascular disease was defined as prior myocardial infarction, angina, stroke or peripheral artery disease.
Office blood pressure was measured using a validated automated oscillometric device, following the 2018 European Society of Hypertension/European Society of Cardiology guidelines [Citation1]. Ambulatory blood pressure monitoring (ABPM) was programmed to automatic readings every 20 min during daytime (6:00 to 22:00) and every 30 min at night (22:00 to 6:00). The device was removed after 25 h of recording. Recordings with less than 70% of the expected blood pressure readings, or two or more consecutive hours without valid readings, were repeated. We adjusted the readings to the patient-reported day and night periods [Citation13].
Blood sample collection and biomarker analyses
Blood and morning urine samples were collected. The following parameters were measured at the time of collection at each study centre: creatinine, HbA1c, cholesterol (HDL, LDL and total) and triglycerides in the blood, and albumin and creatinine in urine. We calculated ACR. To calculate creatinine-based eGFR, we applied the 2009 CKD Epidemiology Collaboration (CKD-EPI) equation [Citation15–18].
For individuals with hypertension, we collected a 5 mL Vacutainer tube (BD, Franklin Lakes, NJ) without additives for analyses of antihypertensive agents. Adherence to antihypertensive treatment was confirmed by pharmacological evaluation based on serum drug concentrations measured by ultra-high performance liquid chromatography-tandem mass spectrometry [Citation19]. We present the number of antihypertensive medications based on self-reported data, and the number of non-adherent patients based on the pharmacological evaluation.
Ethylenediaminetetraacetic acid (EDTA) plasma biobank samples were taken. For potential kidney donors the EDTA plasma samples were obtained at the evaluation visit prior to potential kidney donation. Immediately after phlebotomy, all plasma tubes were placed in icewater and within 30 min centrifuged for 20 min at 2500 g at 4 °C and transferred to Sarstedt tubes. All biobank samples were then frozen to −80 °C within 2 h of sampling and transported to the core laboratory biobank at Oslo University Hospital Ullevål. All biomarker analyses were performed at the Department of Medical Biochemistry, Oslo University Hospital Ullevål, Oslo. Biomarker plasma concentrations were determined using immunoassay technology with the commercial instrument Luminex IS 200 (Bio-Plex xMap; Luminex Corp., Austin, TX). Samples were thawed, vortexed and spun down at 16,000 g for 5 min at 4 °C. In accordance to the manufacture recommendations, supernatants were diluted 1:1 and analysed with a custom-made 11 plex (www.biotechne.com/l/rl/c2TCU6j3) containing targets against MCP-1, interferon gamma (IFN-g), IL-1RA, IL-18, T cell immunoglobulin and mucin domain 1 (TIM-1), vWF-A2, granulocyte-macrophage colony stimulating factor (GM-CSF), IL-1b, IL-6, OPN and TNF. Samples were further diluted 1:50 and analysed with a custom-made 4 plex (www.biotechne.com/l/rl/QQyEg7ca) containing targets against RANTES, NGAL, cystatin C and uromodulin (Tamm-Horsfall protein). Patient and healthy control samples were evenly distributed on each assay plate. Four in-house controls per plate were used to observe both intra and inter percent coefficients of variation. Cytokine concentrations outside the reference limits that were extrapolated by the analysis software were also included in the statistical analysis. The investigator was blinded to clinical information when performing the analysis. Cystatin C was not assayed with an internationally traceable standard reference method, and was not further examined [Citation17]. For the specified biomarkers IFN-γ, TIM-1, GM-CSF, IL-1β and IL-6, a substantial portion of the conducted analyses yielded results below the threshold for either detection or quantitation, for both the healthy controls and the hypertensive patients. Consequently, these markers were not subjected to further investigation, as detailed in Supplementary Tables S2 and S3. Subsequent to the exclusion of patients undergoing systemic immunosuppression treatments, 98.5% or more of the biomarker analyses fell within the specified analytical range (Supplementary Table S3).
Table 2. Characteristics of healthy controls and patients with hypertension (n = 215)
Table 3. Levels of biomarkers between healthy controls and hypertensive patients (n = 215).
Statistical analyses
Descriptive statistics were used to summarise participant characteristics using mean and standard deviation (SD) or median and interquartile range (IQR) for continuous variables and frequency distribution and percentage for categorical variables. Characteristics were compared using a t-test, Mann–Whitney test, chi-square test, Fisher’s exact test of independence and Kendall’s rank correlation (Kendall’s tau), as appropriate. Kendall’s rank correlation is a non-parametric test for a monotonic tendency between two variables measured on a continuous or ordinal scale. The biomarkers were non-normally distributed and were transformed on a natural logarithmic (LN) scale. All biomarkers had outliers and influential cases after LN transformation that changed the magnitude of regression coefficients. We performed a symmetric winsorisation and replaced the smallest and the largest data values. The number of adjusted measurements in the upper distribution corresponds to the number of adjusted measurements in the lower distribution for each biomarker. Extreme measurements above three SD from the mean were adjusted to the nearest measured value below this threshold [Citation20].
We used univariable and multivariable logistic and multinomial logistic regression analyses to assess the associations between the plasma biomarkers as independent variables and the hypertension groups as dependent variables. Controlled hypertension was the reference group in the multinomial logistic regression analyses, and uncontrolled hypertension without kidney HMOD was the reference group in logistic regression analyses. In multivariable models, we added cardiovascular risk factors (sex, age, BMI, diabetes and cardiovascular disease), and finally eGFR. Only one of the three hypertension groups included individuals with moderately increased ACR, and the regression models were not adjusted for this variable due to complete separation. We adjusted our regression models to address potential confounding variables, excluding smoking, total and low-density lipoprotein (LDL) cholesterol levels due to their non-significant differences between groups and variations in lipid-lowering treatment (). Lipid-lowering treatment as primary prevention is predominantly prescribed as part of a comprehensive cardiovascular risk management strategy that encompasses blood pressure. We did not adjust for lipid-lowering therapy to maintain clarity in group distinctions.
The biomarkers were analysed as continuous variables, with odds ratio (OR) for belonging to one of the uncontrolled hypertensions groups reported per 1 SD higher LN-transformed biomarker concentration.
Participants with missing data were excluded only from analyses for which the case had missing data. Missing data arises from biomarker analyses that fail to meet the detection or quality criteria. Supplementary Table S3 provides an overview of participants whose analyses fall within the analytic range. Only participants with biomarker analyses within this range were included in the statistical analysis.
This study was a subset of a larger clinical trial, with several work packages, e.g. a cross-sectional study and a randomised clinical trial (RCT). These biomarker analyses were predefined as exploratory in a substudy protocol; however, the power calculations were performed for the RCT. Multiple significance tests were used for descriptive purposes, and multiplicity corrections were not performed [Citation21]. A two-sided p value <0.05 was considered statistically significant. The results of these biomarker analyses should be considered as potential hypotheses generating and must be confirmed in other prospective studies.
Results
Demographic and clinical characteristics
Two hundred and twenty-two individuals, 183 with hypertension and 39 healthy controls were initially examined for a panel of 15 biomarkers. After excluding 7 patients (with hypertension) using systemic immunosuppressive therapy and 5 biomarkers, we ended up with a total of 215 individuals, 176 patients with hypertension and 39 healthy controls and 9 biomarkers (, Supplementary Tables S2 and S3).
Among patients with hypertension, 55 patients had controlled hypertension, 59 had uncontrolled hypertension without kidney HMOD and 62 had uncontrolled hypertension with kidney HMOD (). As expected from selection, the office blood pressure was higher in patients with hypertension than in healthy controls; mean (SD) 152 ± 20/87 ± 13 mmHg with median (IQR) 3 (2–4) antihypertensive agents daily for the participants with hypertension, and 123 ± 12/76 ± 9 mmHg for the healthy controls. The participants with hypertension had lower eGFR and higher urine ACR (). As expected, the patients with hypertension had more cardiovascular risk factors than the healthy controls. They were older, had higher BMI, more frequently used lipid-lowering therapy and 27.8% were diagnosed with diabetes ().
Compared to the controlled hypertension group, the uncontrolled hypertension group without kidney HMOD had higher BMI and eGFR. The patients with uncontrolled hypertension with kidney HMOD were older, more frequently had diabetes and cardiovascular disease, and reported a higher number of daily antihypertensive agents (). Serum concentration assessment for adherence did not differ between the two groups with uncontrolled hypertension compared to the controlled hypertension group.
Compared to the uncontrolled hypertension group without kidney HMOD, the group with kidney HMOD, had lower daytime diastolic and higher night-time systolic blood pressure (). They also reported using more antihypertensive agents, and they had a higher rate of adherence, evaluated pharmacologically (). Additionally, the group with kidney HMOD was older, had a higher BMI, included more participants with diabetes and were more frequently using lipid-lowering treatment ().
Plasma biomarker levels between healthy controls and patients with hypertension
Plasma levels of IL-1RA, NGAL and uromodulin were significantly different between healthy controls and patients with hypertension. IL-1RA and NGAL were lower and uromodulin was higher in the healthy controls (). All biomarkers, with the exception of OPN, exhibited a monotonic tendency in the medians across all four study groups consisting of healthy controls and patients with hypertension (). Plasma OPN levels were highest in healthy controls and in patients with uncontrolled hypertension with kidney HMOD. All biomarkers, with the exception of RANTES, exhibited a monotonic tendency in the medians across the three hypertension severity groups (Supplementary Table S4).
Table 4. The trend in biomarker medians in relation to all study groups (n = 215).
Associations between plasma biomarkers and hypertension groups
In multinomial logistic regression models including only patients with hypertension and using controlled hypertension as the reference category, none of the biomarkers were associated with both groups with uncontrolled hypertension (, Supplementary Table S5). Uromodulin and OPN were associated with uncontrolled hypertension without kidney HMOD in multivariable models with cardiovascular risk factors. Only OPN was significantly associated after adjustment for eGFR (). RANTES and NGAL were associated with uncontrolled hypertension with kidney HMOD in multivariable models, but only RANTES was significantly associated with hypertension with kidney HMOD in models also adjusted for eGFR ().
Figure 2. Multinomial logistic regression among patients with hypertension, controlled hypertension as reference category (n = 176).
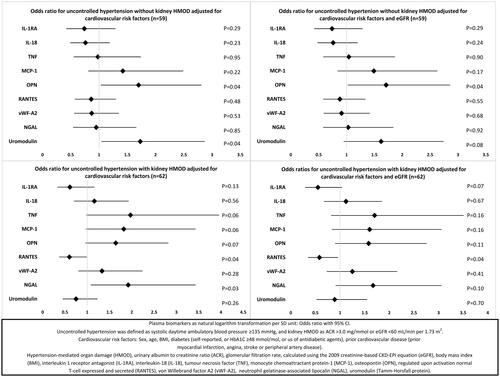
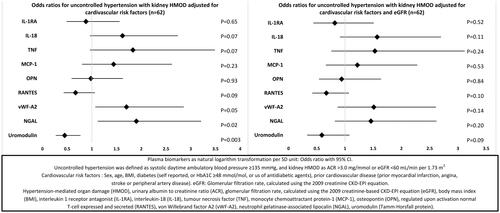
In logistic regression models including only participants with uncontrolled hypertension (n = 126), vWF-A2, NGAL and uromodulin were associated with kidney HMOD in multivariable models adjusted for cardiovascular risk factors, but not in models with additional adjustment for eGFR (, Supplementary Table S6).
Figure 3. Binary logistic regression among patients with uncontrolled hypertension, uncontrolled hypertension without kidney HMOD as reference category (n = 121).
Discussion
According to our knowledge, this is the first study to assess possible associations between selected plasma biomarkers of inflammation, kidney and endothelial dysfunction, and controlled and uncontrolled hypertension without and with kidney HMOD. Subclinical kidney disease is linked to hypertension development in the general population, potentially creating a harmful cycle of elevated blood pressure and worsening kidney damage [Citation22,Citation23]. Kidney HMOD acts as a crucial intermediate stage between cardiovascular risk factors and advanced CVD and CKD [Citation11]. A biomarker that captures kidney HMOD at an early stage might improve risk stratification and form the basis for targeted individual treatment. Our hypertension groups were well characterised, defined by ABPM, on stable medication regimes with adherence to the number of reported antihypertensive agents assessed by pharmacological evaluation of serum drug concentrations. ABPM has been shown to correlate with HMOD, and predict end-stage kidney disease and cardiovascular morbidity and mortality better than office blood pressure [Citation24–29]. Furthermore, lowering blood pressure can exaggerate an early GFR decline [Citation1]. The eGFR was only marginally different between those who had controlled hypertension and those who had uncontrolled hypertension without evidence of HMOD. The latter group also had significantly higher urine ACR, although within the normal range. As hypertension-related structural abnormalities in the kidney can never completely regress [Citation30–33], these data clearly demonstrate that our hypertension groups represent different stages of disease severity.
In this study, levels of IL-1RA and NGAL were significantly lower and uromodulin was significantly higher in the healthy controls compared to patients with hypertension. All biomarkers, except OPN, exhibited a significant monotonic tendency in the medians across all four study groups. However, OPN exhibited a significant monotonic tendency in the median values across all three hypertension groups. None of the biomarkers examined in this study could consistently differentiate all three hypertension groups when established risk factors were considered.
Higher circulating OPN levels have previously been associated with hypertension, HMOD and CKD [Citation34–38]. Our study indicates that OPN may be a timely biomarker of kidney HMOD in hypertension. Among patients with hypertension, OPN was the only biomarker significantly associated with uncontrolled hypertension without kidney HMOD, at a potentially pivotal juncture in the progression of hypertension. No differences in usage of blood pressure or lipid-lowering medication were found between those with controlled and uncontrolled hypertension without kidney HMOD, except for calcium channel blockers (, Supplementary Table S7). Calcium channel blockers have not been found to exert an influence on plasma OPN levels [Citation36]. However, humans express multiple isoforms of OPN with different functional effects, and larger and longitudinal studies are required to determine if individual OPN isoforms or total OPN levels may be useful biomarkers in hypertension [Citation39,Citation40].
In our study, healthy controls had the highest OPN levels, but as hypertension severity increased, the median plasma OPN levels also rose. A previous study comparing individuals with and without hypertension reported elevated plasma OPN levels among participants with hypertension [Citation36]. In that study, a smaller proportion of the hypertension patients were treated with angiotensin-converting enzyme inhibitor (ACEi) and angiotensin II receptor blockers (ARBs) and the use of lipid-lowering therapy was not reported. In a post hoc study from a double-blinded, multicentre trial in patients with hypertension, therapy with ARB and co-therapy with statin reduced circulating OPN levels [Citation37,Citation41]. In our study the majority of hypertension patients were prescribed ACEi or ARBs (Supplementary Table S7), and about half were receiving lipid-lowering therapy (), in contrast to a mere 4% of the healthy controls. As mentioned, we did not adjust our analyses for lipid-lowering treatment because the hypertension groups with controlled and uncontrolled hypertension without HMOD predominantly used this treatment as primary prophylaxis. Adjusting for this variable could minimise the differences between these two risk groups.
Among patients with hypertension, higher plasma level of uromodulin was independently associated with uncontrolled hypertension without kidney HMOD. This group also had the highest level of plasma uromodulin (). Our data are consistent with previous observational studies indicating that high plasma uromodulin may protect against developing hypertensive kidney damage [Citation42–47]. In a study on high-risk patients with hypertension and CKD stages 3 and 4 at baseline, higher urine uromodulin was associated with a slower eGFR decline and lower cardiovascular disease risk, and the association with eGFR decline was weakened by intensive blood pressure control [Citation44,Citation45]. In our study, the association with uncontrolled hypertension without kidney HMOD was no longer statistically significant when adjusting for eGFR.
Among patients with hypertension, lower circulating RANTES was the only biomarker associated with uncontrolled hypertension with kidney HMOD in fully adjusted models. Higher plasma RANTES levels have been associated with hypertension, and studies have found significant correlations between higher circulating RANTES and vascular function [Citation48–50]. However, conflicting results exist regarding RANTES’ role in generating renal fibrosis [Citation51,Citation52]. We have not found other studies examining the association between RANTES, degree of blood pressure control and kidney HMOD, and the effects of treatment on RANTES levels are unclear.
Among patients with hypertension, higher plasma NGAL was associated with uncontrolled hypertension with kidney HMOD after adjusting for cardiovascular risk factors. The association was not significant after further adjustment for eGFR. These results are in line with previous studies suggesting that NGAL may be an augmenting factor for kidney interstitial fibrosis [Citation53–55]. In a general population cohort with 10 years of follow-up, plasma NGAL added to the Framingham risk score improved risk prediction for all-cause mortality and major adverse cardiovascular events, and correctly reclassified ≈15% into more appropriate cardiovascular risk groups [Citation56]. In a cohort of adult patients with non-dialysis-dependent CKD stages 3–5, higher plasma NGAL was independently associated with a greater risk for end-stage kidney disease, but not cardiovascular events or death [Citation55]. In our study, when considering established risk factors, NGAL did not differentiate the hypertension groups.
IL-1RA has previously been associated with hypertension, possibly through modulation of the renin–angiotensin system, and may modulate hypertensive kidney disease [Citation57–61]. Treatment with IL-1RA led to a decrease in systolic blood pressure among obese patients with features of the metabolic syndrome [Citation62,Citation63]. However, in our study, when considering established risk factors, IL-1RA did not separate the different hypertension groups.
A biomarker is a measurable indicator to; (1) detect or confirm a medical condition; (2) identify subtypes of a condition; (3) assess the status of a condition; (4) assess the biological response after treatment; (5) identify individuals likely to have a favourable or unfavourable effect from treatment; and (6) identify the likelihood of a clinical event or progression in the condition of interest [Citation64]. Our study touches on all these points. In these exploratory analyses, our limited sample size may explain the lack of discriminatory abilities of the biomarkers for the hypertension groups. The confidence intervals for the ORs in the multivariable models were wide, reflecting a high dispersion and low statistical power. Additionally, biomarker performance can be inflated when studying only extreme disease cases [Citation65]. This ‘spectrum effect’ arises when both healthy individuals and those in advanced disease stages are examined together, potentially also masking differences in test performance [Citation65]. Age-based matching can also introduce the spectrum effect, as blood pressure tends to rise with age. By age-based matching we risked selecting the oldest and healthiest controls and the youngest and sickest hypertension patients. However, we only assessed the associations between biomarkers and hypertension severity within the various hypertension groups, excluding healthy controls from the analysis. Inclusion of an intermediate group, as done in this study, may mitigate some of the spectrum effect. Our biomarker analyses were performed on frozen-thawed samples. However, all the chosen biomarkers appear to be stable after prolonged frozen storage and after freeze–thaw analysis [Citation66–75]. However, the cross-sectional design of our study precludes the ability to obtain information on the temporal associations, including duration of treatment and blood pressure control. Serum drug measurement only reflects adherence at the time of measurement. The state of inflammation and signs of organ damage may depend on a time factor, we were not able to account for, and longitudinal studies are needed to determine whether OPN, uromodulin, RANTES and NGAL are adequate biomarkers for risk stratification in hypertension. Further limitations include residual confounding, an issue that never can be ruled out in cohort studies. Finally, patients with hypertension were selected based on blood pressure and standard clinical kidney function measurements, and we did not stratify patients based on other HMODs.
Conclusion
Finding biomarkers related to hypertension and HMOD at an early stage may aid targeted treatment. Plasma OPN may be an early biomarker for identifying patients with hypertension at risk for kidney HMOD. However, none of the biomarkers could consistently differentiate our hypertension groups when established risk factors were included in the models. The selected biomarkers may have a place in the field of hypertension, but further longitudinal analyses are needed.
Supplemental Material
Download MS Excel (38.3 KB)Acknowledgements
We are grateful to Knut Liestøl, University of Oslo, Institutes of Clinical Medicine and Informatics, Norway, for guidance on statistical analyses. We acknowledge the work of the research staff at the study sites in Oslo, Bergen, Trondheim and Tromsø.
Disclosure statement
No potential conflict of interest was reported by the author(s).
Additional information
Funding
References
- Williams B, Mancia G, Spiering W, et al. 2018 ESC/ESH guidelines for the management of arterial hypertension. Eur Heart J. 2018;39(33):1–15. doi: 10.1093/eurheartj/ehy339.
- Lv J, Ehteshami P, Sarnak MJ, et al. Effects of intensive blood pressure lowering on the progression of chronic kidney disease: a systematic review and meta-analysis. CMAJ. 2013;185(11):949–957. doi: 10.1503/cmaj.121468.
- Organization WH. Global report on hypertension: the race against a silent killer. Geneva, Switzerland: World Health Organization; 2023. Licence: CC BY-NC-SA 30 IGO. 2023.
- Burnier M. Improving blood pressure control in the hypertensive population. Hypertension. 2019;74(1):29–31. doi: 10.1161/HYPERTENSIONAHA.119.12598.
- Rizzoni D, De Ciuceis C, Szczepaniak P, et al. Immune system and microvascular remodeling in humans. Hypertension. 2022;79(4):691–705. doi: 10.1161/HYPERTENSIONAHA.121.17955.
- Xiao L, Harrison DG. Inflammation in hypertension. Can J Cardiol. 2020;36(5):635–647. doi: 10.1016/j.cjca.2020.01.013.
- Seccia TM, Caroccia B, Calò LA. Hypertensive nephropathy. Moving from classic to emerging pathogenetic mechanisms. J Hypertens. 2017;35(2):205–212. doi: 10.1097/HJH.0000000000001170.
- Barbieri M, Ferrucci L, Corsi AM, et al. Is chronic inflammation a determinant of blood pressure in the elderly? Am J Hypertens. 2003;16(7):537–543. doi: 10.1016/s0895-7061(03)00861-6.
- De Miguel C, Pelegrin P, Baroja-Mazo A, et al. Emerging role of the inflammasome and pyroptosis in hypertension. Int J Mol Sci. 2021;22(3):1064. doi: 10.3390/ijms22031064.
- Martinez-Quinones P, McCarthy CG, Watts SW, et al. Hypertension induced morphological and physiological changes in cells of the arterial wall. Am J Hypertens. 2018;31(10):1067–1078. doi: 10.1093/ajh/hpy083.
- Mancia G, Kreutz R, Brunström M, et al. ESH guidelines for the management of arterial hypertension the task force for the management of arterial hypertension of the european society of hypertension: endorsed by the international society of hypertension (ISH) and the european renal association (ERA). J Hypertens. 2023;41(12):1874–2071. doi: 10.1097/HJH.0000000000003480.
- Mariani LH, Martini S, Barisoni L, et al. Interstitial fibrosis scored on whole-slide digital imaging of kidney biopsies is a predictor of outcome in proteinuric glomerulopathies. Nephrol Dial Transplant. 2018;33(2):310–318. doi: 10.1093/ndt/gfw443.
- Bergland OU, Halvorsen LV, Søraas CL, et al. Detection of nonadherence to antihypertensive treatment by measurements of serum drug concentrations. Hypertension. 2021;78(3):617–628. doi: 10.1161/HYPERTENSIONAHA.121.17514.
- Blom KB, Bergo KK, Espe EKS, et al. Cardiovascular rEmodelling in living kidNey donorS with reduced glomerular filtration rate: rationale and design of the CENS study. Blood Press. 2020;29(2):123–134. doi: 10.1080/08037051.2019.1684817.
- Delanaye P, Cavalier E, Pottel H, et al. New and old GFR equations: a European perspective. Clin Kidney J. 2023;16(9):1375–1383. doi: 10.1093/ckj/sfad039.
- Delanaye P, Schaeffner E, Cozzolino M, et al. The new, race-free, chronic kidney disease epidemiology consortium (CKD-EPI) equation to estimate glomerular filtration rate: is it applicable in Europe? A position statement by the european federation of clinical chemistry and laboratory medicine (EFLM). Clin Chem Lab Med. 2023;61(1):44–47. doi: 10.1515/cclm-2022-0928.
- KDIGO 2012 clinical practice guideline for the evaluation and management of chronic kidney disease. Kidney Inter. 2013;3:1–150. https://kdigo.org/wp-content/uploads/2017/02/KDIGO_2012_CKD_GL.pdf]
- Levey AS, Stevens LA, Schmid CH, et al. A new equation to estimate glomerular filtration rate. Ann Intern Med. 2009;150(9):604–612. doi: 10.7326/0003-4819-150-9-200905050-00006.
- Rognstad S, Søraas CL, Bergland OU, et al. Establishing serum reference ranges for antihypertensive drugs. Ther Drug Monit. 2021;43(1):116–125. doi: 10.1097/FTD.0000000000000806.
- Ruppert D. Encyclopedia of statistical sciences. Vol. 14, 2nd ed. Hoboken (NJ): Wiley-Interscience; 2006. p. 8765–8770.
- Bender R, Lange S. Adjusting for multiple testing–when and how? J Clin Epidemiol. 2001;54(4):343–349. doi: 10.1016/s0895-4356(00)00314-0.
- Zheng W, Mu J, Chu C, et al. Association of blood pressure trajectories in early life with subclinical renal damage in Middle age. J Am Soc Nephrol. 2018;29(12):2835–2846. doi: 10.1681/ASN.2018030263.
- Johnson RJ, Herrera-Acosta J, Schreiner GF, et al. Subtle acquired renal injury as a mechanism of salt-sensitive hypertension. N Engl J Med. 2002;346(12):913–923. doi: 10.1056/NEJMra011078.
- O’Brien E, Asmar R, Beilin L, et al. European society of hypertension recommendations for conventional, ambulatory and home blood pressure measurement. J Hypertens. 2003;21(5):821–848. doi: 10.1097/00004872-200305000-00001.
- Agarwal R, Andersen MJ. Prognostic importance of clinic and home blood pressure recordings in patients with chronic kidney disease. Kidney Int. 2006;69(2):406–411. doi: 10.1038/sj.ki.5000081.
- Clement DL, De Buyzere ML, De Bacquer DA, et al. Prognostic value of ambulatory blood-pressure recordings in patients with treated hypertension. N Engl J Med. 2003;348(24):2407–2415. doi: 10.1056/NEJMoa022273.
- Dolan E, Stanton A, Thijs L, et al. Superiority of ambulatory over clinic blood pressure measurement in predicting mortality: the Dublin outcome study. Hypertension. 2005;46(1):156–161. doi: 10.1161/01.HYP.0000170138.56903.7a.
- Hansen TW, Jeppesen J, Rasmussen S, et al. Ambulatory blood pressure and mortality: a population-based study. Hypertension. 2005;45(4):499–504. doi: 10.1161/01.HYP.0000160402.39597.3b.
- Fagard RH, Van Den Broeke C, De Cort P. Prognostic significance of blood pressure measured in the office, at home and during ambulatory monitoring in older patients in general practice. J Hum Hypertens. 2005;19(10):801–807. doi: 10.1038/sj.jhh.1001903.
- Cheung AK, Rahman M, Reboussin DM, et al. Effects of intensive BP control in CKD. J Am Soc Nephrol. 2017;28(9):2812–2823. doi: 10.1681/ASN.2017020148.
- Wright JT, Jr., Bakris G, Greene T, et al. Effect of blood pressure lowering and antihypertensive drug class on progression of hypertensive kidney disease: results from the AASK trial. JAMA. 2002;288(19):2421–2431. doi: 10.1001/jama.288.19.2421.
- Klahr S, Levey AS, Beck GJ, et al. The effects of dietary protein restriction and blood-pressure control on the progression of chronic renal disease. Modification of diet in renal disease study group. N Engl J Med. 1994;330(13):877–884. doi: 10.1056/NEJM199403313301301.
- Ruggenenti P, Perna A, Loriga G, et al. Blood-pressure control for renoprotection in patients with non-diabetic chronic renal disease (REIN-2): multicentre, randomised controlled trial. Lancet. 2005;365(9463):939–946. doi: 10.1016/S0140-6736(05)71082-5.
- Yang Y, Wang Y, Gao PJ. Osteopontin associated with left ventricular hypertrophy and diastolic dysfunction in essential hypertension. J Hum Hypertens. 2020;34(5):388–396. doi: 10.1038/s41371-019-0246-3.
- Xu TY, Zhang Y, Li Y, et al. The association of serum inflammatory biomarkers with chronic kidney disease in hypertensive patients. Ren Fail. 2014;36(5):666–672. doi: 10.3109/0886022X.2014.890002.
- Stępień E, Wypasek E, Stopyra K, et al. Increased levels of bone remodeling biomarkers (osteoprotegerin and osteopontin) in hypertensive individuals. Clin Biochem. 2011;44(10–11):826–831. doi: 10.1016/j.clinbiochem.2011.04.016.
- Lorenzen JM, Neunhöffer H, David S, et al. Angiotensin II receptor blocker and statins lower elevated levels of osteopontin in essential hypertension–results from the EUTOPIA trial. Atherosclerosis. 2010;209(1):184–188. doi: 10.1016/j.atherosclerosis.2009.09.009.
- Steinbrenner I, Sekula P, Kotsis F, et al. Association of osteopontin with kidney function and kidney failure in chronic kidney disease patients: the GCKD study. Nephrol Dial Transplant. 2023;38(6):1430–1438.. doi: 10.1093/ndt/gfac173.
- Lok ZSY, Lyle AN. Osteopontin in vascular disease. Arterioscler Thromb Vasc Biol. 2019;39(4):613–622. doi: 10.1161/ATVBAHA.118.311577.
- Mamazhakypov A, Sartmyrzaeva M, Sarybaev AS, et al. Clinical and molecular implications of osteopontin in heart failure. Curr Issues Mol Biol. 2022;44(8):3573–3597. doi: 10.3390/cimb44080245.
- Fliser D, Buchholz K, Haller H, et al. Antiinflammatory effects of angiotensin II subtype 1 receptor blockade in hypertensive patients with microinflammation. Circulation. 2004;110(9):1103–1107. doi: 10.1161/01.CIR.0000140265.21608.8E.
- Alesutan I, Luong TTD, Schelski N, et al. Circulating uromodulin inhibits vascular calcification by interfering with pro-inflammatory cytokine signalling. Cardiovasc Res. 2021;117(3):930–941. doi: 10.1093/cvr/cvaa081.
- Jian L, Fa X, Zhou Z, et al. Functional analysis of UMOD gene and its effect on inflammatory cytokines in serum of essential hypertension patients. Int J Clin Exp Pathol. 2015;8(9):11356–11363. https://www.ncbi.nlm.nih.gov/pmc/articles/PMC4637676/
- Jotwani V, Garimella PS, Katz R, et al. Tubular biomarkers and chronic kidney disease progression in SPRINT participants. Am J Nephrol. 2020;51(10):797–805. doi: 10.1159/000509978.
- Garimella PS, Lee AK, Ambrosius WT, et al. Markers of kidney tubule function and risk of cardiovascular disease events and mortality in the SPRINT trial. Eur Heart J. 2019;40(42):3486–3493. doi: 10.1093/eurheartj/ehz392.
- Trudu M, Janas S, Lanzani C, et al. Common noncoding UMOD gene variants induce salt-sensitive hypertension and kidney damage by increasing uromodulin expression. Nat Med. 2013;19(12):1655–1660. doi: 10.1038/nm.3384.
- Ponte B, Sadler MC, Olinger E, et al. Mendelian randomization to assess causality between uromodulin, blood pressure and chronic kidney disease. Kidney Int. 2021;100(6):1282–1291. doi: 10.1016/j.kint.2021.08.032.
- Mikolajczyk TP, Nosalski R, Szczepaniak P, et al. Role of chemokine RANTES in the regulation of perivascular inflammation, T-cell accumulation, and vascular dysfunction in hypertension. Faseb J. 2016;30(5):1987–1999. doi: 10.1096/fj.201500088R.
- Eikendal AL, Evelein AM, Uiterwaal CS, et al. Relation between circulating inflammatory chemokines and vascular characteristics in healthy, young children. J Am Heart Assoc. 2015;4(12):e002346. doi: 10.1161/JAHA.115.002346.
- Parissis JT, Korovesis S, Giazitzoglou E, et al. Plasma profiles of peripheral monocyte-related inflammatory markers in patients with arterial hypertension. Correlations with plasma endothelin-1. Int J Cardiol. 2002;83(1):13–21. doi: 10.1016/s0167-5273(02)00021-9.
- Lefebvre E, Moyle G, Reshef R, et al. Antifibrotic effects of the dual CCR2/CCR5 antagonist cenicriviroc in animal models of liver and kidney fibrosis. PLoS One. 2016;11(6):e0158156. doi: 10.1371/journal.pone.0158156.
- Rudemiller NP, Crowley SD. The role of chemokines in hypertension and consequent target organ damage. Pharmacol Res. 2017;119:404–411. doi: 10.1016/j.phrs.2017.02.026.
- Araos P, Amador CA. Neutrophil gelatinase-associated lipocalin as an immunomodulator in endocrine hypertension. Front Endocrinol (Lausanne). 2022;13:1006790. doi: 10.3389/fendo.2022.1006790.
- Bonnard B, Ibarrola J, Lima-Posada I, et al. Neutrophil Gelatinase-Associated lipocalin from macrophages plays a critical role in renal fibrosis via the CCL5 (chemokine ligand 5)-Th2 Cells-IL4 (interleukin 4) pathway. Hypertension. 2022;79(2):352–364. doi: 10.1161/HYPERTENSIONAHA.121.17712.
- Alderson HV, Ritchie JP, Pagano S, et al. The associations of blood kidney injury molecule-1 and neutrophil Gelatinase-Associated lipocalin with progression from CKD to ESRD. Clin J Am Soc Nephrol. 2016;11(12):2141–2149. doi: 10.2215/CJN.02670316.
- Lindberg S, Jensen JS, Mogelvang R, et al. Plasma neutrophil gelatinase-associated lipocalinin in the general population: association with inflammation and prognosis. Arterioscler Thromb Vasc Biol. 2014;34(9):2135–2142. doi: 10.1161/ATVBAHA.114.303950.
- Afsar B, Covic A, Ortiz A, et al. The future of IL-1 targeting in kidney disease. Drugs. 2018;78(11):1073–1083. doi: 10.1007/s40265-018-0942-2.
- Ling YH, Krishnan SM, Chan CT, et al. Anakinra reduces blood pressure and renal fibrosis in one kidney/DOCA/salt-induced hypertension. Pharmacol Res. 2017;116:77–86. doi: 10.1016/j.phrs.2016.12.015.
- Peeters AC, Netea MG, Janssen MC, et al. Pro-inflammatory cytokines in patients with essential hypertension. Eur J Clin Invest. 2001;31(1):31–36. doi: 10.1046/j.1365-2362.2001.00743.x.
- Mauno V, Hannu K, Esko K. Proinflammation and hypertension: a population-based study. Mediators Inflamm. 2008;2008:619704. doi: 10.1155/2008/619704.
- Urwyler SA, Ebrahimi F, Burkard T, et al. IL (interleukin)-1 receptor antagonist increases ang (angiotensin [1-7]) and decreases blood pressure in obese individuals. Hypertension. 2020;75(6):1455–1463. doi: 10.1161/HYPERTENSIONAHA.119.13982.
- Urwyler SA, Schuetz P, Ebrahimi F, et al. Interleukin-1 antagonism decreases cortisol levels in obese individuals. J Clin Endocrinol Metab. 2017;102(5):1712–1718. doi: 10.1210/jc.2016-3931.
- Ebrahimi F, Urwyler SA, Straumann S, et al. IL-1 antagonism in men with metabolic syndrome and low testosterone: a randomized clinical trial. J Clin Endocrinol Metab. 2018;103(9):3466–3476. doi: 10.1210/jc.2018-00739.
- Group. F-NBW. BEST (biomarkers, EndpointS, and other tools) resource. Bethesda (MD): Food and Drug Administration (US), Silver Spring (MD); National Institutes of Health (US); 2016.
- Pennello GA. Analytical and clinical evaluation of biomarkers assays: when are biomarkers ready for prime time? Clin Trials. 2013;10(5):666–676. doi: 10.1177/1740774513497541.
- Graham C, Chooniedass R, Stefura WP, et al. Stability of pro- and anti-inflammatory immune biomarkers for human cohort studies. J Transl Med. 2017;15(1):53. doi: 10.1186/s12967-017-1154-3.
- Simpson S, Kaislasuo J, Guller S, et al. Thermal stability of cytokines: a review. Cytokine. 2020;125:154829. doi: 10.1016/j.cyto.2019.154829.
- Hosnijeh FS, Krop EJ, Portengen L, et al. Stability and reproducibility of simultaneously detected plasma and serum cytokine levels in asymptomatic subjects. Biomarkers. 2010;15(2):140–148. doi: 10.3109/13547500903340570.
- Lanteri P, Lombardi G, Colombini A, et al. Stability of osteopontin in plasma and serum. Clin Chem Lab Med. 2012;50(11):1979–1984. doi: 10.1515/cclm-2012-0177.
- Papworth K, Bergh A, Grankvist K, et al. Osteopontin but not parathyroid hormone-related protein predicts prognosis in human renal cell carcinoma. Acta Oncol. 2013;52(1):159–165. doi: 10.3109/0284186X.2012.693623.
- Woodhams B, Girardot O, Blanco MJ, et al. Stability of coagulation proteins in frozen plasma. Blood Coagul Fibrinolysis. 2001;12(4):229–236. doi: 10.1097/00001721-200106000-00002.
- Bach J, Haubelt H, Hellstern P. Sources of variation in factor VIII, von willebrand factor and fibrinogen measurements: implications for detecting deficiencies and increased plasma levels. Thromb Res. 2010;126(3):e188-195–e195. doi: 10.1016/j.thromres.2010.05.029.
- Pedersen KR, Ravn HB, Hjortdal VE, et al. Neutrophil gelatinase-associated lipocalin (NGAL): validation of commercially available ELISA. Scand J Clin Lab Invest. 2010;70(5):374–382. doi: 10.3109/00365513.2010.486868.
- Scherberich JE, Gruber R, Nockher WA, et al. Serum uromodulin-a marker of kidney function and renal parenchymal integrity. Nephrol Dial Transplant. 2018;33(2):284–295. doi: 10.1093/ndt/gfw422.
- Youhanna S, Weber J, Beaujean V, et al. Determination of uromodulin in human urine: influence of storage and processing. Nephrol Dial Transplant. 2014;29(1):136–145. doi: 10.1093/ndt/gft345.