
 ?Mathematical formulae have been encoded as MathML and are displayed in this HTML version using MathJax in order to improve their display. Uncheck the box to turn MathJax off. This feature requires Javascript. Click on a formula to zoom.
Abstract
Context: Knowledge of the droplet size distribution of inhalable aerosols is important to predict aerosol deposition yield at various respiratory tract locations in human. Optical methodologies are usually preferred over the multi-stage cascade impactor for high-throughput measurements of aerosol particle/droplet size distributions.
Objective: Evaluate the Laser Aerosol Spectrometer technology based on Polystyrene Sphere Latex (PSL) calibration curve applied for the experimental determination of droplet size distributions in the diameter range typical of commercial e-cigarette aerosols (147–1361 nm).
Materials and methods: This calibration procedure was tested for a TSI Laser Aerosol Spectrometer (LAS) operating at a wavelength of 633 nm and assessed against model di-ethyl-hexyl-sebacat (DEHS) droplets and e-cigarette aerosols. The PSL size response was measured, and intra- and between-day standard deviations calculated.
Results: DEHS droplet sizes were underestimated by 15–20% by the LAS when the PSL calibration curve was used; however, the intra- and between-day relative standard deviations were < 3%. This bias is attributed to the fact that the index of refraction of PSL calibrated particles is different in comparison to test aerosols. This 15–20% does not include the droplet evaporation component, which may reduce droplet size prior a measurement is performed. Aerosol concentration was measured accurately with a maximum uncertainty of 20%. Count median diameters and mass median aerodynamic diameters of selected e-cigarette aerosols ranged from 130–191 nm to 225–293 nm, respectively, similar to published values.
Discussion and conclusion: The LAS instrument can be used to measure e-cigarette aerosol droplet size distributions with a bias underestimating the expected value by 15–20% when using a precise PSL calibration curve. Controlled variability of DEHS size measurements can be achieved with the LAS system; however, this method can only be applied to test aerosols having a refractive index close to that of PSL particles used for calibration.
Introduction
In recent years, the use of electronic (e-)cigarettes has increased in popularity worldwide. A number of new products introduced to the market differ in terms of design features (Brown & Cheng, Citation2014) such as device size, voltage applied, liquid transportation mechanisms and the availability of various liquid formulations, all of which aim to satisfy and potentially reduce craving in adult users (Etter, Citation2010).
In brief, e-cigarettes contain a liquid formulation composed of glycerin, propylene glycol, water, nicotine and flavorings, which is transported from a cartridge through a porous material to a heating system powered by a battery. The battery power is used to heat a small amount of liquid formulation; upon cooling, an aerosol forms that is constituted by fine liquid droplets termed vapors (American Industrial Hygiene Association, Citation2014; Fuoco et al., Citation2014). Awareness of e-cigarettes has increased greatly in recent years (Pepper et al., Citation2014) together with the number of studies conducted on different aspects of e-cigarettes such as design and modeling, liquid formulation chemistry, aerosol chemistry and physics.
Though final consensus has not been reached (Caponetto et al., Citation2013; Geiss et al., Citation2015; Wagener et al., Citation2012), some studies suggest that e-cigarette products may reduce risk and offer a safer alternative (Farsalinos et al., Citation2014) to combustible cigarettes for consumers and people exposed to second-hand smoke (Colard et al., Citation2015; Czogala et al., Citation2013; Mcauley et al., Citation2012; Schripp et al., Citation2013) when liquid formulation and devices are adequately controlled and regulated (American Industrial Hygiene Association, Citation2014; Cahn & Siegel, Citation2011; Trehy et al., Citation2011). Consequently, the need to apply strict and accurate methodologies to assess e-cigarette products is essential. One important aspect to consider is the physical properties of inhalable aerosols and the representative parameter obtained from measured size distributions. Depending on the size distribution of an aerosol, some of the inhaled dose is transported further to the tracheobronchial section or to the alveolar region of the “lung” (Bernstein, Citation2004; Kane et al., Citation2010; Robinson & Yu, Citation2001). Generally, a respIIHTle aerosol (Hinds, Citation2012) has a related mass median aerodynamic diameter (MMAD) of less than 2.5 μm; at this size, more than 80% of the aerosol mass reaches the alveolar region. This crucial parameter is used to estimate the aerosol dose delivered to the lungs for toxicological evaluation.
From a regulatory standpoint, the use of the cascade impactor technique is recommended for calculating the MMAD, because it gravimetrically classifies aerosol droplets into distinct size classes and mimics deposition in the lungs (Hinds, Citation2012). The MMAD represents the unit density sphere equivalent diameter and is used to estimate dose exposure. Although this approach is appropriate for product assessment, the cascade impactor is labor-intensive and unsuitable for product development support or for screening purposes when a fast response time is required. Recently, several working groups have performed size distribution measurements using analytical instruments applied to the mainstream of conventional cigarettes and e-cigarette products (Ingebrethsen et al., Citation2012; Zhang et al., Citation2012,Citation2013). The use of real-time aerosol physical characterization techniques typically allows measurement of aerosol size distributions from which the MMAD is determined assuming the droplets are spherical. If the droplet density is correctly chosen, real-time monitoring of the aerosol mass concentration is also possible. Depending on the chemical nature of the liquid formulation contained in cartridges and the transport and vaporization mechanisms in the designed air flow, the resulting aerosol physicochemical properties may differ substantially and significantly influence the aerosol size distribution. Thus, an instrument to measure real-time aerosol size distribution is required for a broad range of sizes.
Smoke generated from combustible cigarettes and aerosols produced from e-cigarettes are composed mainly of liquid droplets because of the process of homogeneous nucleation (gas-to-liquid conversion; Cahn & Siegel Citation2011). Previous studies have revealed that variations in manufacturing methodology for combustible cigarettes led to droplet size distributions ranging from 0.2 to 0.9 μm (Geiss et al., Citation2015; Ishizu et al., Citation1977), which likely reflects the particular sampling and dilution methodology used. Consequently, the way in which an aerosol is conditioned, sampled and diluted may affect droplet sizes prior to measurement, leading to erroneous size distribution determination.
Optical instruments are generally suitable for real-time measurement of droplet size and mass concentration of commercial e-cigarette aerosols because size distributions can be measured within a few hundred milliseconds (Singh et al., Citation2006) preventing significant changes in size and concentration. Other important features of optical instruments include the ability to count individual droplets and to measure the scattering pattern representative of a single droplet over a large steric angle. As a result, the scattering pattern of each droplet can be integrated and plotted as a non-linear but monotonic droplet size-dependent function. This requires the use of calibrated mono-disperse particles or droplets to relate the integrated signal with different chosen calibrated sizes. However, as the response curve depends strongly on the refractive index and the shape of the tested calibrated particles/droplets, the related suspended particulate matter of e-cigarettes to be tested should be spherical with a refractive index comparable to that of calibrated particles/droplets.
The objective of the current study was to develop an analytical methodology using an optical Laser Aerosol Spectrometer (LAS; TSI Incorporated, Shoreview, MN) to establish a calibration procedure for the accurate measurement of puff-by-puff droplet size and mass concentration of selected commercial e-cigarettes using associated liquid formulations. In this case, we assumed that the droplets were spherical with negligible deformation (Baron et al., Citation2008; Chen et al., Citation1990). The refractive index of liquid formulations was measured and compared with that of a calibrated particle/droplet. This publication describes the steps used to obtain the size and aerosol mass concentration calibration curves, with the resulting size and mass concentration uncertainties, and gives examples of measured droplet size distributions for selected e-cigarettes using the established calibration curve.
Methods and equipment
The TSI Laser Aerosol Spectrometer 3340 (LAS; TSI Incorporated, Shoreview, MN) was used for accurate real-time monitoring of aerosol size distribution and concentration for known droplet/particle shapes within a certain range of refractive index values. The manufacturer claimed a variability of 5% at a 100 nm particle diameter. The instrument enables the scattering pattern of individual droplets to be resolved every 0.1 s using a highly focused laser beam that counts and sizes particles/droplets ranging from 0.09 to 7.50 μm in diameter. However, the resulting light scattering pattern depends not only on particle/droplet size but also on the particulate matter shape and its related optical properties such as the refractive index. Consequently, the calibration curve can be used to characterize test aerosols only when the calibrated particles/droplets used have a similar shape and refractive index to that of test aerosols.
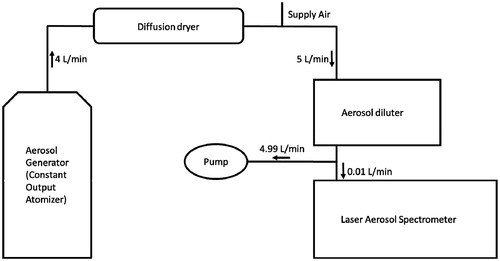
The experimental set-up used to conduct calibration tests consisted of an aerosol generation bench and a detection component. For aerosol generation, different commercial National Institute of Standards and Technology-traceable calibrated polystyrene spheres latex (PSL) (Microgenics Corp., Fremont, CA) were incorporated in ultrapure water (Millipore, Billerica, MA) to create four different stock solutions. In different experiments, each stock solution was atomized using a constant output atomizer (TSI 3076) at an inlet pressure of two bars (). The resulting aerosol was transported through a TSI black tubing to reduce electrostatic losses and dried in a TSI diffusion dryer 3062 () to remove gas phase and liquid water layers around the PSL particles. From the outlet of the diffusion dryer, dried PSL particles determined to be too concentrated were conveyed in a black conductive tubing to the entrance of the TSI aerosol diluter 3302A () prior to reaching the sensing zone of the LAS. Passage through the aerosol diluter sufficiently decreased particle concentration and allowed single-file entry of particles to sensor chamber. Consequently, an accurate low coincidence counting was achieved and scattering patterns obtained for each particle, which enabled accurate size classification.
Figure 1. Experimental set-up bench used for the Laser Aerosol Spectrometer (LAS) calibration.
To test the effect of the aerosol physical state and refractive index on the instrument’s response, liquid droplets with a different refractive index to PSL particles were used. A TSI Condensation Monodisperse Aerosol Generator 3475 (CMAG) was used to produce a Di-Ethyl-Hexyl-Sebacat (DEHS; Sigma-Aldrich, St. Louis, MO) aerosol that was controlled in size and concentration. CMAG settings recommended by the manufacturer were used to control the DEHS droplet size production, and the expected sizes were verified using a TSI Particle Aerosol Monitor 3375 (PAM) with an uncertainty of 0.1 μm. Different CMAG settings were used to produce controlled DEHS droplets, and the determination capability of the LAS was tested using the PSL calibration curve. Any bias was identified.
Polystyrene sphere latex particle calibration
Because the instrument was initially provided with a PSL calibration curve, a linear response between the measured and the PSL-determined values was expected with an absolute bias smaller than 5% according to the manufacturer (http://www.tsi.com/). However, because the instrument was transported from the manufacturer to the test facility, misalignment of the optics was possible, so a new calibration was performed upon delivery.
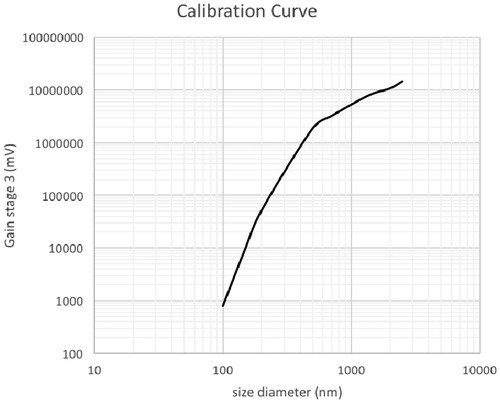
The calibration was performed using four different calibrated PSL particle sizes following the set-up shown in . The individual scattering pattern of PSL was determined and translated into the total integrated light signal intensity for each counted particle. When using PSL particles of increasing diameter, the scattering changed, and the energy was detected according to a non-linear function shown in . In the current work, this calibration curve was used to determine the particle diameter distribution of test aerosols. Because the calibration curve is key to adequately determining the size distributions of test aerosols, time was invested to obtain the best calibration for sizes ranging from 147 to 1361 nm that defines the working range of the current methodology.
Figure 2. Polystyrene Latex Sphere (PSL) calibration curve. The y-axis represents the integrated energy of the light scattered as a function of the tested PSL sizes (six sizes tested).
To determine whether the PSL calibration was performed correctly, four different PSL particle sizes were selected to verify the accuracy and the linearity of the instrument’s response using the calibration curve shown in . This verification involving five repetitions per chosen PSL size was carried out daily for three days. This determined the measurement variability and the robustness of the instrument, which demonstrated that daily calibration was unnecessary. To test the instrument response linearity, different PSL sizes were used simultaneously to determine the size distribution, and the count median diameter (CMD) was calculated and compared with supplier-provided PSL values. The linearity of the size response for each day was determined (), together with the slope, intercept and the coefficient of determination (R2) (). For each testing day, the slopes ranged from 0.99 to 1.15 with an R2 from 0.996 to 0.999, indicating excellent linearity, although the maximum slope variability was found to be 15% when compared with the theoretical expected unit value for Day 2; this difference was attributed to a lack of zero intercept value. From these measurements, the CMD general average was calculated as well as the standard deviation for each tested size (). The larger calculated relative standard deviation value was found to be 7.13% at 1361 nm.
Figure 3. LAS response as a function of supplier-provided size values for a selection of four PSL using the calibration curve shown in Figure 2. The different symbols correspond to the different testing days.
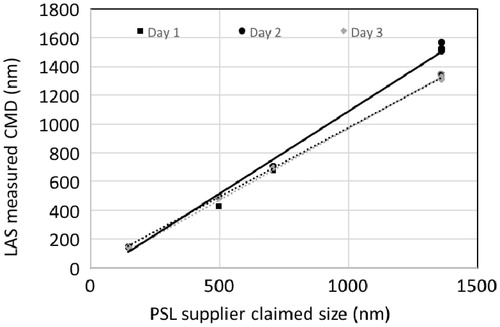
Table 1. Fitting parameters calculated from fitted LAS linear size response against PSL supplier claimed values.
Table 2. PSL calculated particle (CMD) from the measured size distribution based on the PSL calibration ().
The next step was to ensure that the LAS is capable of measuring different PSL sizes with controlled intra- and inter-day variability to avoid daily calibration. Statistical parameters, such as the intra-day standard deviation Si for Day i and the between-day standard deviation SL, were computed using equations summarized in . The calculated values () provide information on methodology variability. The intra-day standard deviation did not exceed 25 nm when considering a PSL size of 1361 nm, corresponding to a relative standard deviation of <2%. However, the between-day standard deviation varied from 0.30 to 115.98 nm when PSL sizes of 147 and 1361 nm were considered, respectively. Thus, the maximum relative standard deviation attributed to the 1361 nm PSL size is <10%, representing the variation in LAS size response during the test time period. This suggested that a new calibration should be performed monthly to adjust and fine tune the calibration curve especially in the region around 1361 nm to ensure control of between-day variability.
Table 3. Statistical parameters used to calculate intra- and between-day variance (Snedecor & Cochran, Citation1989).
Table 4. Calculated statistical parameters for the three testing days for PSL particles.
Effect of refractive index on the LAS size response using the PSL calibration curve
To determine the impact of a difference in refractive index of a calibrated aerosol on the size resolution, DEHS droplets of different sizes were produced with a TSI CMAG in separate experiments. The DEHS droplet size was determined using a TSI PAM designed to characterize DEHS aerosols while LAS measurements are conducted. To determine whether a bias is introduced in the LAS size response for DEHS droplets using the PSL calibration curve, DEHS droplet sizes measured with the LAS were plotted as a function of the PAM response and assumed to give proper values. When separating out the measured sizes on the basis of individual testing days, the linear fitting of the data points allowed the determination of the coefficient of determination, R2, which was found to be > 0.993 (). Thus, the LAS size response is linear, although the data underestimated the DEHS sizes (slope values were between 0.872 and 0.913, smaller than the expected value of 1, for the three testing days). On the other hand, the straight line displayed in represents the ideal response curve that should be theoretically found, and the dashed lines correspond to the 5% instrument variability as claimed by the manufacturer. The black dots (•) in are the PSL measured average size values; the dashed lines represent their likely distribution based on the error bars. In this case, we concluded the LAS response for PSL particles showed no bias when the PSL calibration curve was used. However, the triangle symbols (▴) in , representing DEHS droplets, revealed a clear bias because these data points did not appear between the dashed lines. This demonstrated that a 9% variation of the index of refraction can have an important effect on the LAS size response, which results in a bias of about 15-20%. This bias is attributed only to the fact that the index of refraction of PSL calibrated particles is different in comparison to test aerosols. This 15-20% does not include the droplet evaporation component which may reduce droplet size prior a measurement is performed. In fact, a change in aerosol optical properties modifies the light scattering pattern, affecting the LAS response size signal. In practice, when droplets/particles with a similar refractive index to DEHS are tested, a factor of 1.20 should be used to correct the size, based on the current experiments.
Figure 4. Measured LAS response for selected PSL particles and Di-Ethyl-Hexyl-Sebacat (DEHS) droplets as a function of expected or claimed values. Circles (•) and triangles (▴) represent averaged Count Median Diameters (CMDs) calculated for PSL and DEHS size distributions, respectively. Error bars represent the standard deviation of the data point. Dashed straight lines are upper and lower limits within which no bias is considered considering instrument uncertainty.
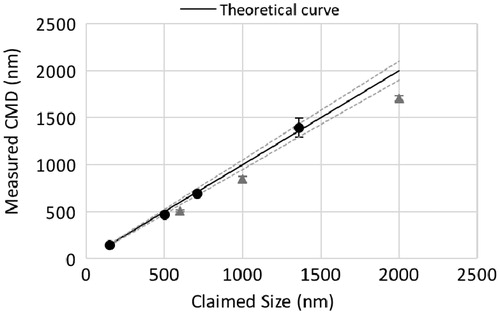
Table 5. Fitting parameters calculated from fitted DEHS linear size response against the DEHS size values measured with PAM.
To gain more information on the instrument variability related to DEHS droplets, intra- and between-day standard deviations were calculated using Equations from and are presented in . From this, the intra-day standard deviation did not exceed 10 nm when considering all tested DEHS sizes corresponding to a relative standard deviation < 2%. Moreover, the between-day standard deviation was found to vary from 9.98 to 34.21 nm when DEHS sizes of 600, 1000 and 2000 nm were considered. Thus, the maximum relative standard deviation was calculated to be < 3%. This is particularly a good result, as the intra- and between-day standard deviations were found to be similar. Consequently, the LAS size response is determined to be precise among replicates and between testing days in a size ranging from 600 to 2000 nm for DEHS droplets with a bias of 15–20% underestimation of expected size values.
Table 6. Calculated statistical parameters for the three testing days for DEHS droplets.
Calibration curve determination for aerosol mass concentration
Most aerosol characterization instruments can be calibrated by obtaining size response signals linked to the use of different PSL particles. As shown previously, the LAS size response was found to be in good agreement with the theoretical curve for PSL particles; however, for DEHS droplets, an instrumental bias of 15–20% was identified. Whether the related aerosol number concentration can accurately be measured and converted into its aerosol mass concentration is unknown. To address this point, mono-dispersed DEHS droplets of a chosen size were generated with the CMAG and sampled simultaneously on a Cambridge filter pad and in the LAS instrument. In the first step, a sustained time-dependent DEHS aerosol mass concentration was produced from the CMAG for different aerosol collection/measurement times. The related mass deposited on the Cambridge pad was determined gravimetrically and compared with the integrated LAS concentration response. From these experiments, both the mass deposited on the filter pad and the integrated LAS concentration response were seen to increase linearly with elapsed time. For each collection time, three replicates were performed. Using the known density of the DEHS (Eidhammer et al., Citation2008), the aerosol number concentration was determined and converted into the aerosol mass (AM)LAS. In , (AM)LAS was plotted as a function of the gravimetrically determined (AM)gravimetric deposited on a Cambridge filter pad.
Figure 5. Calculated aerosol mass (AM)LAS plotted as a function of the gravimetrically determined (AM)gravimetric. Triangles (▵) represent the average calculated (AM)LAS. Solid line represents the theoretical expected curve.
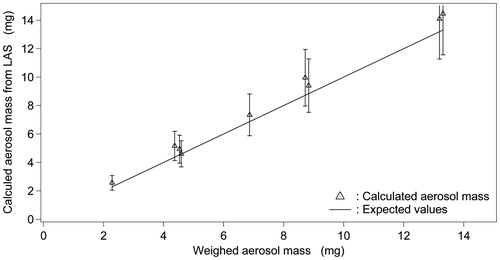
The bars in represent propagation error calculations performed for different collection times, for which a maximum error of 20% was calculated. Although the data points spread linearly, (AM)LAS values were found to be above expected values (see the straight line in ). This bias indicates that the LAS overestimates the true expected aerosol concentration that is related to the LAS internal flow rate that may be re-calibrated and re-adjusted for future studies. However, despite this overestimation, the theoretical curve overlaps with error bars, which indicates that the instrument is capable of measuring the real-time aerosol mass concentration within a 20% range of accuracy for non-evaporating droplets.
Size number distribution measurements for commercial e-cigarettes containing glycerin, propylene glycol, water and nicotine
The aim of measuring the size response of selected DEHS droplets based on PSL calibration was to verify whether adequate size distribution measurements can be obtained for aerosols with a refractive index slightly different to PSL. In the current work, from the determination of the size response of selected DEHS droplets, linear response curves were obtained, although a bias was identified with respect to the theoretical curve. E-cigarettes produce aerosols comprised mainly of propylene glycol, glycerin, water, nicotine and flavors. The index of refraction of tested commercial e-cigarettes () were measured and found comparable to the one of DEHS (nDEHS = 1.45) (Eidhammer et al., Citation2008). Here, the key hypothesis is that aerosol droplets from e-cigarettes have a refractive index near to that of DEHS; therefore, the LAS size response can be determined with a relative standard deviation < 3% and an underestimation bias of 15-20%.
Table 7. Commercially available e-cigarettes tested in the study.
To test the LAS, different marketed e-cigarettes using their own liquid formulations were used to produce aerosols using the Health Canada regimen: 55 ml puff volume, 2 s puff duration (Health Canada, Citation1999). Prior to measuring, the refractive index of each tested liquid formulation was measured and compared with DEHS, glycerin and a PSL index using an Abbe refractometer. Data on the refractive index of each tested liquid are reported in , and show a maximum relative difference of ∼1% with respect to DEHS. To conduct the tests, two different set-ups () coupled to the LAS were used to obtain droplet size distributions from which the CMD and the geometric standard deviation (GSD) were calculated as representative parameters of size distributions.
Figure 6. (a and b). Two set-ups used to determine the size distributions of selected e-cigarettes.
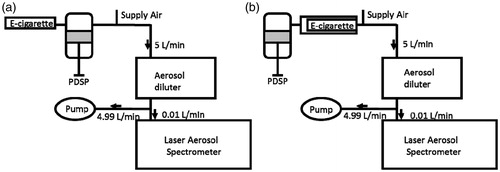
In the set-up shown in , an aerosol was produced by creating a pressure drop in e-cigarettes by pulling back the piston of a programmable dual syringe pump (PDSP). As a result, the aerosol was drawn in the cylinder housing of the PDSP piston for a puff duration of 2 s. The aerosol was immediately exhausted from the PDSP housing by the action of the piston pushing off the aerosol for a duration of 1.4 s to two TSI aerosol diluters to recover 1/10 000 of the aerosol concentration and ensuring droplets could enter one by one into the LAS detector. Indeed, although the TSI diluter should minimize droplet evaporation, e-cigarette aerosol is generally highly volatile as highlighted in other work (Alderman at al., Citation2014; Ingebrethsen et al., Citation2012; Mikheev et al., Citation2016; Schripp et al., Citation2013) and may trigger droplet size change prior to a measurement is performed. Furthermore, use of the PDSP pump increased the aerosol residence time by at least 3.4 s prior to measurement. This could have potentially led to change of the aerosol size and concentration owing to aerosol coagulation, wall deposition and evaporation. To investigate the effect of aerosol residence time prior to its detection, an in-house mono-port aerosol generation machine was developed to push air into e-cigarettes and transport the aerosol within only a few seconds in the LAS detector, as shown in .
The marketed e-cigarettes listed in were tested using the two experimental set-ups shown in , while the related aerosol size distributions were obtained. Five replicates were completed using the PDSP set-up and three for the mono-port aerosol generation machine. From the data, the CMD, GSD and MMD parameters were calculated and reported in (not corrected for the bias), and typical measured size distributions are represented in . Use of the mono-port aerosol generation machine led to size distributions spreading partially out of the instrument working size range. Consequently, MMD parameters provided in for the mono-port aerosol generation set-up can be interpreted as upper limit values.
Figure 7. Typical size distribution response obtained from the Laser Aerosol Spectrometer (LAS) when using the Programmable Dual Syringe Pump (PDSP) and the mono-port aerosol generator.
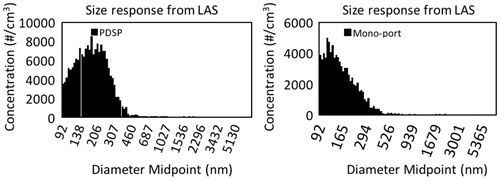
Table 8. Calculated CMD, GSD and MMAD for different tested marketed e-cigarettes.
The data obtained for the e-cigarettes tested with the mono-port aerosol generation machine were compared, and values found to be overlapping when considering the larger uncertainty of 26 nm obtained for Product A. On the other hand, the tests conducted with the PDSP set-up demonstrated that MMAD values differed for each e-cigarette, with the sequence MMD(C) < MMD(A) ≈ MMD(D) < MMD(B). MMD values were also compared for the two experimental set-ups, and a significant difference was found when considering experimental uncertainties. For all tested e-cigarettes, the use of the PDSP set-up compared with the mono-port aerosol generation machine showed that MMD values increased by 17-33% (). This underpins the importance of the aerosol residence time on the resulting measured size distributions. This difference in MMD can be attributed to the thermal coagulation and the gas vapor phase condensation/evaporation processes occurring as a result of the additional 3.4 s required to pull the aerosol in and out from the PDSP () prior to measurement.
To ensure consistency of the current results, the data were compared with previously published values from various experimental techniques. One group applied the light extinction technique for different wavelengths to obtain real-time aerosol size distribution covering a range of diameter of average mass of 272-458 nm for undiluted e-cigarette aerosols (Ingebrethsen et al., Citation2012). Another group used an electrical mobility instrument, FMPS 3091, to report droplet size modes ranging from 120 to 165 nm for e-cigarette brands containing different levels of nicotine (Fuoco et al., Citation2014). For indoor air quality application, size distributions ranged from 20 to 300 nm (Geiss et al., Citation2015); in in vitro tests, size values were between 120 and 180 nm (Zhang et al., Citation2013). Additionally, in another study, the use of a light scattering methodology allowed to obtain a Volume Median Diameter for commercial e-cigarettes of ≈ 435 nm when no dilution was applied (Cabot et al., Citation2013). However, comparison of previously published values with the current study results is not direct because various techniques have been used to measure different diameter types (e.g. aerodynamic, mobility, optical) with different dilutions and sampling times. Moreover, the chosen size representation may not be equivalent between publications. Nevertheless, when considering MMDs obtained in this work for the two tested set-ups, the size values varied from 176 to 293 nm and were found to be within the values previously reported for different size representations (20-458 nm). In this paper, the MMD representation was preferred, as this is linked to aerosol dosing applications used for in vitro and in vivo assays (Hinds, Citation2012).
Results and discussion
The established methodology was based on the use of PSL calibration to experimentally determine droplet size distributions typically found for commercial e-cigarettes in particle diameters ranging from 147 to 1361 nm. The LAS size response showed a very good linear correlation with the PSL supplier-provided size values characterized by a coefficient of determination R2 > 0.996 for three testing days with a slope varying from 0.99 to 1.15. A maximum intra-day relative standard deviation of < 2% and between-day standard deviation of < 10% was obtained, indicating that the LAS size response was consistent between days over a period of 3 weeks. Consequently, a verification of this instrument should be performed once every month to ensure that the between-day relative standard deviation remains <10%.
Depending on the nature of the tested aerosol and its related physical properties, the use of a PSL calibration curve may introduce bias to the LAS size response curve. In fact, the LAS detector size response is known to depend strongly on the aerosol optical properties. For an aerosol with a known and well-defined refractive index (Eidhammer et al., Citation2008) at room temperature such as PSL (nPSL = 1.59), the size response was found to be linear with a coefficient of determination R2 > 0.996.
The main purpose of this study was to monitor the LAS size response when choosing mono-disperse droplets with a refractive index slightly different to that of PSL particles. LAS size response data from three different DEHS sizes plotted as a function of the assumed true DEHS droplet size determined by a TSI PAM showed remarkable linearity with R2 > 0.993, although the instrument underestimated the true DEHS droplet size by 15-20% in a range from 600 to 2000 nm. This bias was attributed to the refractive index of DEHS droplets, which was ≈ 9% smaller than that of PSL particles, leading to a change in the light-scattering pattern. Intra- and between-day standard deviations were found to be equivalent, indicating a high level of precision. This showed that the measured LAS size response was repeatable between replicates and between testing days for DEHS droplets.
Because DEHS droplets can be sized with a determined bias and as e-cigarette droplets have a refractive index similar to that of DEHS (▵n ≈ 0.02), it was assumed that aerosols containing glycerin and produced from commercial e-cigarettes could be sized appropriately using the current PSL calibration by introducing a bias of 15-20% with a precision > 3%. The evaluation of marketed e-cigarettes demonstrated that elapsed time prior to aerosol measurement (residence time) impacts on the aerosol size distribution. Consequently, to obtain more accurate droplet size values, time from aerosol generation to detection should be minimized. We showed that an increase by 3.4 s of the e-cigarette aerosol residence time triggers an MMD inflation of 17-33% due to thermal coagulation and condensation.
From droplet size distribution measurements performed using the PDSP and the mono-port aerosol generator for selected e-cigarettes, CMD and MMD values were measured in the range 130-191 nm and 225-293 nm, respectively, which are comparable to published values that varied from 20 to 458 nm when different size representations were used. These results indicate that the LAS instrument can be used only when the refractive index of a test aerosol is near to that of PSL-calibrated particles. For the measurement of aerosol physical properties in cases where light absorption is important, the instrument is predicted to be unable to provide accurate and linear size responses.
Conclusions
The light-scattering system evaluated in the present study provides an accurate and precise means of measuring aerosol physical properties. However, to ensure linearity of measurements and to minimize potential bias, optical properties of the test aerosol should be similar to those of particles used to calibrate the instrument. A monthly calibration check is recommended to ensure that variability is controlled. Moreover, care should be taken to carefully control the aerosol residence time and dilution, as aerosol evolution may substantially affect the resulting aerosol size. To facilitate data comparison for e-cigarettes a consensus in the scientific community should be defined and applied to select specific experimental conditions, instrument types, aerosol conditioning, aerosol sampling, and, importantly, the selection of a size representation. This study used a systematic approach, based on PSL calibration, to determine experimental droplet size distributions in the diameter range typical of commercial e-cigarette aerosols (147-1361 nm). Knowledge of droplet size distribution is important to determine the MMD and GSD, which are key parameters in the prediction of aerosol deposition yield at different locations of the respiratory tract. This is needed for the toxicological assessment of aerosols from e-cigarettes, so is of direct relevance to the evaluation of safety and toxicity in new forms of new aerosol generation devices for use by humans.
Acknowledgements
The authors wish to acknowledge Dr Jennifer Barnes (Edanz Group Ltd) for providing editorial assistance during the preparation of this article.
Declaration of interest
All authors were Philip Morris Products S.A employees at the time of the studies which were funded by Philip Morris Products S.A.
References
- Alderman SL, Song C, Moldoveanu SC, Cole CK. (2014). Particle size distribution of e-cigarette aerosols and the relationship to Cambridge filter pad collection efficiency. Beiträge Zur Tabakforsch Intl/Contrib Tob Res 26:183–90
- American Industrial Hygiene Association. (2014). White paper: Electronic cigarettes in the indoor environment. Falls Church, VA: Indoor Environmental Quality Committee and Risk Assessment Committee, 1–34
- Baron P, Deye G, Martinez A, et al. (2008). Size shift in measurements of droplets with the aerodynamic particles sizer and aerosizer. Aerosol Sci Technol 42:201–9
- Bernstein D. (2004). A review of the influence of particle size, puff volume, and inhalation pattern on the deposition of cigarette smoke particles in the respiratory tract. J Inhal Toxicol 16:675–89
- Brown C, Cheng J. (2014). Electronic cigarettes: product characterization and design considerations. Tob Control 23:ii4–10
- Cabot R, Koc A, Yurteri CU, McAughey J. (2013). Aerosol measurement of e-cigarettes. Poster. 32nd Annual Conference, American Association for Aerosol Research, Portland, OR
- Cahn Z, Siegel M. (2011). Electronic cigarettes as a harm reduction strategy for tobacco control: a step forward or a repeat of past mistakes? J Publ Health Policy 32:16–31
- Caponetto P, Russo C, Bruno C, et al. (2013). Electronic cigarette: a possible substitute for cigarette dependence. Monaldi Arch Chest Dis 79:12–19
- Chen B, Cheng Y, Yeh H. (1990). A study of density effect of droplet deformation in the tsi aerodynamic particle sizer. Aerosol Sci Technol 12:287–5
- Colard S, O’connel G, Verron T, Cahours X. (2015). Characteristics, perceived side effects and benefits of electronic cigarette use: a worldwide survey of more than 19,000 consumers. Int J Environ Res Public Health 11:282–99
- Czogala J, Goniewicz ML, Fidelus B, et al. (2014). Secondhand exposure to vapors from electronic cigarettes. Nicotine Tob Res 16:655–62
- Eidhammer T, Montague D, Deshler T. (2008). Determination of index of refraction and size of supermicrometer particles from light scattering measurements at two angles. J Geophys Res 113:1–19
- Etter J. (2010). Electronic cigarettes: a survey of users. BMC Publ Health 10:231. doi: 10.1186/1471-2458-10-231
- Farsalinos K, Romagna G, Tsiapras D, et al. (2014). Characteristics, perceived side effects and benefits of electronic cigarette use: a worldwide survey of more than 19 000 consumers. Intl J Environ Res Publ Health 11:4356–73
- Fuoco F, Buonanno G, Stabile L, Vigo P. (2014). Influential parameters on particle concentration and size distribution in the mainstream of e-cigarettes. Environ Pollution 184:523–9
- Geiss O, Bianchi I, Barahona F, Barrero-Moreno J. (2015). Characterization of mainstream and passive vapors emitted by selected electronic cigarettes. Intl J Hyg Environ Health 218:169–80
- Health Canada. (1999). Determination of “tar” and nicotine in sidestream tobacco smoke. T-212. Available from: http://www.hc-sc.gc.ca/hc-ps/alt_formats/hecs-sesc/pdf/tobac-tabac/legisla-tion/reg/indust/method/_side-second/nicotine-eng.pdf
- Hinds WC. (2012). Aerosol technology: properties, behavior, and measurement of airborne particles. New York: John Wiley & Sons
- Ingebrethsen B, Cole S, Alderman S. (2012). Electronic cigarette aerosol particle size distribution measurements. Inhal Toxicol 24:976–84
- Ishizu Y, Ohta K, Okada T. (1977). Changes in the particle size and the concentration of cigarette smoke through the column of a cigarette. J Aerosol Sci 9:25–9
- Kane D, Asgharian B, Price O, et al. (2010). Effect of smoking parameters on the particle size distribution and predicted airway deposition of mainstream cigarette smoke. Inhal Toxicol 22:199–209
- Mcauley T, Hopke P, Zhao J, Babaian, S. (2012). Comparison of the effect of e-cigarette vapor and cigarette smoke on indoor air quality. Inhal Toxicol 24:850–7
- Mikheev VB, Brinkman MC, Granville CA, et al. (2016). Real-time measurement of electronic cigarette aerosol size distribution and metals content analysis. Nicotine Tob Res. pii: ntw128. [Epub ahead of print]. doi: 10.1093/ntr/ntw128
- Pepper J, Emery S, Ribisl K, Nt B. (2014). How U.S. Adults find out about electronic cigarettes: implications for public health messages. Nicotine Tob Res 16:1140–4
- Robinson R, Yu C. (2001). Deposition of cigarette smoke particles in the human respiratory tract. Aerosol Sci Technol 34:202–15
- Schripp T, Markewitz D, Uhde E, Salthammer T. (2013). Does e-cigarette consumption cause passive vaping? Indoor Air 23:25–31
- Singh R, Jaiswal V, Jain V. (2006). Study of smoke aerosols under a controlled environment by using dynamic light scattering. Appl Optics 45:2217–21
- Snedecor GW, Cochran WG. (1989). Statistical methods. 8th ed. Ames (IA): Iowa State University Press
- Trehy M, Ye W, Hadwiger M, et al. (2011). Analysis of electronic cigarette cartridges, refill solutions, and smoke for nicotine and nicotine-related impurities. J Liquid Chromatog Related Technol 34:1442–58
- Wagener T, Siegel M, Borrelli B. (2012). Electronic cigarettes: achieving a balanced perspective. Addiction 107:1545–8
- Zhang Y, Summer W, Chen D. (2013). In vitro particle size distribution in electronic and conventional cigarette aerosols suggest comparable deposition pattern. Nicotine Tob Res 15:501–8
- Zhang Z, Kleinstreuer C, Hyun S. (2012). Size-change and deposition of conventional and composite cigarette smoke particles during inhalation in a subject-specific airway model. J Aerosol Sci 46:34–52