
Abstract
This research investigated the effects of gluten free diet (GFD) on nutritional intake, glycaemic and insulin response. In a cross-sectional study, participants who consumed gluten-containing diet (GCD; n = 11) and GFD (n = 11) completed a food diary, blood glucose and insulin measurements. In a pre-post intervention study (n = 11), glycaemic and insulin responses were tested before and after four weeks of a GFD. Food intake was recorded before and after two weeks. No significant differences in nutrient intake, glycaemic or insulin responses were found in the cross-sectional study. In the intervention study, there was a significant reduction in body weight (p = .007) and body mass index (BMI) (p = .004) after four weeks and lower thiamine intake (p = .021) after two weeks of GFD. Glycaemic response was significantly higher (p < .05) following GFD with no differences in insulin response. These differences were not evident if GFD was followed for a longer period, possibly due to improved food choices.
Introduction
Gluten, a protein derived from wheat, rye and barley, contributes to the network formation that affects the structure, texture and rheological properties of a food (Capriles and Arêas Citation2014). The omission of gluten results in a product that has different organoleptic qualities and an altered nutritional profile. This has important implications for those who rely on a gluten-free diet (GFD) such as those with coeliac disease, which affects 1% of the population, where avoiding gluten is the only method of achieving complete remission of symptoms (NICE Citation2015). Since GC cereals provide a source of valuable nutrients, their avoidance is speculated to induce nutritional deficiencies (Lamacchia et al. Citation2014).
Based on analysis of food labels and nutrition databases, there is agreement that Gluten free products (GFP), including bread and pasta, have a higher fat content (Kulai and Rashid Citation2014; Miranda et al. Citation2014; Allen and Orfila Citation2018; Fry et al. Citation2018; Jamieson et al. Citation2018). Although fat is utilised by manufacturers to improve palatability, flavour and overall acceptance of GFP, it concurrently reduces the nutritional value and increases energy density. This is exemplified by previous research, which found that women following a GFD had a significantly higher energy intake than those who were not on a GFD (Wild et al. Citation2010; Martin et al. Citation2013). This has important implications for health as often GF labels are used to promote sales due to their perceived health benefits (Faulkner et al. Citation2014).
The evidence remains more ambiguous when considering other nutrients. Sugar is used to improve the sensory profile of GFP, however, there is no clear trend that the sugar content is higher (Fry et al. Citation2018; Jamieson et al. Citation2018). Similarly, individuals who adopted a GFD had a lower fibre intake in one study (Miranda et al. Citation2014), but this disputes the findings of others who found a higher fibre content in GFP (Kulai and Rashid Citation2014; Allen and Orfila Citation2018). GFP have been shown to be an inferior source of protein and evidence exists that those on a GFD have a lower protein intake (Kulai and Rashid Citation2014; Miranda et al. Citation2014; Missbach et al. Citation2015; Wu et al. Citation2015; Allen and Orfila Citation2018; Fry et al. Citation2018; Jamieson et al. Citation2018; Calvo-Lermaet al. Citation2019). Notably, individuals examined before and after diagnosis of coeliac disease had significant decrease in protein intake following commencement of the GFD (Shepherd and Gibson Citation2013). However, the opposite was found in a sample where 93.2% incorporated GF rendered products each day (Martin et al. Citation2013).
There have been concerns regarding the micronutrient intake of those following a GFD. In previous studies, the serum folate concentrations of GF participants were below that of the controls (Shepherd and Gibson Citation2013; Valente et al. Citation2015), and thiamine and iron levels were below the national average (Wild et al. Citation2010; Martin et al. Citation2013). This could be due to the lack of mandatory fortification of GF flours, but it raises a concern for those adopting a GFD for health gains. Dall'Asta et al. (Citation2012) found those on a GFD consumed more crackers and sweets and less fruits and vegetables, perhaps contributing to the higher intake of energy, particularly fat. GF pastas and breads have a high GI, likely due to the favourable interaction of gluten on starch digestion (Segura and Rosell Citation2011; Johnston et al. Citation2017). Furthermore, coeliac subjects were reported to have poorer glycaemic response than healthy subjects (Bacchetti et al. Citation2014). There is a need to further establish the glycaemic and insulin response of the GFD in the absence of coeliac disease where confounding factors may influence results.
The existing literature indicates discrepancies in the nutritional adequacy of a GFD, which has led to two studies. Study one aimed to evaluate the differences in nutrient intake, glycaemic response and insulin response in those who followed a GFD compared to those who consumed a GCD. Study two aimed to investigate the effect of a four-week GFD intervention on nutrient intake, glycaemic response and insulin response in those who normally consumed a GCD. We hypothesised that a GFD will result in a lower intake of micronutrients, fibre and protein and a higher intake of fat than a GCD. We also hypothesised that participants on GFD will have higher glycaemic and insulin response than those who consumed GCD.
Materials and methods
Participants and study design
Participants were recruited using posters, advertisements on social media, local websites and informal recruitment through personal networks. Interested participants were sent the relevant participant information sheet, consent form, health questionnaire and food diary. The exclusion criteria were a BMI over 30 kg/m2 or an overnight fasting blood glucose above 6.1 mmol/L. Inclusion criteria were those aged 18–60 years old with no medical condition or any medications that interfere with glucose metabolism or insulin signalling. Additionally, for study one, participants in the GFD group were required to have been adhering to the GFD for at least one month. Participants gave written informed consent before taking part in the study.
Protocol
The study protocol was approved by the Department and University Research Ethics Committees at Oxford Brookes University (UREC 181234; DREC 0419_55) according to the Declaration of Helsinki on Human Rights. Study one was a cross-sectional study in individuals who habitually followed a GFD or a GCD. Participants were tested once for glycaemic response and insulin response during an oral glucose tolerance test (OGTT). Each participant completed a 3-d weighed food diary once. Study two was a pre–post intervention study in which participants who habitually consumed GCD were asked to follow a strict GFD for four weeks. Before (week 0) and after the intervention (week 4), the participants were tested for glycaemic response and insulin response during an OGTT. Participants in study two were given a list of GF food products () to choose and include in their diet. In Weeks 0 and 2, they were asked to complete a 3-d weighed food diary to determine differences in energy and nutrient intake before and during a GFD.
Table 1. A list of foods given to the participants to choose gluten-free products in study two. (Source: Coeliac UK; www.coeliac.org.uk).
Anthropometric measurements
The evening before attending the laboratory, participants were advised to avoid the consumption of caffeine, alcohol and nicotine, avoid strenuous exercise and fast for 12 h. Their height was measured using a stadiometer (Seca Limited, Birmingham, UK) and body weight, BMI and total fat percentage were measured using the Tanita BC-418MA segmental body composition analyser (Tanita UK Limited, Yiewsley, UK). Waist circumference was measured using a standard tape. Resting blood pressure was measured using an automated sphygmomanometer (A&D Medical UA-767 Plus, Saitama, Japan) . If the eligibility criteria were met, an OGTT was commenced.
Blood glucose measurements during OGTT
Blood glucose was measured using a finger-prick blood sample with a single-use lancet system (Unistick 3, Owen Munford, Woodstock, UK). After the first two drops of blood were discarded, 5 µl blood was drawn into a micro cuvette and inserted into the glucose analyser (Glucose 201+, Hemocue AB, Sweden). Measurements were taken at 0 min (in the fasted state) and then 15, 30, 45, 60, 90 and 120 min following consumption of a glucose drink (82.4 g glucose dissolved in 200 ml of water), equivalent to 75 g of available carbohydrate. The change in blood glucose concentration was calculated by subtracting the baseline blood glucose from the measurement at each time point. The incremental area under the curve (iAUC) was calculated geometrically using the trapezoidal rule. The procedure used is an adaptation of that used by Brouns et al. (Citation2005) and falls within FAO/WHO (Citation1998) and the ISO (Citation2010) recommendations for determining glycaemic response.
Insulin measurement
At the same time points during the OGTT, 300 µl of capillary blood was collected into chilled microvette® capillary blood collection tubes (CB 300 K2E; Sarstedt Ltd, Boston, UK), which were centrifuged at 4000 rpm for 10 min to obtain 200 μl supernatant plasma (Centrifuge MC-6; Sarstedt Ltd). The plasma was stored frozen below −20 °C until insulin analysis using an enzyme-linked immunosorbent assay (Crystal Chem, Zaandam, Netherlands) and the absorbance was measured by a plate reader (Spectra Max I3, Molecular Devices, Wokingham, UK) at two wavelengths (450 and 630 nm). A four parametric curve fit was used for evaluation of the calibration curve plotted using change in absorbance of the calibrators against their corresponding insulin concentration and the trapezoidal rule was used to calculate the insulin iAUC.
Dietary assessment
Participants completed a 3-d weighed food diary, detailing the manufacturer and cooking methods of foods on two weekdays and 1 weekend day to account for potential variations in eating habits (Yang et al. Citation2014). Completed food diaries were analysed with Nutritics Version 5.094 (Nutritics Ltd, Dublin, Ireland). Adequate energy and nutrient intake was established by comparison of measured intake against the UK Dietary Reference Values (DRV) (PHE Citation2016).
Statistical analysis
Sample size in previous studies (Vici et al. Citation2016) ranged from 13 to over 100 participants. In the cross-sectional study, a sample size of 10 participants was required in the GFD and GCD groups to detect a difference in glucose iAUC of 120 mmol/l/min with a SD of 90 mmol/l/min in order to have a power of 80% with a two-sided significance level of 0.05. In the pre-post intervention study, for 80% power with a two-sided significance level of 0.05, a sample size of 11 participants was required to detect a difference in glucose iAUC of 100 mmol/l/min with a SD of 105 mmol/l/min. A difference in glucose iAUC of 100 mmol/l/min is deemed sufficient to detect a significant difference in glycaemic response (Augustin et al. Citation2015).
Statistical analysis was performed on SPSS (IBM SPSS Statistics for Windows, version 25.0. IBM Corp, Armonk, NY). Descriptive statistics were presented as mean ± standard deviation. Shapiro–Wilk Test of Normality was used to indicate the distribution of data. In study one, an independent t-test was performed for parametric data and the Mann–Whitney test was used for non-parametric data. Nominal variables were analysed using the chi-square test. In study two, normally distributed data were analysed using paired T-test and a Wilcoxon signed-rank test was used for non-parametric data. p Values of <.05 and 95% confidence intervals were accepted as significant.
Results
Participant characteristics
Study one
A total of 22 participants were enrolled in the study; 11 followed GFD and 11 followed GCD (). Overall, there was a higher proportion of women in the study (91% in the GFD group and 65% in the GCD group), although this difference was not statistically significant (p=.056 by χ2). Participants in the GFD group followed the diet for reasons including gluten intolerance (n = 2), coeliac disease (n = 1) as well as following it for its perceived health benefits or due to their own interest (n = 8). One participant in the GFD group did not consume dairy but no other dietary issues were stated. Groups were homogenous with no significant differences in age, weight, BMI, waist circumference, body fat percentage or blood pressure between the two groups (, p > .05).
Table 2. Characteristics of participants who followed Gluten-containing diet (n = 11) and Gluten-free diet (n = 11) in study one.
Study two
Eleven healthy participants (4 male and 7 female) aged 22–29 years were included in the study (). At the end of the 4-week GFD intervention, BMI and weight of the participants were significantly lower compared to the baseline (p < .05). Waist circumference, body fat percentage, fasting blood glucose, fasting plasma insulin and blood pressure changes were not statistically significant following the GFD intervention ().
Table 3. Participant characteristics (n = 11) before and after the Gluten-free diet intervention in study two.
Glucose and insulin response
Study one
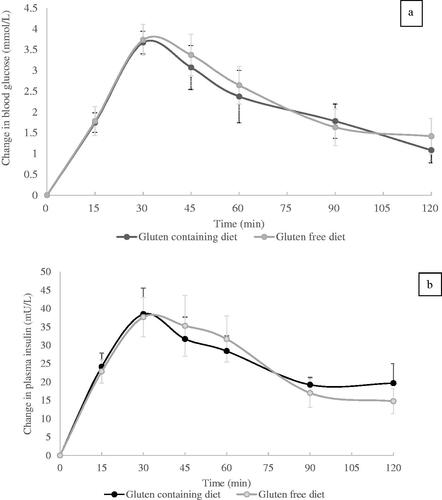
The glucose and insulin concentrations in each group peaked at 30 min after consumption of the glucose drink, with no significant difference at any time point between groups (p > .05). The mean glucose iAUC for the GCD group was 246.7 ± 130.9 mmol/l/min, not significantly different to the GFD group (265.2 ± 124.6 mmol/l/min; p = .736, 95% CI [−131.64, 94.62]; ). The mean insulin iAUC was 2761 ± 1207 mU/l/min for the participants on GCD and 2884 ± 1518 mU/l/min for the participants on GFD, p = .943, CI 95% [1202.18, 1288.13] ().
Figure 1. Change in (a) blood glucose concentration (mean ± SEM) and (b) plasma insulin concentration (mean ± SEM) in the GFD and GCD group during OGTT. GFD: Gluten free diet; GCD: Gluten-containing diet; OGTT; oral glucose tolerance test.
Study two
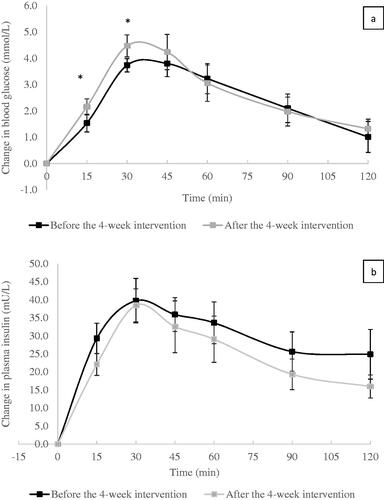
After the 4-week GFD intervention, a significant difference was noted during the OGTT, at 15 min (p = .016) and 30 min (p = .006) after the glucose drink ingestion. The iAUC for glucose response during the OGTT was 8% higher after the GFD intervention compared to the baseline (315.6 ± 168 mmol/l/min versus 292 ± 136 mmol/l/min) (). No significant difference was detected in iAUC for plasma insulin response during the OGTT session before (3473.3 ± 1514 mU/l/min) and after the GFD intervention (2869.5 ± 1439 mU/l/min; ).
Figure 2. Change in (a) blood glucose concentration (mean ± SEM) and (b) plasma insulin concentration (mean ± SEM) during OGTT before and after the 4-week GFD intervention. Asterisk (*) denotes a significant difference (p<.05). OGTT: oral glucose tolerance test; GFD: Gluten free diet.
Nutrient intake
Study one
Food diary analysis revealed that those on a GFD consumed less overall energy and nutrients (). Although the differences did not demonstrate statistical significance, the calorie intake in those on a GFD was 500 kcal below the recommended intake for females (p = .06). All the participants had fibre and carbohydrate intake below the UK DRVs (PHE Citation2016). The protein intake of both groups was above the Reference Nutrient Intake (RNIs) that is recommended for the general population. Additionally, free sugar and fat intake were below the UK recommended value in both groups. Specifically, free sugar intake was 44% below DRVs in GCD group and 61% below DRVs in GFD group (PHE Citation2016). The iron intake for both groups was below the higher, female recommended value of 14.8 mg and those who followed a GFD failed to meet the RNI for folate and thiamine whilst those in the GCD group were within the RNI for both these nutrients (PHE Citation2016).
Table 4. The average daily energy and nutrient intake for participants in the gluten-containing diet group and gluten-free diet group (study one).
Study two
After a 2-week GFD intervention, the participants presented a significantly lower thiamine intake (p=.021). Although energy, fat, protein, free sugar, sodium, calcium, iron and niacin intake was lower during the GFD, the results were not significant ().
Table 5. Nutritional intake before and after the 4-week Gluten-free diet intervention (study two).
Discussion
The two studies presented here have demonstrated that a GFD is of nutritional equity to a GCD with both diets manifesting some nutritional imbalances. Short-term changes in anthropometric characteristics and glycaemic response were observed in the population studied. The proposed hypothesis that those who follow a GFD will have a lower intake of micronutrients, fibre and protein and a higher intake of fat than those who follow a GCD is not supported by the studies. A reduced thiamine intake was noted after 2 weeks of following a GFD and following this diet for 4 weeks led to a reduced body weight and BMI, whereas longer-term adherence to a GFD did not appear to influence body weight or body composition of participants. A previous study in Australia has attributed inadequate thiamine intake in coeliac patients to the lack of availability of thiamine-fortified gluten-free foods (Shepherd and Gibson Citation2013). Although the UK legislation does not require gluten free flours to be fortified with thiamine (Allen and Orfila Citation2018), the result in this study warrants further research due to the short duration of dietary assessment. Although an acute effect of GFD was evident on glycaemic response, there was a non-significant difference in glycaemic and insulin response between the two groups that followed GFD and GCD for a longer period.
Body weight and BMI reduction observed in study two conflict previous findings (Kabbani et al. Citation2012; Tortora et al. Citation2015) that coeliac patients’ body weight and BMI increased significantly after initiating a GFD. These findings may not apply to the non-coeliac population on a GFD. However, the results agreed with significantly lower BMI and weight noted in a GFD group (Kim et al. Citation2017), potentially due to low consumption of refined carbohydrates, and a possible increase in consumption of fruits and vegetables, supporting weight-loss. Additionally, participants in study two received dietary advice and recorded their dietary intake, which have previously been shown to improve nutritional quality and assist weight-loss (Ingels et al. Citation2017).
Few studies have compared the glucose and insulin response in individuals who consume gluten and those who do not. Rather the approach has been to examine the response following ingestion of a GFP (i.e. GF pasta, bread) in healthy or coeliac subjects (Segura and Rosell Citation2011; Johnston et al. Citation2017). The hypothesis for study one was based on this evidence and the findings do not support this, suggesting that when the GFD is viewed in its entirety, the glucose and insulin response are comparable to a GCD. The results of study two, addressing the short-term effect of the GFD found a higher glucose response after a GFD intervention, which highlights the importance of food choices at different stages of adopting a new diet, which may change and improve overtime. If participants chose natural GF foods such as quinoa or buckwheat, which have been suggested as GF alternatives with a low GI (Skrabanja et al. Citation2001), they may portray a lower glycaemic and insulin response. The effect of nutritional characteristics of a product on physiological responses is emphasised here. Increasing consumer knowledge about sources of GF foods should be prioritised along with research to examine the GF diet as a whole, in order to identify if there is a risk of poorer glycaemic response, dependent on food choice.
The GF group in both studies displayed a low mean energy intake, below that of the recommended value for both males and females (Vici et al. Citation2016). The reduced food choices for individuals on a GFD may account for this as reflected in the anthropometric measurements in the studies. However, those participants who were following a GFD for a longer term did not present a difference in body weight or BMI compared to those on a GCD. Additionally, the large standard deviation of the mean energy suggests there was large variation in energy intake between participants. Dietary data that displayed a low-energy intake may have skewed data towards an overall lower mean energy and nutrient intake. It must also be considered that the findings may be influenced by under-reporting or under-eating. Differing food diary durations may account for the differences between studies however, more than 3-d, does not necessarily improve the accuracy of results as the increased burden on participants can lead to erroneous recording (Livingstone et al. Citation1990).
Previous authors have found the mean total fat intake significantly higher in those on a GFD (Dall'Asta et al. Citation2012; Miranda et al. Citation2014), reasoning that this is due to choosing high fat alternatives to achieve the same palatability of GC foods (Dall'Asta et al. Citation2012). In contrast, all participants in study one had an adequate intake of both fat and free sugar. Those in study two on a short-term GFD also did not have a significantly higher intake of these nutrients indicating that the GFD is not associated with an excessive intake of fat and free sugar. Future research should address the bias towards GF diet being one of a healthier profile when nutritional equity in terms of both fat and sugar has been observed between GFD and GCD in both short and long term.
Fibre (especially cereal and wholegrain cereal fibre) protects against chronic diseases and supports weight loss (Seal and Brownlee Citation2015). A UK-based study (Wild et al. Citation2010) found “health conscious individuals” following a GFD and a GCD failed to meet the UK recommendations of 30 g of fibre (SACN Citation2015) supporting the results of this research. Similar results were reported for both newly diagnosed and experienced GF patients where neither met the national recommendations when consuming a GFD (Shepherd and Gibson Citation2013). There has been progress in the manufacturing of GFP since fibre-rich alternative grains (quinoa, brown rice and amaranth) have been identified as ingredients (Lee et al. Citation2009). However, the evidence presented, and the current work has highlighted the possibility that an inadequate fibre intake is not specific to those who follow a GFD and is in fact, embedded within the food choices of society.
The findings of study one do not support the hypothesis that those who consume a GFD will have a significantly lower intake of micronutrients compared to those who consumed a GCD. Contrary to the above, the short-term adoption of a GFD in study two resulted in a significantly reduced intake of thiamine by the participants, albeit above the recommended intake for adults. Micronutrient deficiencies have been noted in coeliac subjects up to 10 years after diagnosis, perhaps due to continued malabsorption caused by non-adherence to the GFD or underlying pathologies (Hallert et al. Citation2002). An advantage of study one is that only one participant had coeliac disease and all others were deemed healthy individuals. This suggests that if healthy individuals adopt a GFD, they are not at an increased risk of micronutrient deficiencies than those who consume a normal diet. It must be considered that although there was no significant difference between groups, the mean intake of folate and thiamine in the participants who followed a GFD for a longer term failed to meet the recommended intake, which reflects the findings of others (Wild et al. Citation2010; Martin et al. Citation2013). Should this continue to be a recurrent finding, fortification of GFP should be considered. The current studies lack strength to drive this change but researchers should obtain a larger sample of healthy individuals on a GFD and perform nutritional analysis via biochemical laboratory testing to corroborate and strengthen these data on micronutrients.
Some limitations have been acknowledged including not assessing adherence to the GFD in both studies. Those with diagnosed coeliac disease, where strict adherence to a GFD is medically imperative, have been shown to display variable compliance rates (Hall et al. Citation2009). Therefore, in healthy participants, where consuming gluten does not have adverse health consequences, poor adherence to the diet may ensue. Furthermore, the GFD had been followed for a range of 1 month to 45 years by participants in study one. Despite this vast range, eliminating a food group for at least 30 days has been shown to affect metabolic markers; justifying these criteria and enhancing internal validity (Yao et al. Citation2013). Male participants were under represented, but as data were not separated for gender, this does not directly influence conclusions made (Engelhardt et al. Citation2007). Both studies are limited by the small sample sizes, restricting the ability to generalise to a wider population. Despite this, the findings indicate important differences that should not be overlooked and therefore, further exploration in a larger, and diverse sample, is needed.
Conclusion
A comparable nutritional intake is evident in those who follow a GFD and a GCD. Therefore, in the absence of coeliac disease or gluten intolerance, the GFD is unlikely to induce additional health benefits. However, a short-term adoption of GFD may result in reduced thiamine intake, which may become lower than the recommended intake levels in the long term. To obviate the nutritional deficiencies observed in both groups, there is a public health need to examine both diets at the individual and societal level. The results do not support the contention that following a GFD for a long period of time would result in a poorer glycaemic and insulin response; challenging the hyperglycaemic effect demonstrated after the 4-week GFD intervention and studies that have examined GFP alone. A switch to GFD may reduce energy intake and induce weight loss in the short-term due to reduced food choices. However, when compared to those who consume a GCD, the difference is less apparent in the long term. In view of increasing popularity of GFD, a larger study is needed to further challenge and substantiate its nutritional adequacy.
Disclosure statement
The authors report no conflict of interest.
Data availability statement
Data available on request from the authors. The data that support the findings of this study are available from the corresponding author [PST], upon reasonable request.
Additional information
Funding
References
- Allen B, Orfila C. 2018. The availability and nutritional adequacy of gluten-free bread and pasta. Nutrients. 10(10):1370.
- Augustin LSA, Chiavaroli L, Campbell J, Ezatagha A, Jenkins AL, Esfahani A, Kendall CWC. 2015. Post-prandial glucose and insulin responses of hummus alone or combined with a carbohydrate food: a dose–response study. Nutr J. 15(1):13..
- Bacchetti T, Saturni L, Turco I, Ferretti G. 2014. The postprandial glucose response to some varieties of commercially available gluten-free pasta: a comparison between healthy and celiac subjects. Food Funct. 5(11):3014–3017.
- Brouns F, Bjorck I, Frayn K, Gibbs A, Lang V, Slama G, Wolever T. 2005. Glycaemic index methodology. Nutr Res Rev. 18(1):145–171.
- Calvo-Lerma J, Crespo-Escobar P, Martínez-Barona S, Fornés-Ferrer V, Donat E, Ribes-Koninckx C. 2019. Differences in the macronutrient and dietary fibre profile of gluten-free products as compared to their gluten-containing counterparts. Eur J Clin Nutr. 73(6):930–936.
- Capriles VD, Arêas JAG. 2014. Novel approaches in gluten‐free breadmaking: interface between food science, nutrition, and health. Compr Rev Food Sci Food Saf. 13(5):871–890..
- Dall'Asta C, Scarlato AP, Galaverna G, Brighenti F, Pellegrini N. 2012. Dietary exposure to fumonisins and evaluation of nutrient intake in a group of adult celiac patients on a gluten-free diet. Mol Nutr Food Res. 56(4):632–640.
- Engelhardt K, Ahn BC, Cho SI, Joung H. 2007. Predictors of interest in nutrition topics and willingness to participate in local nutrition programmes. J Public Health (Oxf). 29(1):9–12.
- [FAO/WHO] Food and Agricultural Organisation/World Health Organisation. 1998. Carbohydrates in human nutrition. Report of a joint FAO/WHO expert consultation. FAO Food Nutr Pap. 66:1–140.
- Faulkner GP, Pourshahidi LK, Wallace JM, Kerr MA, McCaffrey T, Livingstone MBE. 2014. Perceived ‘healthiness’ of foods can influence consumers' estimations of energy density and appropriate portion size. Int J Obes (Lond). 38(1):106–112.
- Fry L, Madden A, Fallaize R. 2018. An investigation into the nutritional composition and cost of gluten-free versus regular food products in the UK. J Hum Nutr Diet. 31(1):108–120.
- Hall N, Rubin G, Charnock A. 2009. Systematic review: adherence to a gluten-free diet in adult patients with coeliac disease. Aliment Pharmacol Ther. 30(4):315–330.
- Hallert C, Grant C, Grehn S, Grännö C, Hultén S, Midhagen G, Ström M, Svensson H, Valdimarsson T. 2002. Evidence of poor vitamin status in coeliac patients on a gluten‐free diet for 10 years. Aliment Pharmacol Ther. 16(7):1333–1339.
- Ingels JS, Misra R, Stewart J, Lucke-Wold B, Shawley-Brzoska S. 2017. The effect of adherence to dietary tracking on weight loss: using HLM to model weight loss over time. J Diabetes Res. 2017:6951495..
- [ISO] International Standards Organisation. 2010. Food products–determination of the glycaemic index and recommendation for food classification. ISO 26642. [accessed 24 July 2019]. https://www.iso.org/obp/ui/#iso. :std:iso:26642:ed-1:v1:en
- Jamieson JA, Weir M, Gougeon L. 2018. Canadian packaged gluten-free foods are less nutritious than their regular gluten-containing counterparts. Peer J. 6:e5875.
- Johnston C, Snyder D, Smith C. 2017. Commercially available gluten-free pastas elevate postprandial glycemia in comparison to conventional wheat pasta in healthy adults: a double-blind randomized crossover trial. Food Funct. 8(9):3139–3144.
- Kabbani T, Goldberg A, Kelly C, Pallav K, Tariq S, Peer A, Hansen J, Dennis M, Leffler D. 2012. Body mass index and the risk of obesity in coeliac disease treated with the gluten-free diet. Letters to the Editors. 35(6):723–729..
- Kim H, Demyen MF, Mathew J, Kothari N, Feurdean M, Ahlawat SK. 2017. Obesity, metabolic syndrome, and cardiovascular risk in gluten-free followers without celiac disease in the United States: results from the National health and nutrition examination survey 2009–2014. Dig Dis Sci. 62(9):2440–2448.
- Kulai T, Rashid M. 2014. Assessment of nutritional adequacy of packaged gluten-free food products. Can J Diet Pract Res. 75(4):186–190.
- Lamacchia C, Camarca A, Picascia S, Di Luccia A, Gianfrani C. 2014. Cereal-based gluten-free food: how to reconcile nutritional and technological properties of wheat proteins with safety for celiac disease patients. Nutrients. 6(2):575–590.
- Lee A, Ng D, Dave E, Ciaccio E, Green P. 2009. The effect of substituting alternative grains in the diet on the nutritional profile of the gluten-free diet. J Hum Nutr Diet. 22(4):359–363.
- Livingstone M, Prentice A, Strain J, Coward W, Black A, Barker M, McKenna P, Whitehead R. 1990. Accuracy of weighed dietary records in studies of diet and health. BMJ. 300(6726):708–712.
- Martin J, Geisel T, Maresch C, Krieger K, Stein J. 2013. Inadequate nutrient intake in patients with celiac disease: results from a German dietary survey. Digestion. 87(4):240–246.
- Miranda J, Lasa A, Bustamante M, Churruca I, Simon E. 2014. Nutritional differences between a gluten-free diet and a diet containing equivalent products with gluten. Plant Foods Hum Nutr. 69(2):182–187.
- Missbach B, Schwingshackl L, Billmann A, Mystek A, Hickelsberger M, Bauer G, König J. 2015. Gluten-free food database: the nutritional quality and cost of packaged gluten-free foods. Peer J. 3:e1337.
- [NICE] National Institute of Clinical Excellence. 2015. Coeliac disease: recognition, assessment and management, NICE guideline NG20’. [accessed 23 June 2019]. https://pathways.nice.org.uk/pathways/coeliac-disease#path=view%3A/pathways/coeliac-disease/managing-coeliac-disease.xml&content=view-node%3Anodes-dietary-advice
- [PHE] Public Health England. 2016. Government recommendations for energy and nutrients for males and females aged 1–18 years and 19+ years. [accessed 6 August 2019]. https://assets.publishing.service.gov.uk/government/uploads/system/uploads/attachment_data/file/618167/government_dietary_recommendations.pdf
- [SACN] Scientific Advisory Committee on Nutrition. 2015. Carbohydrates and health. [14 June 2019]. https://assets.publishing.service.gov.uk/government/uploads/system/uploads/attachment_data/file/445503/SACN_Carbohydrates_and_Health.pdf
- Seal CJ, Brownlee IA. 2015. Whole-grain foods and chronic disease: evidence from epidemiological and intervention studies. Proc Nutr Soc. 74(3):313–319.
- Segura MEM, Rosell CM. 2011. Chemical composition and starch digestibility of different gluten-free breads. Plant Foods Hum Nutr. 66(3):224–230.
- Shepherd SJ, Gibson PR. 2013. Nutritional inadequacies of the gluten-free diet in both recently-diagnosed and long-term patients with coeliac disease. J Hum Nutr Diet. 26(4):349–358.
- Skrabanja V, Liljeberg Elmståhl HG, Kreft I, Björck IM. 2001. Nutritional properties of starch in buckwheat products: studies in vitro and in vivo. J Agric Food Chem. 49(1):490–496.
- Tortora R, Capone P, De Stefano G, Imperatore N, Gerbino N, Donetto S, Monaco V, Caporaso N, Rispo A. 2015. Metabolic syndrome in patients with coeliac disease on a gluten-free diet. Aliment Pharmacol Ther. 41(4):352–359.
- Valente FX, do Nascimento Campos T, de Sousa Moraes LF, Hermsdorff HHM, de Morais Cardoso L, Pinheiro-Sant’Ana HM, Gilberti FAB, Peluzio M. 2015. B vitamins related to homocysteine metabolism in adults celiac disease patients: a cross-sectional study. Nutr J. 14:110..
- Vici G, Belli L, Biondi M, Polzonetti V. 2016. Gluten free diet and nutrient deficiencies: a review . Clin Nutr. 35(6):1236–1241.
- Wild D, Robins G, Burley V, Howdle P. 2010. Evidence of high sugar intake, and low fibre and mineral intake, in the gluten-free diet. Aliment Pharmacol Ther. 32(4):573–581.
- Wu JH, Neal B, Trevena H, Crino M, Stuart-Smith W, Faulkner-Hogg K, Louie JCY, Dunford E. 2015. Are gluten-free foods healthier than non-gluten-free foods? An evaluation of supermarket products in Australia. Br J Nutr. 114(3):448–454.
- Yang PH, Black JL, Barr SI, Vatanparast H. 2014. Examining differences in nutrient intake and dietary quality on weekdays versus weekend days in Canada. Appl Physiol Nutr Metab. 39(12):1413–1417.
- Yao CK, Gibson PR, Shepherd SJ. 2013. Design of clinical trials evaluating dietary interventions in patients with functional gastrointestinal disorders. Am J Gastroenterol. 108(5):748–758.