
Abstract
Quantitative weight of evidence (QWoE) provides a framework and process for evaluating different toxicological studies based on quality and relevance of the results. This framework allows for data from these studies to be combined in separate lines of evidence to address causality, and relevance to environmental risks. In 2014, such a QWoE that examined the body of available company reports and peer reviewed literature regarding the effects of the herbicide atrazine on fish, amphibians, and reptiles was published. Since that time, new studies have been conducted and/or published. One of the advantages of the QWoE framework is that additional information can be added as it becomes available. Thus, these new studies were evaluated in the same manner as previously and the new data incorporated into the existing QWoE. As before, the new updated QWoE was based on the same process of objective scoring of individual studies with respect to the quality of the methods and the relevance of individual responses to the apical endpoints of survival, growth, development, and reproduction. These new data did not identify new responses or indicate any relevant effects of atrazine. The new updated QWoE analysis concluded that atrazine does not adversely affect fish, amphibians, and reptiles, at environmentally relevant concentrations (<100 µg atrazine/L), which is consistent with the previous conclusions. These new studies and data are discussed in this paper and the accompanying supplement information provides detailed and transparent information to support these conclusions.
Introduction
Since its discovery was first reported in 1957 (BCPC Citation2003), atrazine has become one of the most widely studied molecules in history. Over 60 years later experimental research evaluating the potential ecological effects is still regularly published, particularly regarding fish, amphibians, and reptiles. To date, more than 2300 studies referring to atrazine have been published in the open literature. These studies vary in test species, methods, and scientific rigor.
In 2012, a USEPA Scientific Advisory Panel convened to address the ecological risks from atrazine as an herbicide suggested that weight of evidence (WoE) be used to evaluate the studies and data on atrazine and its associated ecological risks. Based on that recommendation, a framework for quantitative and transparent WoE analysis with a focus on characterizing the quality of the science and the relevance of the observations was developed by the authors of this paper. That WoE incorporated all open literature studies available at that time and relevant studies conducted on behalf of the registrant and submitted to regulatory agencies. The results of that exercise were published (Van Der Kraak et al. Citation2014) and accompanied by an extensive and detailed assessment of the included studies in the Supplemental information (SI). Previous uses of the WoE framework were summarized in Van Der Kraak et al. (Citation2014) and since that time, the concept has been used or recommended in papers and by regulators conducting human and ecological risk assessments (Becker et al. Citation2015, Citation2017; Lutter et al. Citation2015; Rhomberg Citation2015; Acquavella et al. Citation2016; Agerstrand and Beronius Citation2016; Bridges and Solomon Citation2016; Brusick et al. Citation2016; Collier et al. Citation2016; EFSA Citation2017; Gross et al. Citation2017; LaLone et al. Citation2017; Møller and Jacobsen Citation2017; Stevenson and Chapman Citation2017; Suter et al. Citation2017; Li et al. Citation2019; Martin et al. Citation2018; Rocca et al. Citation2018; Rycroft et al. Citation2018).
Since our previous assessment (Van Der Kraak et al. Citation2014), additional studies on atrazine and its metabolites have been published and the USEPA has conducted a preliminary ecological assessment (USEPA Citation2016). The current assessment was undertaken at the request of the registrant (Syngenta LLC) to update the 2014 Quantitative Weight of Evidence (QWoE) analysis of the potential effects of atrazine on aquatic organisms. This new QWoE analysis includes papers relevant to the topic that have been recently published in the open literature, studies that have been conducted by the registrant, and submitted to regulatory authorities and a few studies that were missed in the original assessment. Here, the quality and relevance of these studies have been assessed and combined with the original QWoE analysis to provide an update.
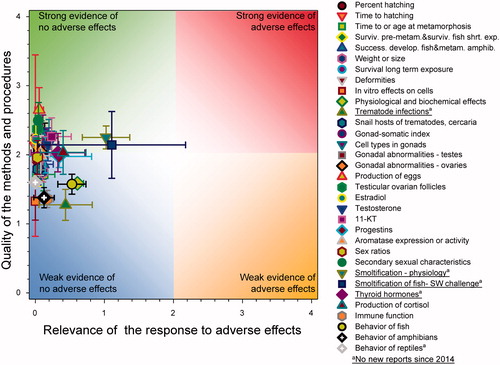
The focus of this paper was determined by the content of the new publications so not all aspects of the previous WoE (Van Der Kraak et al. Citation2014) are included. Rather than reproduce all the information in the original analysis, this evaluation built on the original QWoE, an overview diagram of the results of which is illustrated in .
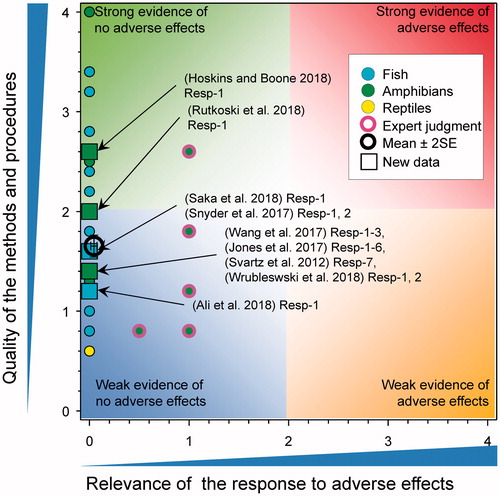
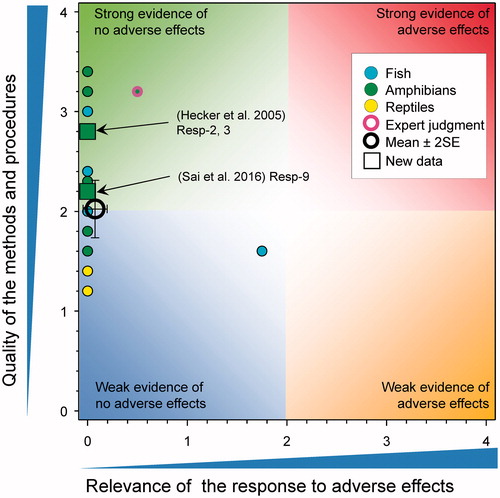
Figure 1. Summary of WoE for the updated responses for the effects of atrazine on fish, amphibians and reptiles (redrawn with data from Figure 35 in Van Der Kraak et al., Citation2014). The symbols are means and the error bars are 2 × SE of the mean (reproduced with permission).
Methods
To allow for complete integration of this QWoE with the previous work, the same methods as Van Der Kraak et al. (Citation2014) were used. The details of the scoring of the quality of the studies and the relevance of the results are outlined in the section on “Criteria for scoring relevance of the response to adverse outcomes” and the section on “Strength of the methods used in the study” on pages 6 and 7 in Van Der Kraak et al. (Citation2014). Note that, in this paper, the term “quality of methods (QoM)” is used rather than “strength of methods”. The reason for this change was to avoid confusion with the term ‘strength” which is used in the literature to refer to the combination of quality and relevance. The criteria and the scoring schemes are provided in Supplemental information (SI) in the appendices to this paper and, to ensure consistency, are exactly the same as used in Van Der Kraak et al. (Citation2014, pp. 4–8). The review process was also the same as before. An initial review of the paper by one of the authors was subjected, as before, to a quality assurance for accuracy and completeness by an independent but knowledgeable scientist and then discussed between all authors to obtain a consensus on the assignment of scores.
As before, relevance of the effects was determined by comparison to concentrations of atrazine measured in the environment in the USA and levels of concern derived from higher-tier studies in microcosms. If the LOEC for a toxicity tests was ≥100 µg/L for an exposure period ≥96 h, the response was deemed to occur at an environmentally unrealistic concentration and relevance of the observation was reduced to 0. The value of 100 µg/L was derived from four-day rolling averages determined from measurements in vulnerable watersheds in the USA (see Table 2 in Van Der Kraak et al. Citation2014). These data have been updated since 2014 and compiled in the Atrazine Ecological Monitoring Program (AEMP) dataset (USEPA Citation2017), which now includes values between 2004 and 2016 and is very robust. This dataset reflects daily or near daily monitoring of surface water from Midwestern U.S. watersheds representing the upper 80th centile of vulnerability to runoff, so is a worst-case scenario. Reanalysis of the data showed that the 99th centile daily, 4-d, 21-d, and 60-d concentrations were 53, 23, 20, and 18 µg/L, respectively. Combining the two probabilities (0.8 and 0.99) indicates that the value of 53 µg/L represents the 99.8th centile of expected concentrations across the USA. Thus, the 100 µg/L cutoff for assessing environmental relevance used in this and the previous assessment (Van Der Kraak et al. Citation2014) is very conservative and appropriate based on worst-case measured concentrations in surface water measured over the past 15 years. For the purposes of identifying smaller environmentally relevant concentrations to characterize the range of concentrations used in toxicity studies, this QWoE update continues to use the value of 20 µg/L derived from higher-tier microcosm studies evaluated in Giddings et al. (Citation2005) and in Giddings et al. (Citation2018). The individual QWoE assessments for the new papers and reports are provided in the SI in this paper.
New papers reporting on the effects of atrazine on fish, amphibians and reptiles were located by searching the literature via PubMed, CAB Abstracts (Ovid), BIOSIS (Ovid), CAPLUS (SciFinder), and Google Scholar. Search-terms were “atrazine,” “fish,” “amphibians,” and “reptiles.” The search was confined to papers published after 2014. All candidate papers were assessed to make sure that they were relevant to the questions and were not reviews or merely mentioned the search terms in the text or bibliography. In the course of the analysis, two papers overlooked during the development of the original WoE assessment were identified and analyzed. In the end, the papers included in the QWoE update are: (Chang et al. Citation2005; Hecker et al. Citation2005; Svartz et al. Citation2012; Ghodageri and Katti Citation2013; Olker Citation2014; Shenoy Citation2014; Baxter et al. Citation2015; Chen et al. Citation2015; Sai et al. Citation2015, Citation2018; Syngenta Citation2015, Citation2017a, Citation2017b; Van Der Kraak et al. Citation2015; Wirbisky and Freeman Citation2015; dos Santos Mendonça et al. Citation2016; Ehrsam et al. Citation2016; Gustafson et al. Citation2016; Khan et al. Citation2016a, Citation2016b, Citation2016c; Liu et al. Citation2016; Richter et al. Citation2016; Russart and Rhen Citation2016; Tulaby Dezfuly and Mohammadian Citation2016; Wirbisky et al. Citation2016a, Citation2016b, Citation2016c; D'Angelo and Freeman Citation2017; Du Gas et al. Citation2017; Hoskins et al. Citation2017; Jones et al. Citation2017; Khalil et al. Citation2017; Kirsten et al. Citation2017; McMahon et al. Citation2017; Persch et al. Citation2017; Scott et al. Citation2017; Shukla et al. Citation2017; Snyder et al. Citation2017; Wang et al. Citation2017; Wirbisky and Freeman Citation2017; Wirbisky-Hershberger et al. Citation2017; Ali et al. Citation2018a, Citation2018b; Araújo et al. Citation2018; Hoskins and Boone Citation2018; Knutie et al. Citation2018; Popoola Citation2018; Rimayi et al. Citation2018; Rutkoski et al. Citation2018; Saka et al. Citation2018; Walker et al. Citation2018; Wrubleswski et al. Citation2018). In addition, other papers were used in the narrative where they helped illuminate potential mechanisms, exposures, or emerging knowledge around atrazine in general.
Several papers were excluded from the QWoE. Most of these exclusions were for studies where mixtures containing atrazine were tested and causality could not be assigned because individual components were not tested separately. This is discussed in more detail in Van Der Kraak et al. (Citation2014, p. 4). A study on gonadal intersex in smallmouth bass (Micropterus dolomieu) from northern Indiana (Abdel-moneim et al. Citation2017) was excluded because the fish were exposed to a mixture of 37 compounds found above the level of detection, including atrazine. This was a field study where the fish exposures were characterized using passive samplers. It was not possible to assign causality to any one of the 37 compounds, and therefore does not aid in understanding the role of atrazine alone. A study on proteomic responses of Carassius auratus exposed to a mixture of pesticides (Gandar et al. Citation2017), which included the metabolite desethyl atrazine (but not the parent atrazine), was excluded. A study on the effects of a mixture of chemicals (including atrazine) on farmed crocodiles (Crocodylus niloticus) (Arukwe et al. Citation2016) was excluded.
A study of the effects of formulated atrazine on various physiological and biochemical response in the fish Clarias gariepinus (Popoola Citation2018) was excluded because the purity of the test substance and neither nominal nor measured concentrations in the exposure solution were reported, so assessment was not possible. This paper was also published in a non-peer-reviewed journal.
Finally, two papers (Hosmer et al. Citation2017) and (Brain et al. Citation2018) were excluded to avoid double-counting because they are based on based on GLP reports (Syngenta Citation2015, Citation2017a, Citation2017b), which were assessed in the previous QWoE assessment (Van Der Kraak et al. Citation2014).
The graphical presentation of the scores for quality and relevance for each response are based on the diagrams used in Van Der Kraak et al. (Citation2014). To differentiate the new data from the previous WoE, the data points from the new studies are shown as large squares while the data points from the previous studies are shown as small circles. This allows the new data to be placed in the context on the previous WoE. See the SI for Van Der Kraak et al. (Citation2014) to identify the origin of the responses from the previous WoE analysis. Except for the graphic on physiological responses, the new data points are labeled with the reference and the response number (see the SI for this paper). Similar labels for the physiological responses are provided in the SI.
Each of the data points on the graph represents a single response from one study. Some data points overlap, in which case the response numbers are noted in the figure. The mean value (indicated with a large hollow circle) summarizes the scores for the quality of the study and the relevance of the observations for all the data, old and new. The caption for the figure provides the total number of responses assessed. The total number of responses assessed in the combined old and new data was 1611. As before (Van Der Kraak et al. Citation2014), the mean score for relevance was used to test the hypothesis of causality (that atrazine, at concentrations commonly found in the environment, did not cause effect “x”). If the mean score for relevance was <1, the hypothesis was considered not falsified. If the mean score was >1 < 3, we considered that there was equivocal evidence that the null hypothesis was not falsified. When the score was ≥3, the null hypothesis was considered falsified. A further qualifier related to uncertainty (SE of the mean score) was noted in the text where this was ≥ mean score, suggesting that the scores were not normally distributed.
Direct effects of atrazine on development
Hatching of eggs in fish and amphibians
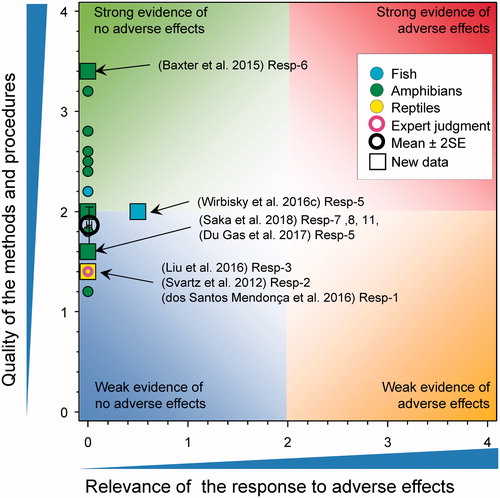
There were several studies that included hatching success as part of their assessment for fish and amphibians. The scores for quality of methods ranged from 1.4 to 3.4 with no significant impacts reported ().
Figure 2. WoE analysis of the effects of atrazine on hatching in fish, amphibians, and reptiles. Redrawn with data from Van Der Kraak et al. (Citation2014) with new data added and included in the mean and 2 × SE of the scores. Data points from the new studies are shown as large squares while the data points from the previous studies are shown as small circles. Number of responses assessed = 36. Symbols may obscure others, see SI for this paper and Van Der Kraak et al. (Citation2014) for all responses. No data points were obscured by the legend.
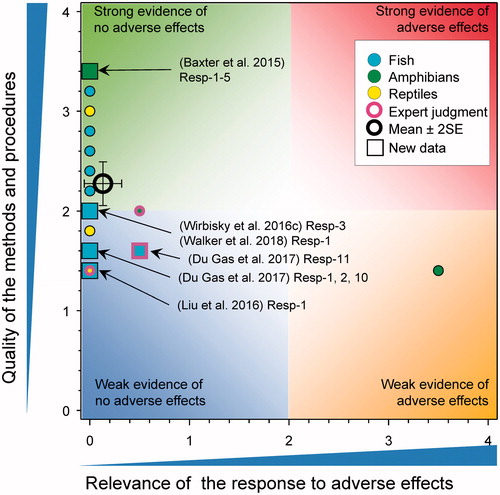
A laboratory study characterized the response of the yellow-spotted salamander (Ambystoma maculatum) exposed to atrazine from the egg to hatch (upwards of 66 d of exposure) (Baxter et al. Citation2015). This salamander has a unique endosymbiotic relationship with a green alga (Oophila amblystomatis) whereby the algae colonize the individual salamander eggs, enhancing overall hatching rate of the host salamander (see Kerney Citation2011). It is a reasonable hypothesis that atrazine could have impacts on the host salamander via indirect mechanisms through inhibition of algal growth. A previous study with whole egg masses of A. maculatum exposed to atrazine had reported significant effects (Olivier and Moon Citation2010 which was included in the WoE of 2014). This new study addressed some the methodological issues (e.g. use of formulated product, lack of analytical confirmation, malfunction of growth chambers) that characterized the previous work by Olivier and Moon (Citation2010). Baxter et al. (Citation2015) reported no observed statistically significant changes in stage, length, hatch success, and cumulative hatch at any exposure of atrazine tested. Additionally, Baxter et al. (Citation2015) isolated the endosymbiotic algae (Oophila spp.) from an egg mass and tested the response of the algae alone to atrazine. They observed similar 96-h EC50s as reported previously (see Baxter et al. Citation2014) for the isolated algae tested under a modified EPA testing protocol (growth rate 96 h-EC50s with standard error of 284 ± 50 versus 299 ± 50 μg/L, respectively) with full recovery within 4 d of exposure being removed. Overall, the hypothesis that atrazine impairs the algae with cascading effects on the host salamander’s embryonic development at concentrations found in the environment was not supported by the whole egg mass tests or isolated algal toxicity testing. These studies refute the effects reported by Olivier and Moon (Citation2010), which in the previous WoE had been deemed weak evidence of adverse effects.
There were three studies that examined the effects of atrazine on hatching of zebrafish (Danio rerio). Liu et al. (Citation2016) reported no statistically significant impact on zebrafish hatching following exposure to atrazine and its degradates, diaminochlorotriazine (DACT), deisopropylatrazine (DIA), and deethylatrazine (DEA) for 72 h at concentrations of 30, 100, and 300 μg/L. Wirbisky et al. (Citation2016c) reported no change in hatching success of zebrafish embryos from adult zebrafish that were previously exposed to atrazine at 0, 0.3, 3, and 30 µg/L from 1 through 72 h post fertilization. Adverse effects on hatching of zebrafish was reported only at a concentration of 1078 µg atrazine/L and not below (Walker et al. Citation2018). A study on the effects of formulated atrazine on hatching and successful emergence of sockeye salmon (Oncorhynchus nerka) from gravel showed no effects on these endpoints at concentrations up to 250 µg/L (Du Gas et al. Citation2017). However, time to hatch was shortened at the unrealistic concentration of 250 µg atrazine/L only. Time to emergence from gravel was shortened at 50 and 250 µg atrazine/L, but as formulated product was used it was not possible to assign causality and a reduced score for relevance was assigned.
Overall, there was little evidence that atrazine impaired hatching of fish and amphibians. The updated mean score for relevance was 0.14 ± SE 0.10 and the updated mean score for quality was 2.24 ± SE 0.11. As the combined mean score for relevance was <1, the null hypothesis of causality was not falsified.
Time to hatching in amphibians
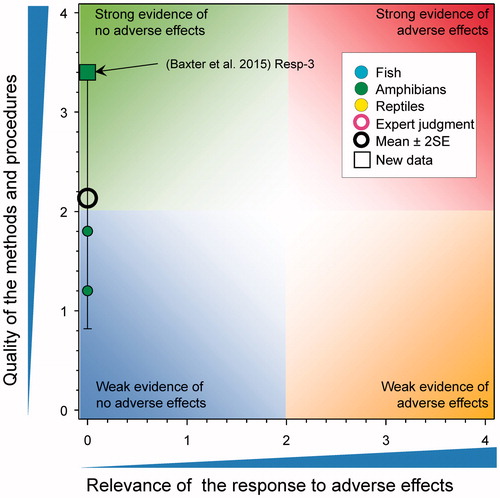
Only one study reported new data on the time to hatch for amphibians. Baxter et al. (Citation2015) characterized the response of the yellow-spotted salamander (Ambystoma maculatum) exposed to atrazine as whole egg masses till hatch over a range of concentrations (0, 3, 10, 30, 100, and 300 μg/L) following upwards of 66 d of exposure. They reported no significant change in the days to hatch for A. maculatum at any of the tested exposures. The variance of the quality of the methods for time to hatch is large (), mainly because of the small number of studies (3) and wide range of quality.
Figure 3. WoE analysis of the effects of atrazine on time to hatching in amphibians in fish, amphibians, and reptiles. Redrawn with data from Van Der Kraak et al. (Citation2014) with new data added and included in the mean and 2 × SE of the scores. Number of responses assessed = 3. Symbols may obscure others, see SI for this paper and Van Der Kraak et al. (Citation2014) for all responses. No data points were obscured by the legend.
Overall, there was no evidence that atrazine delays hatching of amphibians. The updated mean score for relevance was 0.00 ± SE 0.00 and updated mean score for quality was 2.13 ± SE 0.66. As the combined mean score for relevance was <1, the null hypothesis of causality was not falsified.
Time to, or age at metamorphosis in amphibians
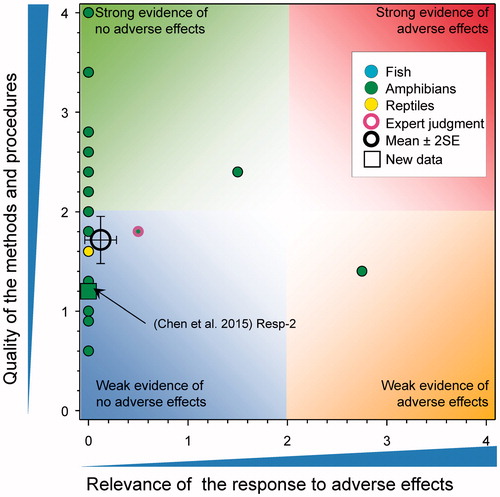
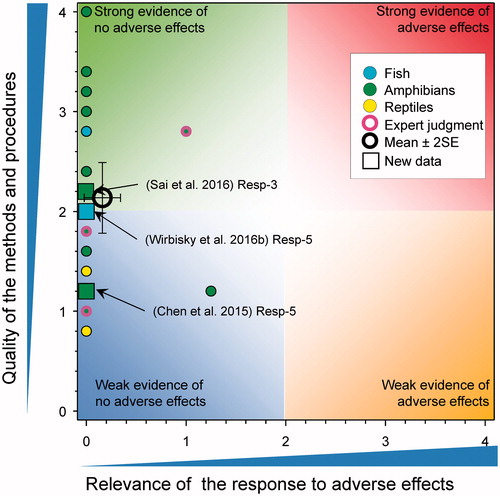
There was a single new study (score for quality of methods of 1.2) that reported responses related to time to metamorphosis (). Chen et al. (Citation2015) exposed Xenopus laevis tadpoles to a single concentration of atrazine (measured value reported as 104–105 μg/L) for 120 d. The time to complete metamorphosis was reported as being significantly greater in atrazine exposed animals relative to control (35.8 versus 34.2 d, respectively, an increase of <5%). As the tested concentration was >100 μg/L, the score for relevance was reduced to 0; however, if the exposure concentrations had been just less than 100 µg/L, relevance would have been low because of the small difference between the control and test groups and this would not have influenced the mean score greatly.
Figure 4. WoE analysis of the effects of atrazine on time to time to, or age at metamorphosis in amphibians or time to hatch in reptiles. Redrawn with data from Van Der Kraak et al. (Citation2014) with new data added and included in the mean and 2 × SE of the scores. Number of responses assessed = 39. Symbols may obscure others, see SI for this paper and Van Der Kraak et al. (Citation2014) for all responses. No data points were obscured by the legend.
Overall, there was little evidence that atrazine caused delayed hatching of amphibians. The updated mean score for relevance was 0.12 ± SE 0.08 and the updated mean score for quality was 1.72 ± SE 0.12. As the combined mean score for relevance was <1, the null hypothesis of causality was not falsified.
Survival of fish and amphibians after short-term exposures to atrazine
There were several new studies that included mortality as part of their assessment for fish and amphibians (). The frog Physalaemus gracilis was exposed to atrazine as the formulated product under laboratory conditions for 96 h with a reported LC50 of 229,430 µg/L (score for quality of methods was 2) (Rutkoski et al. Citation2018). As the response was observed at >100 μg/L, the score for relevance was reduced to 0.
Figure 5. WoE analysis of the effects of atrazine on survival of fish, amphibians, and reptiles after short-term exposures. Redrawn with data from Van Der Kraak et al. (Citation2014) with new data added and included in the mean and 2 × SE of the scores. Number of responses assessed = 157. Symbols may obscure others, see SI for this paper and Van Der Kraak et al. (Citation2014) for all responses. No data points were obscured by the legend.
The American toad (Anaxyrus americanus) and gray tree frog (Hyla versicolor) tadpoles were exposed to atrazine for 48-h at 10, 50, 250, or 1250 μg/L under laboratory conditions (Snyder et al. Citation2017) (quality of methods for both experiments was 1.8). No mortality was observed in any of the tested concentrations for either species, making the score for relevance 0.
The western clawed frog Xenopus tropicalis (reported as Silurana tropicalis) were exposed to atrazine in the laboratory as tadpoles (score for quality of methods was 1.6) (Saka et al. Citation2018). The reported 24-, 48-, 72-, and 96-h LC50s were 19,200, 12,900, 11,000, and 9,620 µg/L, respectively. As responses were observed at >100 μg/L, the score for relevance was reduced to 0. In a study in which embryos of the frog Physalaemus cuvieri were exposed to very large concentrations of formulated atrazine (3000–55,000 µg/L for 4 d) and (240–2400 µg/L for 7 d) mortality was observed at concentrations >240 µg/L (Wrubleswski et al. Citation2018). Because all concentrations tested were >100 µg/L, the score for relevance was reduced to 0.
A study by Jones et al. (Citation2017) examined the response of a mixture of herbicides, including atrazine, and the responses in six species of frogs, with and without Batrachochytrium dendrobatidis (Bd) exposure. American toads (Anaxyrus americanus), western toads (Anaxyrus boreas), spring peepers (Pseudacris crucifer), Pacific treefrogs (Pseudacris regilla), leopard frogs (Lithobates pipiens), and Cascades frogs (Rana cascadae) were exposed atrazine (measured 3.9 μg/L) as part of a four compound herbicide mixture with and without B. dendrobatidis (Bd) over a 14-d period under laboratory conditions (score for quality for methods for all experiments was 1.4). For all species tested, there was no statistically significant effect of the mixture on survival, nor a significant interaction with Bd, making the score for relevance 0. In a separate study, tadpoles of the South American Toad (Rhinella arenarum) were exposed to atrazine (1000–40,000 µg/L) for 24 h at the blastula stage (S4) (Svartz et al. Citation2012), development of the neural plate (S13), muscular activity (S18), gill circulation (S20), opercular folds (S23), and complete operculum (S25) stages and monitored for 7 d. Lethality was observed only at concentrations ≥20,000 µg/L 7 d following exposure. Data on mortality were not reported and no LCx values or statistics were reported, but the results are assumed to be significant. As responses were observed at >100 μg/L, the score for relevance was reduced to 0 and the score for quality of methods was 1.4.
The fish Luciobarbus esocinus (commonly called a mangar) was exposed as fingerlings to atrazine as the commercial formulation (score for quality of methods was 1.2) (Tulaby Dezfuly and Mohammadian Citation2016). The reported LC50 values were 110,000, 56,000, 48,000, and 44,000 µg/L for 24, 48, 72, and 96 h of exposure, respectively. As responses were observed at >100 μg/L, the score for relevance was reduced to 0.
Zebrafish (Danio rerio) embryos exposed to atrazine at 3 and 30 µg/L for 72 h (score for quality of methods was 1.6) had no reported effect on survival (Wirbisky-Hershberger et al. Citation2017). In another study with zebrafish (Wang et al. Citation2017), exposed embryos, larvae, and juveniles to atrazine under laboratory conditions (score for quality of methods was 1.4). The 48 h LC50s were for embryos, larvae, and juveniles were 98,500, 27,400, and 10,100 µg/L, respectively. The 96 h LC50s were for embryos, larvae, and juveniles were 34,200, 15,600, and 6,100 µg/L, respectively. As responses were observed at >100 μg/L, the score for relevance was reduced to 0. Finally, embryos of Danio rerio were exposed to atrazine for 132 h post-fertilization (hpf) nominal concentrations of 216, 431, 647, 863, and 1078 µg/L under laboratory conditions (Walker et al. Citation2018) (score for quality of methods was 2). At 5.5 d post hatch survivorship was significantly reduced at all concentrations ≥216 µg/L (from approximately 75% in controls, to 50–60% in exposure treatments). As responses were observed at >100 μg/L, the score for relevance was reduced to 0.
The fish snow carp (Schizothorax plagiostomus) was exposed to atrazine as the formulated product at nominal concentrations of 50,000, 100,000, and 150,000 µg/L for 24, 48, and 72 h (Ali et al. Citation2018a) (score for quality of methods was 1.2). Atrazine was reported as being toxic at all concentrations tested and at all time points and was assumed to be statistically significant. As responses were observed at >100 μg/L, the score for relevance was reduced to 0.
Overall, there was no evidence that short term exposure to atrazine caused mortality in fish or amphibians. The updated mean score for relevance was 0.04 ± SE 0.02 and the updated mean score for quality was 1.65 ± SE 0.06. As the combined mean score for relevance was <1, the null hypothesis of causality was not falsified.
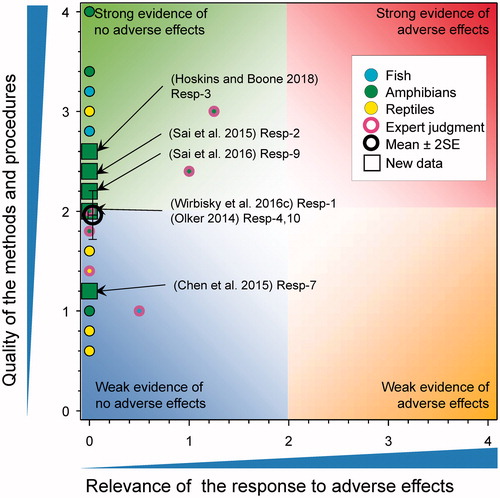
Survival of fish and amphibians after long-term exposures to atrazine
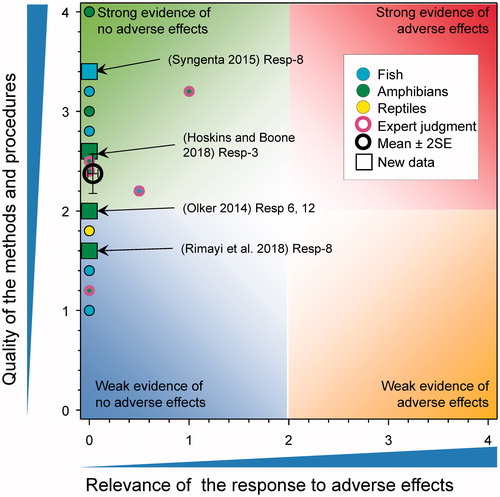
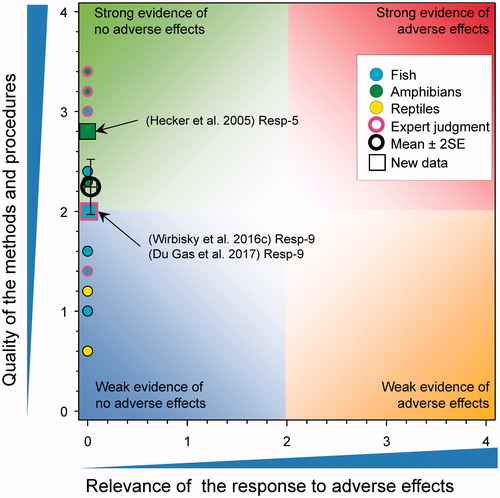
There were eight new studies reporting survival of amphibians following exposure to atrazine (). Ehrsam et al. (Citation2016) reported no significant mortality of tadpoles of Cuban tree frogs (Osteopilus septentrionalis) exposed to 178 μg/L of atrazine for 7-d. Chen et al. (Citation2015) reported that exposure of X. laevis tadpoles to atrazine reduced survival (90% controls versus 73% for atrazine treated; p = 0.008) following measured exposures of 104–105 μg/L for 120 d. As the tested concentration was >100 μg/L, the score for relevance was reduced to 0. Hoskins and Boone (Citation2018) exposed Blanchard's cricket frogs (Acris blanchardi) to atrazine as the formulated product at 0.1, 1, and 10 µg/L from Gosner Stage 25 to metamorphosis (ca. 60 d) under controlled laboratory conditions (score for quality of methods was 3). No significant differences in overall survival at study termination, survival to metamorphosis, or survival to tail re-absorption were reported. Rutkoski et al. (Citation2018) exposed the larvae of Physalaemus gracilis to atrazine as the formulated product for 7 d (score for quality of methods was 2). Stages-19 to -25 were exposed to 16 concentrations (450, 1000, 1700, 8500, 10,000, 25,000, 50,000, 60,000, 70,000, 80,000, 115,000, 125,000, 135,000, 145,000, 155,000, and 165,000 µg/L). All larvae died in concentrations ≥135,000 µg/L but there were no effects observed at the 12 concentrations less than this value. As mortality was only were observed at ≫100 μg/L, the score for relevance was reduced to 0 (see SI). Rimayi et al. (Citation2018) exposed adult male and tadpoles of African clawed frog (Xenopus laevis) to atrazine for 90 d under laboratory conditions at concentrations of 0.01, 200, and 500 µg/L (score for quality of methods was 1.6). Mortality of adult males was not reported at any tested concentration. There was 70% mortality in the tadpoles exposed to 500 µg/L, which was statistically significant, and 3.3% mortality at 200 µg/L, which was not different from control. As responses were observed at >100 μg/L, the score for relevance was reduced to 0.
Figure 6. WoE analysis of the effects of atrazine on survival of fish, amphibians, and reptiles after long-term exposures. Redrawn with data from Van Der Kraak et al. (Citation2014) with new data added and included in the mean and 2 × SE of the scores. Number of responses assessed = 36. Symbols may obscure others, see SI for this paper and Van Der Kraak et al. (Citation2014) for all responses. No data points were obscured by the legend.
Long-term (90-day) exposure of the developing larvae of X. laevis to atrazine at 0.1.1, 10, 100 µg/L resulted in significant mortality. No data were provided but the authors reported that “The results indicated AZ at 0.1, 1, 10, and 100 µg/L for 90 d causes pressure to survival of X. laevis.” (Sai et al. Citation2016); the score for relevance was 1.75 (see SI). A similar study (85-day exposure) of tadpoles of the frog Bufo bufo gargarizan resulted in mortality ranging from 20% at 0.1 µg/L to 30% at 100 µg/L (Sai et al. Citation2015). This response received a score of 3 for relevance (see SI); however, the results are inconsistent with other observations in X. laevis () and are unexpected for B. b. gargarizan. Water-quality parameters and husbandry were not well reported so it was not possible to preclude other possible causes.
Saka et al. (Citation2018) exposed Western clawed frogs (X. tropicalis and described as Silurana tropicalis in the paper) to atrazine for 26–28 d at 100 and 1000 μg/L under laboratory conditions (score for quality of methods was 1.6). Mortality at test termination was 27% (8/30 individuals) at 1000 μg/L. There was no formal statistical test reported as being performed but is assumed that this response is statistically significant. No mortality was reported for 100 µg atrazine/L. As responses were observed at >100 μg/L, the score for relevance was reduced to 0.
Svartz et al. (Citation2012) exposed South American toad (Rhinella arenarum) to atrazine for 14 d (336 h) from early blastula to complete operculum stage (5000, 10,000, 15,000, 20,000, and 30,000 µg/L) and from early complete operculum stage up to late complete operculum stage (1000–30,000 µg/L). They also exposed toads for 45 d (1080 h) from completed back legs (S28) until completion of metamorphosis (1000–30,000 µg/L). When exposed for 45 d (1080 h) from completed back legs (S28) until completion of metamorphosis, lethality was observed only at concentrations >20,000 µg/L after 10 d of exposure with 100% mortality by day 27. As responses were observed at >100 μg/L, the score for relevance was reduced to 0; the score for Quality of Methods was 1.4.
A PhD thesis was also scored as part of this exercise. Olker (Citation2014) exposed R. pipiens and R. sylvatica to atrazine in outdoor mesocosms at concentrations of 0.1, 20, and 200 μg/L from Gosner stage 26 until the end of metamorphosis (the score for quality of methods was 2 for both experiments). For R. pipiens, there was no effect of atrazine on survival at any treatment. For R. sylvatica, atrazine had a significant negative effect on survival (F 3,44 = 5.71, p = 0.0022), with lowest survival among individuals exposed to 200 μg/L. As responses were observed at >100 μg/L, the score for relevance was reduced to 0.
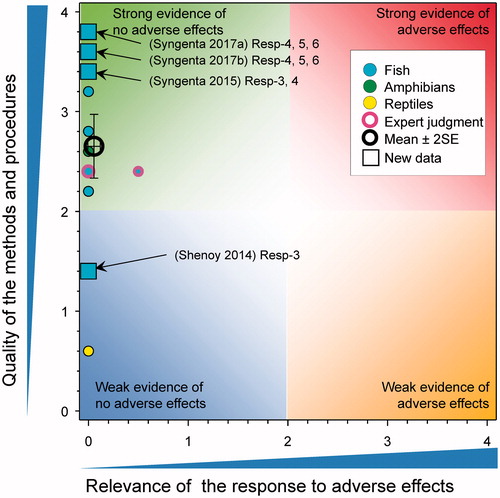
There were six new studies where mortality in fish (Oryzias latipes, Poecilia reticulata, D. rerio, and C. carpio) was monitored during and following exposure to atrazine with quality of methods scores of 3.4, 1, 2, and 0.8, respectively. The survival of Japanese Medaka (O. latipes) after exposures to atrazine at 0, 0.6, 5.5, and 53 μg/L for 35 d was not reduced, with survival reported as 100, 100, 97.5, and 97.5%, respectively (Syngenta Citation2015). A study by Shenoy (2014) exposed female guppies (P. reticulata) to atrazine for 6–88 d at 1 and 15 μg/L with no significant mortality associated with exposure reported. As well, no mortality of juvenile guppies conceived and birthed at 1 and 15 μg/L over approximately 13 months was reported. Wirbisky et al. (Citation2016c) exposed zebrafish (D. rerio) embryos to atrazine at 0, 0.3, 3, and 30 µg/L from 1 through 72 h post fertilization and then examined the developmental effects on the offspring produced by the resulting adults. In this study, no effects on survival of the embryos were reported. In a GLP study where breeding pairs of adult Japanese medaka were exposed for 28 d to atrazine at measured concentrations of 9.4, 48, 74, 97, and 244 µg/L there was no effect on survival (Syngenta Citation2017b). A similar GLP study reported no effects on survivorship for fathead minnow males and females exposed for 28-d to atrazine at measured concentrations of 1.0, 10, 26, 52, and 105 µg/L (Syngenta Citation2017a). Finally, Khalil et al. (Citation2017) exposed common carp (Cyprinus carpio) exposed to atrazine (428 μg/L) for 40 d under laboratory conditions with no mortality reported (score for quality of methods was 0.8).
Overall, there was little evidence that long-term exposure to atrazine caused mortality of fish and amphibians. The mean combined score for relevance was 0.15 ± SE 0.1 mean score for quality was 2 ± SE 0.13. As the combined mean score for relevance was <1, the null hypothesis of causality was not falsified.
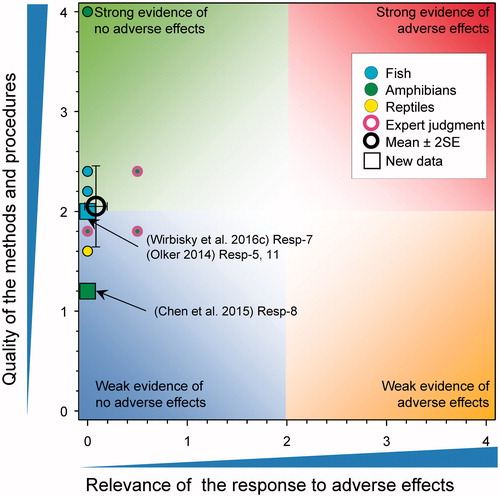
Successful development in fish and metamorphosis in amphibians
There were five new studies that reported on this response (). This included a study on the numbers of breeding pairs of zebrafish Danio rerio, developing from larvae exposed to 0.3, 3, and 30 μg atrazine/L from d-1 through 3 post fertilization (Wirbisky et al. Citation2016c) and a second study with Poecilia reticulata that reported the time to first brood in fish exposed from 6 to 88 d at 1 and 15 μg atrazine/L (Shenoy Citation2014). The study by (Wirbisky et al. Citation2016c) reported a reduction in the number of breeding pairs of zebrafish in the group previously exposed to 30 μg atrazine/L. The score for relevance of the study on zebrafish was reduced from 2.25 to 0 because, in this study this response was only observed at the greatest concentration, did not translate to a change in the number of embryos per breeding pair, total number of embryos, or percent hatch at 72 h. Time to first brood in guppies was not affected by atrazine exposure (Shenoy Citation2014).
Figure 7. WoE analysis of the effects of atrazine on successful development in fish and metamorphosis in amphibians. Redrawn with data from Van Der Kraak et al. (Citation2014) with new data added and included in the mean and 2 × SE of the scores. Number of responses assessed = 41. Symbols may obscure others, see SI for this paper and Van Der Kraak et al. (Citation2014) for all responses. No data points were obscured by the legend.
The updated mean score for relevance was 0.12 ± SE 0.07 and the mean score for quality was 1.86 ± SE 0.11. As the combined mean score for relevance was <1, the null hypothesis of causality was not falsified. Overall, the weight of evidence does not show that atrazine causes adverse effects on development in fish and amphibians.
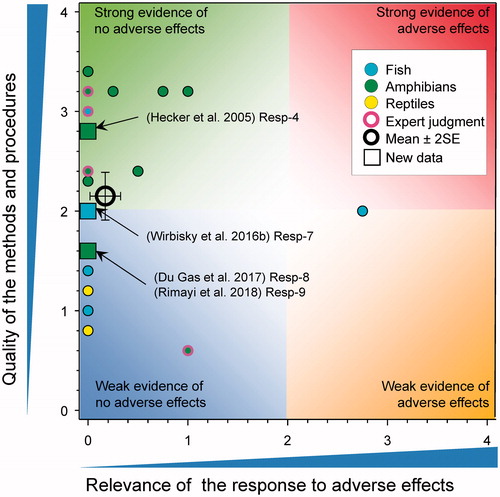
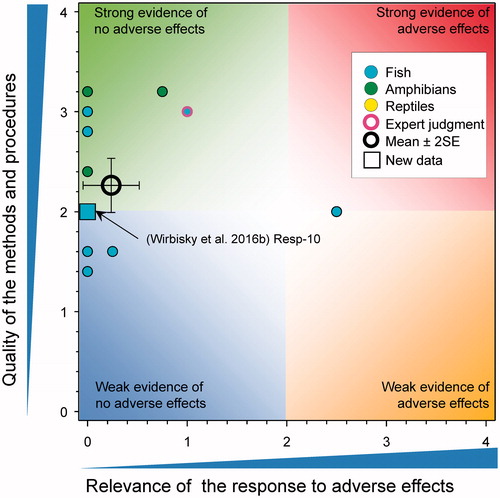
Weight and/or size of fish, amphibians
There were several new studies on the effects of atrazine on the size and/or weight of test organisms (). Most of these showed no effects, highly inconsistent effects, or effects were observed only above the relevance threshold of 100 µg atrazine/L (Chen et al. Citation2015; Syngenta Citation2015, Citation2017a, Citation2017b; Ehrsam et al. Citation2016; Liu et al. Citation2016; Wirbisky et al. Citation2016b; Du Gas et al. Citation2017; Ali et al. Citation2018b; Rimayi et al. Citation2018; Saka et al. Citation2018). The studies ranged in quality from a score of 1 to 3.4. In the study on zebrafish exposed to 0.3, 3, and 30 µg/L from days 1 to 3 post-fertilization and then raised to maturity there was no effect on body weight of males (Wirbisky et al. Citation2016b) or females (Wirbisky et al. Citation2016c) but the weight of the ovary was increased. However, there was no significant change in GSI (see SI Resp-7) and the error bars on ovary weight in Author-Figure 3(d) (Wirbisky et al. Citation2016c, SI Resp-6) do not suggest significant differences from the control. Whether this was an error in the paper is uncertain and the raw data were not available to repeat the statistical test.
Figure 8. WoE analysis of the effects of atrazine on weight or size of fish, amphibians and reptiles. Redrawn with data from Van Der Kraak et al. (Citation2014) with new data added and included in the mean and 2 × SE of the scores. Number of responses assessed = 148. Symbols may obscure others, see Sl for this paper and Van Der Kraak et al., Citation2014 for all responses. No data points were obscured by the legend.
The study on zebrafish by Liu et al. (Citation2016) showed no effect of atrazine on body-length of larvae after exposures to 30, 100, and 300 μg/L for 120 h. They also tested the breakdown products of atrazine (DACT, DIA, and DEA), and reported a 3% reduction in body length of fish exposed to DACT at 300 μg/L; however, this concentration was stoichiometrically equivalent to more than the relevance cutoff of 100 µg atrazine/L.
In a GLP study on zebrafish exposed to atrazine for 28-d at measured concentrations of 9.4, 48, 74, 97, and 244 µg/L, there were no effects on adult female Japanese medaka (Syngenta Citation2017b. In the same study, males exposed to atrazine at 74 and 97 µg/L atrazine were statistically different from controls at the end of the study by ANOVA with a Dunnett’s test (p < 0.05). The differences were <7% (controls 32 mm versus 30 mm at 74 and 97 µg/L). Body lengths of fish at 244 µg/L were not statistically different with a mean of 32 mm. Males exposed to 97 µg/L had significant reduced weight relative to the controls 0.57 g versus 0.49 g, respectively (16%). Fish at 244 µg/L were not statistically different from controls (at 0.56 g). Considering the lack of a consistent response (between length and weight) with treatment overall, the lack of a consistent effect between sexes, the minor differences when observed, and the lack of any concentration response, the overall score was reduced from 1.75 to 0.5. In another GLP study where adult male and female fatheads were exposed to atrazine for 28 d at measured concentrations 1.0, 10, 26, 52, and 105 µg/L there were no significant effects on body size (weight or length) in either sex (Syngenta Citation2017a).
A study by Du Gas et al. (Citation2017) exposed the early life stage sockeye salmon (Oncorhynchus nerka) to atrazine as the formulated product at concentrations of 25 and 250 µg/L from egg fertilization to emergence as alevins (score for quality of methods was 2). This study was performed under laboratory conditions in bin and flume incubators. There was no statistically significant effect on weight or length of exposed alevins at emergence. Condition factor was also assessed and there was a significant increase in the weight of alevins in high atrazine group for fish from the bin incubator and for the low and high atrazine groups from the flume incubators. Because they are correlated, condition factor followed a similar pattern to weights. The score for relevance was reduced to 0 because the effect was observed at >100 µg/L for alevins in the bin incubator only and the effect was an increase in weight, which was judged to not be adverse.
Ali et al. (Citation2018b) reported on two experiments, one with fathead minnow, the other with the frog R. pipiens. Animals were exposed to atrazine at concentrations of 0.5, 5, and 50 µg/L for 7 d under laboratory conditions (score for quality of methods was 2). The Hepatosomatic Index (HSI) in female fatheads was not significantly different between solvent control and treatments. There was also no difference in HSI for male R. pipiens at any treatment. HSIs were not reported for male fatheads or female R. pipiens.
A study with X. laevis (Rimayi et al. Citation2018) exposed adult males and tadpoles to atrazine at concentrations of 0.01, 200, and 500 µg/L for 90 d under laboratory conditions (score for quality of methods was 1.6). It was reported that there was a significant decrease in the mass of adult males at 500 µg/L, but due to pseudo-replication these results are not likely valid statistically. Regardless, as responses were observed at >100 μg/L, the score for relevance was reduced to 0. For tadpoles, mass was significantly less in the treatment at 500 µg/L, but as responses were observed at >100 μg/L, the score for relevance was reduced to 0. Finally, there were no significant differences observed between any treatments at any time during the test for length of tadpoles after 90 d exposure to atrazine.
Saka et al. (Citation2018) exposed Western clawed frogs (X. tropicalis and described as Silurana tropicalis in the paper) to atrazine for 26–28 d at 100 and 1000 μg/L under laboratory conditions (score for quality of methods was 1.6). At the end of the study, tadpoles exposed to atrazine at 1000 μg/L exhibited a statistically significant decrease (approximately 25%) in total body length (p < 0.001) relative to control. As well, tadpoles exposed to atrazine at 1000 μg/L exhibited a statistically significant decrease (approximately 75%) in body mass (p < 0.001) relative to control. As responses were observed at >100 μg/L, the score for relevance was reduced to 0. In larvae of X. laevis and B. b. gargarizan exposed to 0.1, 1, 10, 100 µg atrazine/L for 90 d (Sai et al. Citation2016) and 85 d (Sai et al. Citation2015), respectively, no effects on length and/or weight were reported.
Overall, there was no compelling evidence that atrazine caused changes in body-weight or body length of fish and amphibians. The combined mean score for relevance was 0.1 ± SE 0.03 and that for quality was 1.74 ± SE 0.08. As the combined mean score for relevance was <1, the null hypothesis of causality was not falsified.
Deformities in fish and amphibians
There were eight new studies that included observations on deformities in fish and amphibians exposed to atrazine (). No malformations were reported in larvae of A. maculatum exposed during egg development to 3, 10, 30, 100, and 300 µg atrazine/L (Baxter et al. Citation2015). In a study on zebrafish larvae exposed to 30, 100, and 300 μg/L for 120 h post fertilization, no malformations were observed for atrazine and two of its breakdown products, DIA and DEA (Liu et al. Citation2016). Increased malformations were reported for exposure to the breakdown product DACT at 300 µg atrazine/L only, but this exceeded 100 μg/L and was therefore not relevant. In embryos from zebrafish exposed to 0.3, 3, and 30 µg atrazine/L from 1 through 3 d post fertilization resulted in a significant reduction in the ratio of head length/total body length in the 30 μg/L treatment and an increased ratio of head width/total body length in the 0.3, 3 μg/L treatment groups (Wirbisky et al. Citation2016c, SI Resp-5); however, these changes were small (estimated at 2% from author Figure 2(c), Wirbisky et al. Citation2016c) and the overlap of the standard deviations in the graphic is inconsistent with the claim of statistical significance. The relevance of these small changes in head size and width is not known and this result was not consistent with earlier studies that showed an increase in head length with atrazine treatments at the same concentrations (Weber et al. Citation2013 as discussed in Van Der Kraak et al. Citation2014).
Figure 9. WoE analysis of the effects of atrazine on deformities in fish, amphibians, and reptiles. Redrawn with data from Van Der Kraak et al. (Citation2014) with new data added and included in the mean and 2 × SE of the scores. Number of responses assessed = 40. Symbols may obscure others, see SI for this paper and Van Der Kraak et al. (Citation2014) for all responses. No data points were obscured by the legend.
The frog Physalaemus gracilis was exposed to atrazine as the formulated product under laboratory conditions for 7 d (168 h) (score for quality of methods was 2) (Rutkoski et al. Citation2018) and were assessed for malformations. The NOEC for the number of larvae with malformations (mouthparts) was 1000 µg/L and the LOEC was 1700 µg/L. As the response was observed at >100 μg/L, the score for relevance was reduced to 0.
A study by Du Gas et al. (Citation2017) exposed the early life stage sockeye salmon (Oncorhynchus nerka) to atrazine as the formulated product at concentrations of 25 and 250 µg/L from egg fertilization to emergence as alevins (score for quality of methods was 2). This study was performed under laboratory conditions in bin and flume incubators and the rates of skeletal, craniofacial, and finfold deformities in swim-up fry were assessed. Atrazine had no effect on deformities in swim-up fry examined from the bin incubators or flume incubators and the relevance was 0.
Saka et al. (Citation2018) exposed Western clawed frogs (X. tropicalis and described as Silurana tropicalis in the paper) to atrazine for 26–28 d at 100 and 1000 μg/L under laboratory conditions (score for quality of methods was 1.6). Tadpoles exposed to atrazine at nominal concentrations of 100 and 1000 μg/L exhibited statistically significant smaller hind limbs and ratio of hind limbs to percent body mass (p < 0.001) relative to control. Finally, tadpoles exposed to atrazine at a nominal concentration of 1000 μg/L exhibited a statistically significant increase (approximately 20%) in axial malformations (p < 0.05) relative to control. As the responses were observed at ≥100 μg/L, the score for relevance was reduced to 0. As well, they exposed tadpoles to 2600–26,000 µg/L for 96 h; no malformations were observed at these treatment concentrations after 96 h of exposure.
Svartz et al. (Citation2012) exposed South American Toad (Rhinella arenarum) to atrazine for 14 d (336 h) from early blastula to complete operculum stage (5000, 10,000, 15,000, 20,000, and 30,000 µg/L) and from early complete operculum stage up to late complete operculum stage (1000–30,000 µg/L). They also exposed toads for 45 d (1080 h) from completed back legs (S28) until completion of metamorphosis (1000–30,000 µg/L). In these three studies, EC10s for malformations were reported as ≥2500 µg/L. Finally, they exposed animals to atrazine (1000–40,000 µg/L) for 24 h at the blastula (S4), neural plate (S13), muscular activity (S18), gill circulation (S20), opercular folds (S23), and complete operculum (S25) stages and monitored for 7 d with LOECs for malformations ranging from 15,000 to >40,000 µg/L for all stages tested. As the responses were observed at ≥100 μg/L, the score for relevance was reduced to 0.
In a study on skeletal development in the turtle, Podocnemis expansa, exposed to atrazine from egg-collection to hatch, no effects were reported (dos Santos Mendonça et al. Citation2016). Exposures were via application of solutions of 2, 20, and 200 µg atrazine/L to the sand in which the eggs were incubated but actual values used were not specified and concentration in the soil was not measured.
Overall, the weight of evidence does not suggest that environmentally relevant concentrations of atrazine cause morphological alterations or deformities in fish, amphibians, or reptiles. The new studies are consistent with those examined in the WoE from 2014. The combined mean score for relevance was 0.01 ± SE 0.01 and that for quality was 1.86 ± SE 0.09. As the combined mean score for relevance was <1, the null hypothesis of causality was not falsified.
Direct effects of atrazine on sexual differentiation and development
Sex ratios in fish and amphibians
The effects of atrazine on sexual differentiation were reported in several new papers (). In studies with zebrafish, exposure to atrazine early in development had no effect on the sex ratio of adults measured at about 5 months of age. In this case the fish were exposed to atrazine at 0, 0.3, 3, and 30 µg/L from 1 through 72 h post fertilization (Wirbisky et al. Citation2016c).
Figure 10. WoE analysis of the effects of atrazine on sex-ratio in fish, amphibians and reptiles. Redrawn with data from Van Der Kraak et al. (Citation2014) with new data added and included in the mean and 2 × SE of the scores. Number of responses assessed = 47. Symbols may obscure others, see SI for this paper and Van Der Kraak et al. (Citation2014) for all responses. No data points were obscured by the legend.
Several studies examined the effects of atrazine on sex ratios in amphibians. In a study in X. laevis tadpoles at Niewkoop–Faber stage 46 and 47 were exposed to 100 µg/L of atrazine for 120 d. At 120 d, there was no difference in the sex ratio of control and atrazine-treated frogs (Chen et al. Citation2015). In other studies, leopard frogs (Rana pipiens) and wood frogs (Rana sylvatica) were exposed to atrazine (0.1, 20, and 200 μg/L) from Gosner stage 26 until the end of metamorphosis (Olker Citation2014). For both species, the sex ratios did not differ from the expected 1:1 ratio and were unaffected by atrazine. In another study, Blanchard’s cricket frogs (Acris blanchardi) were exposed to ecologically relevant concentrations (0, 0.1, 1, and 10 µg/L) of a commercial formulation of atrazine from Gosner Stage 25 to metamorphosis (ca. 60 d) (Hoskins and Boone Citation2018). Atrazine treatment reduced the probability of becoming male (Wald χ2 = 9.38, p = 0.0246) for both the 0.1 and 10 µg/L treatments, but not at the intermediate concentration of 1 µg/L. The sex ratio in the control Blanchard’s cricket frogs (70% male) differed significantly from the expected 50:50 male to female ratio whereas none of the ratios in the treated frogs differed from 50%. This was interpreted as a problem with the control group as opposed to an effect of atrazine on the sex ratio of cricket frogs and as such a score of 0 was assigned. Moreover, the authors did not characterize the background sex ratio for sourced test organisms. In larvae of X. laevis and B. b. gargarizan exposed to 0.1, 1, 10, and 100 µg atrazine/L for 90 d (Sai et al. Citation2016) and 85 d (Sai et al. Citation2015), respectively, no effects on sex ratio were reported.
Collectively these data reinforce the earlier studies showing weak evidence for the effects of atrazine on sexual differentiation in fish, amphibians and reptiles. The revised mean score for relevance was 0.06 ± SE 0.04 and for quality was 1.96 ± SE 0.12. As the combined mean score for relevance was <1, the null hypothesis of causality was not falsified.
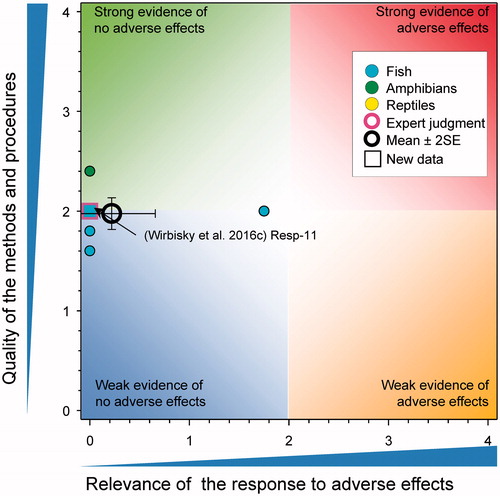
Gonad-somatic index in fish and amphibians
In two related experiments the GSI of adult zebrafish having previously been exposed to atrazine from 1 through 72 h post fertilization were examined (). In males exposed to 0, 0.3, 3, and 30 µg/L of atrazine (Wirbisky et al. Citation2016a) and in females exposed to 0 and 30 µg/L of atrazine (Wirbisky et al. Citation2016c) no differences in GSI were reported. Of interest in the females, the authors reported that there was increased ovarian weight in the atrazine treated fish based on the data reported in (Wirbisky et al. Citation2016c). The statistical significance of the response was surprising given the overlapping error bars in the control and atrazine treated fish. In a GLP study with fathead minnows exposed to atrazine for 28-d at measured concentrations of 1.0, 10, 26, 52, and 105 µg/L, there was no effect on GSI in adult males or females (Syngenta Citation2017a).
Figure 11. WoE analysis of the effects of atrazine on gonadal-somatic index in fish and amphibians. Redrawn with data from Van Der Kraak et al. (Citation2014) with new data added and included in the mean and 2 × SE of the scores. Number of responses assessed = 39. Symbols may obscure others, see Sl for this paper and Van Der Kraak et al. (Citation2014) for all responses. No data points were obscured by the legend.
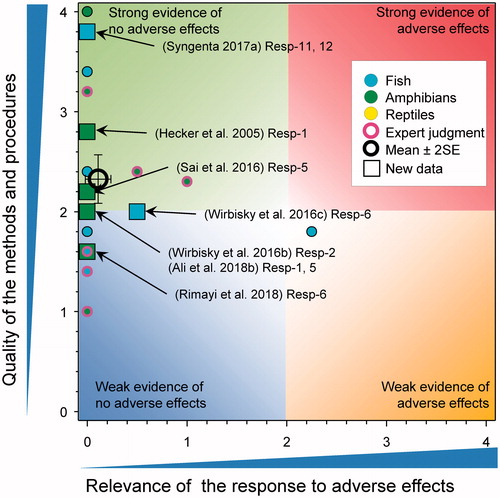
In a study with X. laevis, there were no differences in the GSI of adult males exposed to 1, 25, and 250 μg atrazine/L for 35 d (Hecker et al. Citation2005). Similarly, in a second study with adult X. laevis there no differences in testicular mass or volume following exposure to 0.01, 200, and 500 µg atrazine/L for 90 d (Ali et al. Citation2018b). In contrast, there was a significant decrease in the GSI after 7 d in adult leopard frogs exposed to 0.5 µg atrazine/L (p = 0.0034) but not at 5 and 50 µg atrazine/L (p > 0.05, Author Figure 1(B) Ali et al. Citation2018b). This result seems implausible in that the GSI in the low atrazine group was reduced by 25% relative to the controls and no response was observed at greater concentrations. This is a large and rapid response over the course of a 7-d treatment period, which questions if the response could be due to experimental error or limited replication. In another study, weight of the testes was reduced in larvae of X. laevis exposed to 100 µg atrazine/L for 90 d but not at 0.1, 1, and 10 µg/L (Sai et al., Citation2016). Because the effect was only significant at 100 µg/L, the relevance was reduced to 0. In another study on X. laevis exposed to 0.01, 200, and 500 µg atrazine/L for 90 d, no significant effects of weight or volume of the testes were reported (Rimayi et al. Citation2018).
Collectively there is little evidence to suggest that atrazine exposure affects GSI. The revised WoE mean score for effects on GSI were 0.11 ± SE 0.06 for relevance and 2.33 ± SE 0.12 for quality. As the combined mean score for relevance was <1, the null hypothesis of causality was not falsified.
Cell types in gonads of fish and amphibian
Exposure to atrazine early in early stages of growth had no effects on subsequent development and morphology of the testis in the zebrafish (Wirbisky et al. Citation2016a) (). For example, exposure to atrazine at 0, 0.3, 3, and 30 µg/L from 1 through 72 h post fertilization had no effects on the relative percentages of different cell types in the 6-month old adult testis (primary spermatocytes, secondary spermatocytes, spermatids, spermatozoa and spermatogonia). Nor were there any effects on the thickness of the germinal epithelium or in the Leydig cell frequency, Leydig cell hypertrophy or Sertoli cell hypertrophy in the testes of adults. In a GLP study on the histopathology of ovaries of Japanese Medaka (O. latipes) after exposure to atrazine for 35 d, a small number of female fish showed an increase in atretic oocytes (1, 0, 2, and 4 fish in the negative control, 0.6, 5.5, and 53 μg/L treatment groups respectively) (Syngenta Citation2015). All increases were scored as minimal severity. Only the occurrence in the 53 μg/L treatment was significantly different from the negative control (p = 0.038, according to a one-sided exact Jonkheere–Terpstra step-down trend test). The overall score for oocyte atresia (based on the sum of the number of atretic oocytes and post-atretic follicles) did not show a concentration-related increase. Because of the small increase and lack of effects observed in apical endpoints such as production of eggs and fertility, a score for relevance of 0 was assigned. In a second GLP study with Japanese medaka there were no changes observed in the ovaries for females after a 28-d exposure to atrazine at measured concentrations of 9.4, 48, 74, 97, and 244 µg/L (Syngenta Citation2017b). In males, there was a decrease in mean testicular stage scores in males of the 48, 74, 97, and 244 µg/L treatment groups relative to the control was observed (i.e. 1.4, 1.5, 1.3, and 1.4, respectively, compared to 1.7 in the negative control). There were no statistical tests conducted or other histopathological trends or changes noted and there were no additional corroborative findings (e.g. increased testicular degeneration, consistently decreased body weights). Therefore, the score for relevance was reduced from 0.75 to zero.
Figure 12. WoE analysis of the effects of atrazine on cell types in gonads of fish, amphibians and reptiles. Redrawn with data from Van Der Kraak et al. (Citation2014) with new data added and included in the mean and 2 × SE of the scores. Number of responses assessed = 57. Symbols may obscure others, see Sl for this paper and Van Der Kraak et al. (Citation2014) for all responses. No data points were obscured by the legend.
In a GLP study with male fatheads exposed to atrazine for 28-d at measured concentrations of 1.0, 10, 26, 52, and 105 µg/L, there were no observed effects on the testis (Syngenta Citation2017a). In females, there was an increased proportion of Stage 4.0 (mature spawning) ovaries, accompanied by an increase in proportion of Grade 3 (>9 per ovarian section) post-ovulatory follicles in the 105 µg/L treatment only. As this was observed at a concentration >100 µg/L, a score for relevance of 0 was assigned.
In a study on tadpoles of B. gargarizan exposed to atrazine at 0.1, 1, 10, and 100 µg/L for 85 d, Sai et al. (Citation2015, Resp-7) reported effects on testicular histology. However, this was based on descriptions with a few micrographs and there were no data on the frequency and extent of the “effects” and no statistical analysis was conducted. The relevance (2.3) was plotted on the graph but was not used to calculate the mean score. In the same study, no histological “effects” were reported in the ovary (Sai et al. Citation2015, Resp-8).
The diameter of the seminiferous tubules was not affected in adult X. laevis exposed to 0.01, 200, and 500 µg atrazine/L for 90 d (Rimayi et al. Citation2018). In another study, with X. laevis, the percentage of seminiferous tubules containing sperm was significantly lower in animals treated with atrazine compared to controls but in this case the response was only seen in animals treated with atrazine at concentrations higher than those that would be deemed environmentally relevant (Chen et al. Citation2015).
None of the new studies provided evidence of adverse effects on this response. The revised WoE mean score for relevance was 0.22 ± SE 0.05 and the mean score for quality was 2.27 ± SE 0.11. As the combined mean score for relevance was <1, the null hypothesis of causality was not falsified.
Gonadal abnormalities of the testes
There were no differences in gross testicular development in X. laevis treated with atrazine at 100 µg/L for 120 d (Chen et al. Citation2015) (). Similarly, in zebrafish exposed to atrazine at 0, 0.3, 3, and 30 µg/L from 1 through 72 h post fertilization, there was no evidence of effects on the incidence of testicular abnormalities (hypoplasia, atrophy and underdevelopment) in the testes of adults at 6 months of age (Wirbisky et al. Citation2016c). In a study of tadpoles of X laevis exposed to 0.1, 1, 10, and 100 µg/L of atrazine for 90 d no abnormalities were reported in the testes (Sai et al. Citation2016).
Figure 13. WoE analysis of the effects of atrazine on abnormalities of the testes in fish, amphibians and reptiles. Redrawn with data from Van Der Kraak et al. (Citation2014) with new data added and included in the mean and 2 × SE of the scores. Number of responses assessed = 24. Symbols may obscure others, see SI for this paper and Van Der Kraak et al. (Citation2014) for all responses. No data points were obscured by the legend.
The revised WoE for the effects of atrazine revealed a mean score for relevance of 0.09 ± SE 0.06 and for quality was 2.14 ± SE 0.18. As the combined mean score for relevance was <1, the null hypothesis of causality was not falsified. Collectively the analysis provides no support for the hypothesis that realistic concentrations of atrazine cause abnormalities of the testes in fish, amphibians, and reptiles.
Gonadal abnormalities of the ovaries
There were no differences in gross ovarian development in X. laevis treated with atrazine at 100 µg/L for 120 d (Chen et al. Citation2015) (). Similarly, ovarian development was not affected in leopard frogs (R. pipiens) and wood frogs (R. sylvatica) exposed to atrazine (0.1, 20, and 200 μg/L) from Gosner stage 26 until the end of metamorphosis (Olker Citation2014). In another study with zebrafish exposed to atrazine at 0, 0.3, 3, and 30 µg/L from 1 through 72 h post fertilization, there was no evidence of effects on follicular staging in terms of the distribution of previtellogenic, cortical alveoli, early vitellogenic, late vitellogenic, post ovulatory or atretic follicles in adults at 5–8 months of age (Wirbisky et al. Citation2016c).
Figure 14. WoE analysis of the effects of atrazine on abnormalities of the ovaries in fish, amphibians and reptiles. Redrawn with data from Van Der Kraak et al. (Citation2014) with new data added and included in the mean and 2 × SE of the scores. Number of responses assessed = 14. Symbols may obscure others, see SI for this paper and Van Der Kraak et al. (Citation2014) for all responses. No data points were obscured by the legend.
Overall, the new data provided no support for the hypothesis that atrazine affects ovarian development (mean score for relevance was 0.07 ± SE 0.05 and the mean score for quality was 2.04 ± SE 0.17). As the combined mean score for relevance was <1, the null hypothesis of causality was not falsified.
Production of eggs in fish
There were four new studies that considered the possible effects of atrazine on egg production in fish (). In the first of these studies (under GLP) with the Japanese Medaka (Syngenta Citation2015, also see Hosmer et al. Citation2017), there was no effect of atrazine at 0.6, 5.5, and 53 μg/L for 35 d on either the cumulative number of eggs spawned or the mean numbers of eggs per female per reproductive day. In a second GLP study with Japanese Medaka no effects were observed on cumulative number of eggs laid, number of eggs per female, or percent fertility over a 28-d exposure to atrazine at measured concentrations of 9.4, 48, 74, 97, and 244 µg/L (Syngenta Citation2017b). In a third GLP study with fathead minnows, there was no observed effects on cumulative number of eggs laid, number of eggs per female, or percent fertility over a 28-d exposure to atrazine at measured concentrations of 1.0, 10, 26, 52, and 105 µg/L (Syngenta Citation2017a). Finally, in another study (Shenoy Citation2014), there was no effect the size of brood of guppies (Poecilia reticulata) exposed to atrazine for 6 to 88 d at 1 and 15 μg/L.
Figure 15. WoE analysis of the effects of atrazine on production of eggs in fish, amphibians, and reptiles. Redrawn with data from Van Der Kraak et al. (Citation2014) with new data added and included in the mean and 2 × SE of the scores. Number of responses assessed = 27. Symbols may obscure others, see SI for this paper and Van Der Kraak et al. (Citation2014) for all responses. No data points were obscured by the legend.
Collectively, these new results are consistent with the previous conclusion that atrazine does not impair production of eggs in fish at environmentally relevant concentrations. The updated mean score for relevance was 0.06 ± SE 0.03 and for quality was 2.62 ± SE 0.16. As the combined mean score for relevance was <1, the null hypothesis of causality was not falsified.
Testicular ovarian follicles (TOFs)
A study in Japanese Medaka (Syngenta Citation2015) exposed to atrazine at 0, 0.6, 5.5 and 53 μg/L for 35 d showed that there were no effects on the incidence of TOFs (). There were no TOFs detected in the testis of cricket frogs exposed to atrazine at 0, 0.1, 1, and 10 µg/L from Gosner Stage 25 to metamorphosis (ca. 60 d) (Hoskins and Boone Citation2018). There were no TOFs in the testes of adult Xenopus laevis exposed to 0.01, 200, and 500 µg atrazine/L for 90 d (Rimayi et al. Citation2018). Similar results were seen in studies with Rana sylvatica where exposure to atrazine (0.1, 20, 200 μg/L) from Gosner stage 26 until the end of metamorphosis had no effect on the incidence of TOFs (Olker Citation2014). The prevalence of TOFs differs greatly between amphibian species with the leopard frog being one species that has a high incidence of testicular oocytes (often > than 40% of control individuals) (Olker Citation2014). Even for Rana pipiens there was no significant effect of atrazine treatment on prevalence of TOFs in frogs exposed to atrazine (0.1, 20, and 200 μg/L) from Gosner stage 26 until the end of metamorphosis (Olker Citation2014). Interestingly, pairwise comparisons showed that specimens from the 20 μg/L treatment had a significantly lower TOF prevalence (33%, 3/9) than those from the acetone control (p < 0.001). This was not considered an adverse effect (Olker Citation2014).
Figure 16. WoE analysis of the effects of atrazine on testicular ovarian follicles in fish, amphibians and reptiles. Redrawn with data from Van Der Kraak et al. (Citation2014) with new data added and included in the mean and 2 × SE of the scores. Number of responses assessed = 43. Symbols may obscure others, see SI for this paper and Van Der Kraak et al. (Citation2014) for all responses. No data points were obscured by the legend.
Collectively, these new results are consistent with the previous conclusion that atrazine does not increase the incidence of TOFs in fish, amphibians or reptiles. Overall, with the new data, the mean score for relevance was 0.03 ± SE 0.03; the mean score for quality was 2.37 ± SE 0.1. As the combined mean score for relevance was <1, the null hypothesis of causality was not falsified.
Effects of atrazine on reproductive hormones and their actions
Estradiol
Several recent studies have considered the effects of atrazine on reproductive sex steroid levels and/or production (). In studies with female X. laevis, there were no effects on plasma 17β-estradiol levels following exposure to 1, 25, or 250 μg atrazine/L for 35 d (Hecker et al. Citation2005). In other studies, ovarian 17β-estradiol levels were not affected when measured in 6-month old female zebrafish previously exposed to atrazine at 0, 0.3, 3, and 30 µg/L from 1 through 72 h post fertilization (Wirbisky et al. Citation2016c). There were also no effects evident following exposure to formulated atrazine (25 and 250 µg/L) from fertilization to emergence on 17β-estradiol concentrations in whole body homogenates of alevins of Oncorhynchus nerka collected at emergence (Du Gas et al. Citation2017).
Figure 17. WoE analysis of the effects of atrazine on testicular ovarian follicles in fish, amphibians and reptiles. Redrawn with data from Van Der Kraak et al. (Citation2014) with new data added and included in the mean and 2 × SE of the scores. Number of responses assessed = 43. Symbols may obscure others, see SI for this paper and Van Der Kraak et al. (Citation2014) for all responses. No data points were obscured by the legend.
Overall, the WoE for levels of estradiol in females resulted in a mean score for relevance was 0.0 ± SE 0.0 and for quality was 2.23 ± SE 0.14. There was no evidence of adverse effect on levels of estradiol and, as the combined mean score for relevance was <1, the null hypothesis of causality was not falsified.
Progesterone
There was a significant increase in progesterone concentration in the ovaries of 6-month-old zebrafish that were previously exposed to atrazine at 3 and 30 µg/L from 1 through 72 h post fertilization (Wirbisky et al. Citation2016c). This change in progesterone content is of interest in that some previous studies have shown that long term exposure to high concentrations of exogenous progesterone can negatively impact reproduction in adult zebrafish (e.g. DeQuattro et al. Citation2012). In the study by Wirbisky et al. (Citation2016c), the change in progesterone content did not translate to an effect on GSI, the development of the ovary as measured by the proportion of follicles of different sizes or on reproductive success (Wirbisky et al. Citation2016c). The elevation of progesterone content is also difficult to interpret as 17β-estradiol, which is downstream of progesterone in the steroid biosynthetic pathway, was not altered.
There were relatively few measurements of this response in previous WoE and only one new data point here (). Because of the lack of effect on estradiol and the lack of an adverse apical endpoint, the score for relevance was reduced.
Figure 18. WoE analysis of the effects of atrazine on concentration of progestins in fish, amphibians and reptiles. Redrawn with data from Van Der Kraak et al. (Citation2014) with new data added and included in the mean and 2 × SE of the scores. Number of responses assessed = 8. Symbols may obscure others, see SI for this paper and Van Der Kraak et al. (Citation2014) for all responses. No data points were obscured by the legend.
The revised mean score for relevance was 0.22 ± SE 0.22 and the mean score for quality was 1.98 ± SE 0.08. As the combined mean score for relevance was <1, the null hypothesis of causality was not falsified.
Testosterone
There were four new studies on the effects of atrazine on testosterone ().
Figure 19. WoE analysis of the effects of atrazine on concentration of testosterone in fish, amphibians and reptiles. Redrawn with data from Van Der Kraak et al. (Citation2014) with new data added and included in the mean and 2 × SE of the scores. Number of responses assessed = 34. Symbols may obscure others, see SI for this paper and Van Der Kraak et al. (Citation2014) for all responses. No data points were obscured by the legend.
In the case of males, there were no effects on plasma testosterone levels in X. laevis exposed to 1 or 25 μg atrazine/L for 35 d (Hecker et al. Citation2005). Testosterone levels were measured in the serum of adult X. laevis exposed to high concentrations of atrazine (200 and 500 µg/L) for 90 d but it is not clear if these differences were statistically significant. (Rimayi et al. Citation2018). Testosterone levels were reduced in frogs exposed to 250 μg atrazine/L (Hecker et al. Citation2005). In other studies, there were no changes in the concentrations of testosterone in the testis of adult male zebrafish that had previously been exposed to atrazine at 0, 0.3, 3, and 30 µg/L from 1 through 72 h post fertilization (Wirbisky et al. Citation2016b). There were also no effects of exposure to formulated atrazine (25 and 250 µg/L) from fertilization to emergence on testosterone concentrations in whole body homogenates of alevins of Oncorhynchus nerka collected at emergence (Du Gas et al. Citation2017).
These studies reinforce the conclusions of the WoE that atrazine has little effect on levels of testosterone in males (mean score for relevance was 0.17 ± SE 0.08 and for quality was 2.15 ± SE 0.12) at environmentally relevant concentrations. As the combined mean score for relevance was <1, the null hypothesis of causality was not falsified.
11-ketotestosterone
In the only one new study on 11-ketotestosterone (11-KT), there were no changes in the concentrations of 11-KT in the testis of adult male zebrafish that had previously exposed to atrazine at 0, 0.3, 3, and 30 µg/L from 1 through 72 h post fertilization (Wirbisky et al. Citation2016b) (). This study reinforced the conclusion of the WoE that atrazine has little impact on levels of 11-KT in males (mean score for relevance was 0.24 ± SE 0.14 and for quality was 2.26 ± SE 0.14). As the combined mean score for relevance was <1, the null hypothesis of causality was not falsified.
Figure 20. WoE analysis of the effects of atrazine on concentration of 11-ketotestosterone in fish, amphibians and reptiles. Redrawn with data from Van Der Kraak et al. (Citation2014) with new data added and included in the mean and 2 × SE of the scores. Number of responses assessed = 19. Symbols may obscure others, see SI for this paper and Van Der Kraak et al. (Citation2014) for all responses. No data points were obscured by the legend.
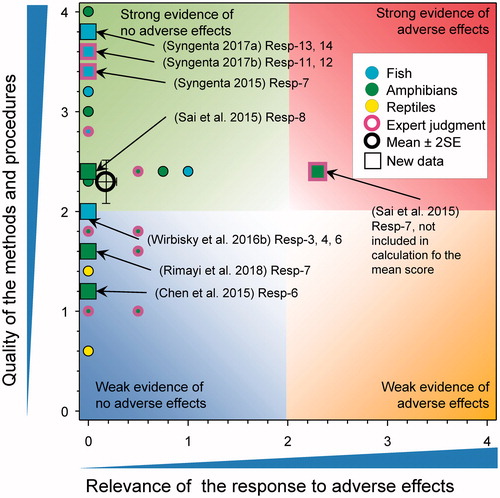
Expression or activity of aromatase
Previous studies have consistently shown that atrazine has no effects on aromatase activity or the expression of CYP19A or CYP19B in fish, amphibians, and reptiles. In an earlier study (Hecker et al. Citation2005), that was inadvertently omitted from the 2014 WoE report, gonadal aromatase activity and CYP19a expression were shown not to be affected in male X. laevis exposed to 1, 25, and 250 μg atrazine/L for 35 d (). In another study on tadpoles of X. laevis, exposed to 100 µg atrazine/L for 180 d, no effects were reported on the aromatase gene in the testes (Sai et al. Citation2016).
Figure 21. WoE analysis of the effects of atrazine on aromatase activity and/or expression in fish, amphibians and reptiles. Redrawn with data from Van Der Kraak et al. (Citation2014) with new data added and included in the mean and 2 × SE of the scores. Number of responses assessed = 30. Symbols may obscure others, see SI for this paper and Van Der Kraak et al. (Citation2014) for all responses. No data points were obscured by the legend.
The revised WoE scores for effects on activity and/or expression of aromatase were 0.08 ± SE 0.06 for relevance and 2.02 ± SE 0.14 for quality. As the combined mean score for relevance was <1, the null hypothesis of causality was not falsified.
Secondary sexual characteristics, including vitellogenin, in fish
The possible impacts of atrazine on secondary sex characteristics were evaluated in several studies (). A GLP study with the Japanese Medaka (Syngenta Citation2015) showed that there were no effects on the number of anal fin papillae among control male fish and males exposed to 0.6, 5.5, and 53 μg/L during the 35-d test. No anal fin papillae were observed in female fish. In a second GLP study with Japanese Medaka exposed to atrazine for 28-d at 9.4, 48, 74, 97, and 244 µg/L, there were no effects on the number of anal fin papillae in male fish and none were observed in female fish (Syngenta Citation2017b). In a GLP study with fathead minnows, there was no effect on the number of tubercles on adult minnow males following a 28-d exposure to atrazine at measured concentrations of 1.0, 10, 26, 52, and 105 µg/L, and no tubercles observed on adult females (Syngenta Citation2017a).
Figure 22. WoE analysis of the effects of atrazine on secondary sexual characteristics in fish, amphibians and reptiles. Redrawn with data from Van Der Kraak et al. (Citation2014) with new data added and included in the mean and 2 × SE of the scores. Number of responses assessed = 43. Symbols may obscure others, see SI for this paper and Van Der Kraak et al. (Citation2014) for all responses. No data points were obscured by the legend.
Although not strictly a secondary sex characteristic, the measurement of Vtg mRNA or protein has been used extensively as a marker of exposure to environmental estrogens in both males and females. In the Syngenta (Citation2015) study with the Medaka there were no statistically significant differences in VTG expression among females in any treatment group in comparison to the negative control. For males, the mean VTG fold change compared to the reference gene, RPL7 in the negative control, 0.6, 5.5, and 53 μg/L treatment groups were 1.4, 1.6, 6.9, and 3.7, respectively. There was a statistically significant increase (Dunnett’s test, p < 0.05) in VTG gene expression among male fish in the 5.5 μg/L group. Because of the small increases in expression, the lack of a monotonic response, and that the changes in VTG expression did not translate to effects on production of eggs and their fertility, a score for relevance of 0 was assigned. In another GLP study with medaka (Syngenta Citation2017b), there was no effect on the hepatic expression of vitellogenin by females after a 28-d exposure to atrazine at measured concentrations of 9.4, 48, 74, 97, and 244 µg/L. In males, there was no significant difference in mean concentration of hepatic vitellogenin based on ANOVA and Dunnett's test (p < 0.05). There was a significant trend detected by Jonckheere–Terpstra test (p < 0.05). Since there were no statistical differences from control and the data were within historical laboratory control data (mean negative control data = 2.72 × 10², 2.97 × 10², 1.11 × 10³, and 4.83 × 10⁶ copies Vtg1 mRNA/ng total RNA; n = 4) and fell on the lower end of the historical control data range, the score was reduced from 0.75 to zero.
In GLP study with fathead minnows (Syngenta Citation2017a), there was no significant effect of atrazine on plasma levels of vitellogenin in adult males or females following exposure to atrazine for 28-d at measured concentrations of 1.0, 10, 26, 52, and 105 µg/L.
In another study with male rainbow fish (Melanotaenia fluviatilis), there was no induction of vitellogenin protein after 7 d of exposure to atrazine at 0.34 µg/L (Scott et al. Citation2017). Similarly, in studies with male mosquitofish, there was no induction of vitellogenin protein or mRNA after 7 d of exposure to atrazine at 0.39 µg/L (Scott et al. Citation2017). In studies with male Cyprinus carpio there was no induction of vitellogenin mRNA in liver following exposure to atrazine at concentrations 0, 7, 35, 108, and 277 µg/L for 1, 4, and 30 d (Chang et al. Citation2005).
Richter et al. (Citation2016) considered the relationship between the percentage of medaka with high expression of the egg protein transcripts zp3.1 and/or vtg1 (high EPE) per tank compared to total egg production in fish exposed to 0, 0.5, 5, and 50 µg/L of atrazine for 14 d or 30 and 38 d. With atrazine treatment, the proportion of high EPE medaka females declined from about 60% in the control to approximately 40% in the treated groups. When the data were combined for all atrazine treated groups, the proportion of fish with high EPE values was significantly reduced from about 58% to about 40% (p > 0.05). A score of 1 was assigned because the significance was only observed when data from all treatments were pooled. Richter et al. (Citation2016) also considered the same relationship for fathead minnow and found no significant differences in the proportion of females with high EPE either per atrazine treatment group or for all atrazine treatments combined. Interpretation of these results is questionable as the authors provide no evidence that the change in EPE gene expression was related to an alteration in reproductive output.
Overall, these new data had little effect on the overall WoE for the effects of atrazine on secondary sexual characteristics. The revised mean score for relevance was 0.06 ± SE 0.03 and the mean score for quality was 2.5 ± SE 0.13. As the combined mean score for relevance was <1, the null hypothesis of causality was not falsified.
Effects of atrazine on thyroid hormones in fish, amphibians and reptiles
There were no new studies on the effects of atrazine on thyroid hormones in fish, amphibians and reptiles. The mean scores for relevance and quality were unchanged at 0.33 ± SE 0.19 and 2.03 ± SE 0.14, respectively, n = 13. See the specific graph and SI in the previous assessment (Van Der Kraak et al. Citation2014).
Direct effects of atrazine on cortisol and stress physiology
Additional research was conducted to evaluate the effects of atrazine on the stress response in fish (). This involved exposing adult zebrafish for up to 10 d to atrazine and its degradates DIA, DEA, and DACT and then measuring basal and forced swimming stress induced changes in whole body cortisol content (Van Der Kraak et al. Citation2015). Consistent with previous studies (Fuzzen et al. Citation2010, Citation2011), these studies showed that zebrafish not exposed to atrazine (controls) exhibited an increase in whole body cortisol content following a 20 min swimming challenge. When zebrafish were exposed to atrazine and its degradates, the swimming stress induced an increase in cortisol levels in 19 of 21 dose and time comparisons. In the other 2 of 21 comparisons, atrazine treatment attenuated the stress induced rise in cortisol levels, but this did not occur in a consistent dose or time dependent effect. Atrazine and its degradates when tested alone had a limited effect on whole body cortisol levels as in 17 of 21 time and dose comparisons there was no effect on basal cortisol levels. The most pronounced effect was a modest increase in basal cortisol levels in fish treated with 10, 50, and 100 μg/L of atrazine for 3 d in one experiment. However, this effect was not verified in two subsequent studies. Collectively, atrazine and its degradates had no effect on stress induced cortisol levels (21 comparisons).
Figure 23. WoE analysis of the effects of atrazine on cortisol stress physiology in fish, amphibians and reptiles. Redrawn with data from (Van Der Kraak et al., Citation2014) with new data added and included in the mean and 2 × SE of the scores. Number of responses assessed = 23. Symbols may obscure others, see SI for this paper and Van Der Kraak et al. (Citation2014) for all responses. No data points were obscured by the legend.
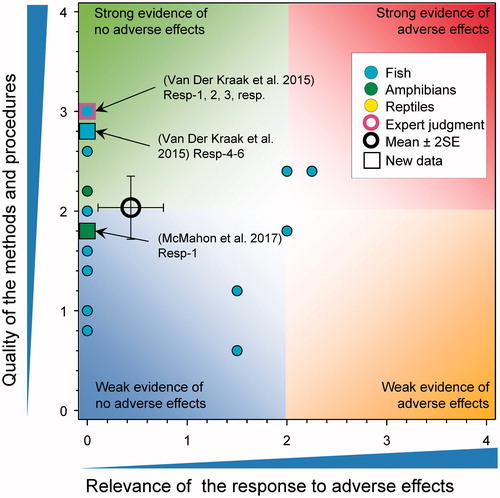
Another study examined the exposure of tadpoles of the Cuban Treefrog (Osteopilus septentrionalis) to nominal concentrations of 0.1, 10.2, 56, and 102 µg atrazine/L for 4, 28 or 100 h on whole-body concentration of corticosterone. From the variance of the data presented in the paper, statistically, it is doubtful that the responses at the four tested concentrations were significantly different from that of the water control. The power to detect an effect of exposure duration was low (34%) because sample size was insufficient. Accordingly, a score of 0 was assigned for the relevance of the response.
Overall, the new data reinforce the earlier conclusions that atrazine at concentrations that are environmentally relevant have minimal effects on the cortisol mediated stress response in fish and amphibians (Van Der Kraak et al. Citation2014). The revised scores for relevance and quality of the study were 0.40 ± SE 0.17 and 2.03 ± SE 0.16, respectively. As the combined mean score for relevance was <1, the null hypothesis of causality was not falsified.
Effects of atrazine on smoltification and response to salt-water challenge in anadromous fish
There were no new studies on the effects of atrazine on smoltification and response to salt-water challenge in anadromous fish. The mean scores for relevance and quality were unchanged. The mean score for relevance was 1.02 ± SE 0.17 and that for quality was 2.25 ± SE 0.08 for effects on smoltification, n = 31. For challenge the mean score for relevance was 1.11 ± SE 0.53 and that for quality was 2.14 ± SE 0.24, n = 7. See the specific graphs and SI in the previous assessment (Van Der Kraak et al. Citation2014).
Effects of atrazine on physiological and biochemical responses
The previous WoE analysis (Van Der Kraak et al. Citation2014) assessed in vitro and in vivo response to atrazine. Many studies had reported effects of atrazine on physiological and biochemical endpoints in fish and amphibians in vivo but no responses in reptiles were found (see Figure 28 in Van Der Kraak et al. Citation2014). There were more studies reporting on expression of genes than in the previous WoE, probably reflecting the increased use of analysis of gene expression since 2014.
Physiological and biochemical effects in vitro
There were three new studies on the effects of atrazine on in vitro cultures of tissue, one for an amphibian and two for fish (). Atrazine at concentrations of 1000 to 20,000 µg/L was reported to induce breakdown of germinal vesicle in the ovarian follicles of the frog (Euphlyctis cyanophlyctis) (Ghodageri and Katti Citation2013). All these concentrations were not environmentally relevant. In a study on fibroblasts of the zebrafish (D. rerio), it was reported that exposure to atrazine at 10,000 µg/L, but not 100 and 1000 µg/L, was toxic to fibroblasts and inhibited confluent growth (Wirbisky and Freeman Citation2017). In the same study, there were alterations of copy number in the fibroblasts, but this was observed at unrealistic concentrations ≥100 µg atrazine/L. In a study on the in vitro effects of atrazine on the rate of maturation of oocytes in follicles from zebrafish (D. rerio) significant reductions were observed after a 4-h incubation at the environmentally unrealistic concentrations of 216 and 2160 µg/L, but not at 108 µg/L (D'Angelo and Freeman Citation2017).
Figure 24. WoE analysis of the effects of atrazine on physiological and biochemical responses in vitro. Redrawn with data from Van Der Kraak et al. (Citation2014) with new data added and included in the mean and 2 × SE of the scores. Number of responses assessed = 18. Symbols may obscure others, see SI for this paper and Van Der Kraak et al. (Citation2014) for all responses. No data points were obscured by the legend.
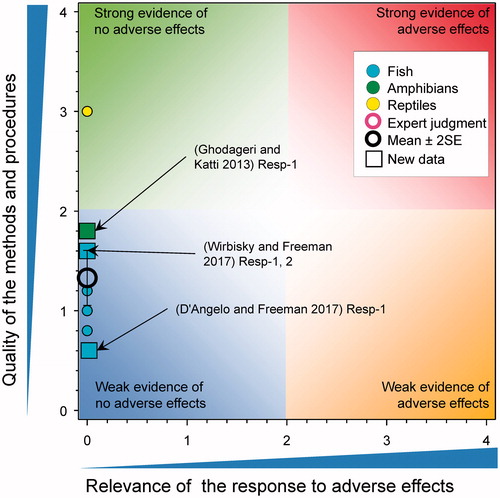
The updated mean score for relevance was 0.0 ± SE 0.0 and the mean score for quality was 1.29 ± SE 0.14. Relevance was unchanged from the studies included in (Van Der Kraak et al. Citation2014) indicating that cultures of the tissues of fish and an amphibian are not sensitive to atrazine at environmentally realistic concentrations. As the combined mean score for relevance was <1, the null hypothesis of causality was not falsified.
Physiological and biochemical effects in vivo
There were several studies evaluating effects of atrazine on expression of genes in fish (). As there were many responses from new studies in the graphic, the labels are shown in the SI. In a study on zebrafish (Liu et al. Citation2016) exposed to atrazine and its degradates, DACT, DIA, and DEA at concentrations of 30, 100, and 300 μg/L for 72 h post-fertilization there were no effects from exposure to atrazine but there were significant reductions in rate of heartbeat in DACT at 100 but not 300 μg/L, DIA and DEA at 100 and 300 μg/L. Effects were only noted at concentrations equivalent >100 μg/L. There were statistically significant decreases in activity of whole-body AChE in fish exposed to atrazine and its degradates at concentrations ≥100 μg/L. Atrazine and DACT had no effect on the expression of AChE mRNA whereas DIA and DEA at 100 μg/L reduced AChE expression. There were changes in expression of other genes but most of these were less that 2-fold and their significance to apical endpoints was not investigated.
Figure 25. WoE analysis of the effects of atrazine on physiological and biochemical responses in fish and amphibians. Redrawn with data from Van Der Kraak et al. (Citation2014) with new data added and included in the mean and 2 × SE of the scores. For the key to the responses of the new studies, see the SI. Number of responses assessed = 361. Symbols may obscure others, see SI for this paper and Van Der Kraak et al. (Citation2014) for all responses. No data points were obscured by the legend.
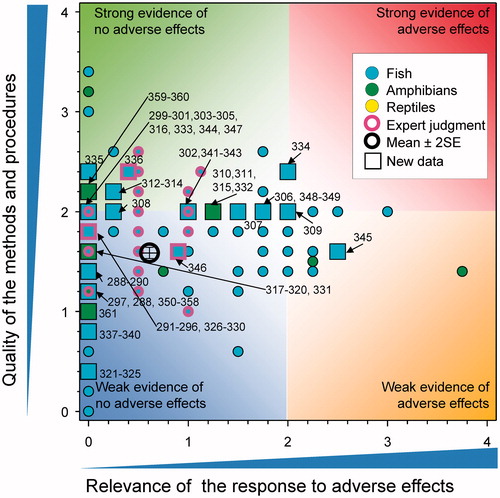
From what appears to be one actual study, four papers that reported on responses in zebrafish were published by (Wirbisky and Freeman Citation2015, Wirbisky et al. Citation2016a, Citation2016b, Citation2016c). All these papers were based on experiments in zebrafish that were exposed to 0.3, 3, and 30 μg atrazine/L from 1 through 3 d post fertilization and then sampled at d-7 and then again as adults. There were no effects of this treatment on whole-body concentrations of the neurotransmitters dopamine and serotonin in 7-d old larvae (Wirbisky and Freeman Citation2015).
Expression of zebrafish and human miRNAs after the 3-d exposure increased the number with altered gene expression. A concentration-response was observed but not characterized (Wirbisky et al. Citation2016a). A time-course study of expression of has-miR-126-3p after embryonic exposure to 0, 0.3, 3, and 30 µg/L of atrazine for 60 h, only showed a significant increase in expression at 30 μg atrazine/L (Wirbisky et al. Citation2016a). In another component of the same study, there were no effects on concentration of dopamine, 3,4-dihydroxyphenylacetic acid (DOPAC), and turnover of dopamine; concentration of serotonin, 5-hydroxyindolacetic acid (5-HIAA), and turnover of serotonin; and concentrations of GABA in the brain of adult male and female zebrafish (Wirbisky and Freeman Citation2015). Microarray analysis of gene expression in the brains of adult females revealed changes in the expression of 1928, 89, and 435 mapped genes in the 0.3, 3, and 30 µg/L treatment groups, respectively. There was no concentration-response. As a further follow-up to the above studies, microarray analysis of gene expression revealed changes in the expression of 239, 162, and 288 genes in the 0.3, 3, and 30 µg/L treatment groups, respectively, in the testes and changes in the expression of 2748, 3034, and 2826 genes in the 0.3, 3, and 30 µg/L treatment groups, respectively, in brain of adult male zebrafish (Wirbisky et al. Citation2016b). These studies do not provide evidence that the changes in gene expression measured in the brain are associated effects on apical endpoints or neurotransmitters in the brain (unaffected in the same study) or the gonads and no responses were observed at higher levels of organization. In a further study on D. rerio, embryos exposed to 3 and 30 µg atrazine/L from 1 to 72 h post fertilization showed reductions in methylation of genomic DNA and modest reductions in expression of some but not all DNA methyltransferases (Wirbisky-Hershberger et al. Citation2017). There were no effects on apical endpoints such as mortality, hatching rate, or gross malformations so the relevance of these responses is questionable. Significant changes in heart rate and development of craniofacial cartilage in embryos of D. rerio have been reported (Walker et al. Citation2018). Heart rate was significantly increased at unrealistic concentrations ≥216 µg atrazine/L at 72- and 96 h post fertilization. Craniofacial abnormalities were observed at concentrations of atrazine ≥22 µg/L. The effects were not linked to apical endpoints and were not noted in other studies with the same species (see Liu et al. Citation2016, above).
A paper by Richter et al. (Citation2016) reported results of selected gene expression analysis of samples of brain, liver and gonad from what appear to be two previous experiments (Tillitt et al. Citation2010; Papoulias et al. Citation2014), reviewed in the previous WoE (Van Der Kraak et al. Citation2014) conducted to examine the effects of long term atrazine exposure on reproductive success in the Japanese Medaka and the fathead minnow. This paper attempted to investigate a mechanism by which atrazine could have affected reproduction in these fish. In female Medaka and fathead minnow, expression of 19 different genes related to reproduction was measured. Significant changes were seen in only 6 (<10%) of 84 gene-atrazine comparisons relative to the solvent control fish. There was a significant elevation of cyp 19a1b in the Medaka brain of the fish exposed to 0.5 µg/L atrazine, a significant elevation of esr1 in the ovary of the fathead minnow exposed to 50 µg/L atrazine, lhcgr in the brain of the fathead minnow exposed to 50 µg/L atrazine, as well as a significant reduction in the expression of cyp11a in the 5 µg/L atrazine treated group. There was a significant reduction in vtg1 and zp3.1 in the livers of Medaka exposed to 0.5 and 5 µg/L of atrazine.
In male fish, expression of 26 different genes related to reproduction was measured. Significant changes were seen in only seven of 84 gene-atrazine comparisons relative to the solvent control fish (Richter et al. Citation2016). There was a significant increase in the expression of cyp17a1 in the testes of Medaka exposed to all three concentrations of atrazine (time not specified) and cyp11a1 in the testes of Medaka exposed to 0.5 and 5.0 µg/L of atrazine. A significant reduction in the expression of vtg1 in the liver of Medaka exposed to 5 µg/L of atrazine and zp3.1 in the liver of Medaka exposed to 5 µg/L of atrazine. In males and females, there was no evidence of a concentration-response relationship and the expression of the genes was not consistent between species. In the case of cyp171a1 in males, there was no concentration-response and the effects seen in the one experiment were not verified. The magnitude of the changes was modest as most genes showed a less than a two-fold change in expression relative to the solvent control fish.
In a further analysis, the proportion of female fish with high expression of the egg protein transcripts zp3.1 and/or vtg1 (high EPE) per tank were compared to egg production as a function of atrazine treatment (Richter et al. Citation2016). With atrazine treatment, the proportion of high EPE Medaka females declined from about 60% in the control to approximately 40% in the treated groups. When the data were combined for all atrazine treated groups, the proportion of fish with high EPE values was significantly reduced from about 58% to about 40%. In the case of the fathead minnow, there were no significant differences in the proportion of females with high EPE either per atrazine treatment group or for all atrazine treatments combined. Indeed, there were no changes in the proportion of fathead minnow with high EPE despite a claimed reduction in egg production.
As for the other genes that the authors (Richter et al. Citation2016) measured, there was no evidence of a concentration response for the Medaka or for the fathead minnow. The authors provided no evidence that the change in expression of EPE genes is related to an alteration in reproductive output. There was a small change in the proportion of fish having a high EPE but this was not functionally related to alterations in egg production.
In a study evaluating oxidative injury in D. rerio exposed to 3000 µg atrazine/L for 24 h, there were no changes in the activity of lipid peroxidase, superoxide dismutase, catalase, glutathione and glutathione peroxidase in liver, kidney, and brain (Shukla et al. Citation2017). A study on the effects of formulated atrazine at 2.5, 5, 10, and 15 µg/L on metabolic parameters in the fish Rhamdia quelen showed a number of changes in total protein, glycogen, total lipids, triacylglycerol and the activity of superoxide dismutase (SOD), catalase (CAT), and concentration of thiobarbituric acid reactive substances (TBARS) in gills, liver, kidney, and muscle (Persch et al. Citation2017). However, it was not possible to determine relevance because the test substance contained only 50% atrazine and the other components were not tested separately. In a study on Oncorhynchus nerka exposed to formulated atrazine (25 and 250 µg/L) from fertilization to emergence, no effects were reported on protein and triglyceride content of alevins (Du Gas et al. Citation2017). In a study in female fathead minnows (P. promelas) exposure to atrazine at 5 µg/L for 7 d resulted in a decrease in the expression of ERα in liver tissue but not at 0.5 or 50 µg/L (Ali et al. Citation2018b). Although scored as relevant, the inconsistent concentration response suggests that the response could be the result of experimental error. In the same study there was an effect on the expression of Vtg in the liver.
A study in carp (Cyprinus carpio) exposed to 7, 35, 108, and 277 µg atrazine/L for 1, 4, and 30 d in mesocosms revealed several responses (Chang et al. Citation2005). Gene damage in erythrocytes as measured by electrophoretic tail length was observed at all exposures but was not related to apical endpoints. No micronuclei were found in erythrocytes, suggesting no genotoxicity. There was no expression of Vtg in livers of male fish but there was only an inconsistent induction of P4501a1 mRNA (day-4 only), resulting in a reduced score for relevance. A study in the same species exposed to 428 µg atrazine/L for 40 d reported effects on hematological parameters viability of lymphocytes, profile of serum proteins, and genes related to expression of immunity (Khalil et al. Citation2017) but the authors did not report effects on apical endpoints. The only concentration used in the test was not environmentally realistic. A weak study (quality of methods score of 1.2) on the effects very unrealistic concentration of formulated atrazine reported adverse effects on several blood parameters (Ali et al. Citation2018a). Snow trout (Schizothorax plagiostomus) were exposed to 50,000, 100,000, and 150,000 µg atrazine/L for 24, 48, and 72 h. Hemoglobin content, red and white blood cell counts, neutrophils, and lymphocytes were all affected. In addition, corpuscular volume, corpuscular hemoglobin, and total proteins were affected. Effects at these concentrations, which exceed the maximum solubility of atrazine in water, caused mortality, and are not environmentally realistic. The score for relevance was reduced to 0.
There were six new studies on amphibians found in the literature. Chen et al. (Citation2015), measured several responses including production of gonadal proteins in X. laevis exposed to the 105 μg atrazine/L for 120 d. In the testes, production of 58 proteins was up-regulated and 85 down-regulated. In the ovary, 50 were up-regulated and 71 down-regulated. All of these occurred at an unrealistic concentration of >100 μg atrazine/L and, thus, the relevance to environmental responses was reduced to 0. Changes in production of proteins in the ovary was not reflected in changes in ovarian development; however, those in the testes might have been related to observed changes in histology or reductions in body weight or delayed development in treated animals. In R. pipiens, there was a significant increase in expression of ERα in liver of male adult frogs exposed for 7 d to 50 but not 0.5 or 5 µg atrazine/L (Ali et al. Citation2018b) but there was no change in expression of Vtg in liver in the same study. The size of the thyroid gland was reported to be reduced in adult western clawed frogs (Silurana tropicalis) exposed to nominal concentrations atrazine of 100 and 1000 µg/L for 26–28 d under laboratory conditions (Saka et al. Citation2018) but no histopathological lesions were observed. The concentrations used in this study were environmentally unrealistic. Exposures to atrazine at a concentration of 1250 μg/L (but not 10, 50, and 250 µg/L) in tadpoles of the American toad (A. americanus) and H. versicolor for 48 h resulted in changes in metabolite profiles (Snyder et al. Citation2017). Because they were observed at unrealistic concentrations and would be expected to result non-specific narcosis, they were judged to be of no relevance to apical endpoints.
In a study on tadpoles of X. laevis exposed to 100 µg atrazine/L for 180 d, a small proportion of genes in the testis were upregulated (1.4%) and fewer (1.2%) were downregulated (Sai et al. Citation2016). This was an exploratory study and, because these effects were observed at ≥100 µg atrazine/L, the score for relevance was set to 0. In the same study, no effects were reported on the hepatosomatic index in tadpoles exposed to 0.1.1, 10, and 100 µg atrazine/L for 180 d. In a second study by the same authors (Sai et al. Citation2018), 405 circRNAs were measured in samples of testes in X. laevis exposed to 100 µg atrazine/L for 180 d. Of these, 44 were upregulated and 361 downregulated. Because these effects were observed at ≥100 µg atrazine/L, the relevance of these changes, which were not linked to apical endpoints, was set to 0.
In studies on reptiles (Russart and Rhen Citation2016), eggs (stage 20) of snapping turtles (Chelydra serpentina) were exposed to concentrations equivalent to 2 and 40 μg atrazine/L (of egg). Exposures were not measured so penetration into the egg was not confirmed. Only responses in gene expression in the hypothalamus were reported. No effects were observed on any of the measured genes in embryos tested 24-h after treatment. One week after treatment, expressions of several genes (androgen receptor, proopiomelanocortin, kisspeptin receptor, aromatase, prodynorphin) were significantly increased but only at 2 and not at 40 μg atrazine/L. The only gene (prolactin releasing hormone) tested six months after exposure was significantly increased at 2 but not at 40 μg atrazine/L. No apical endpoints were reported so it is not possible to judge relevance. The lack of a consistent concentration-response and complete lack of effect of relatively large dose of estradiol (0.5 μg/egg) on any of these genes raises questions about the conduct and validity of the study. As no measures of exposure were reported, a mix-up of the 2 μg atrazine/L and estradiol treatments cannot be ruled out.
The updated mean score for relevance was 0.60 ± SE 0.04 and the mean score for quality was 1.57 ± SE 0.03. As the updated mean score for relevance was <1, the null hypothesis of causality was not falsified. As before (Van Der Kraak et al. Citation2014), the relevance of almost all the physiological and biochemical responses discussed above to the apical endpoints of survival, growth, development, or reproduction was not established. Most of these responses were likely adaptive and were related to normal metabolism of or response to exposure to xenobiotics. In most cases they did not result in changes in survival, even at large exposure concentrations (>100 μg/L). Given the lack of large or significant responses in terms of survival and growth of fish, amphibians, and reptiles observed upon exposure to atrazine (see other response in sections above), these effects do not appear to be relevant to apical endpoints or useful as predictive biomarkers of response.
Effects of atrazine on immune function in fish and amphibians
There were three new studies that addressed the potential effects of atrazine on immune function (). Challenges of common carp (C. carpio) with the bacterium, Aeromonas sorbia after a prior exposure to an unrealistic concentration of atrazine (428 μg/L) for 40 d did not affect mortality or clinical symptoms (Khalil et al. Citation2017). Exposure of tadpoles and adults of the Cuban tree frog (Osteopilus septentrionalis) to 178 or 200 µg atrazine/L for 6 d did not affect the microbiota of the gut, either in vitro or in vivo (Knutie et al. Citation2018). A study of the response of several species of frogs (Anaxyrus americanus. Anaxyrus boreas, Pseudacris crucifer, Pseudacris regilla, Lithobates pipiens, and Rana cascadae) to a challenge with the amphibian pathogen Batrachochytrium dendrobatidis after exposure to a mixture of herbicides containing 3.9 µg atrazine/L for 14 d showed no increase in susceptibility (Jones et al. Citation2017). Although atrazine was not tested separately, at this concentration, 3.9 µg/L, it had no effect on susceptibility.
Figure 26. WoE analysis of the indirect effects of atrazine on immune function in fish and amphibians. Redrawn with data from Van Der Kraak et al. (Citation2014) with new data added and included in the mean and 2 × SE of the scores. Number of responses assessed = 64. Symbols may obscure others, see SI for this paper and Van Der Kraak et al. (Citation2014) for all responses. No data points were obscured by the legend.
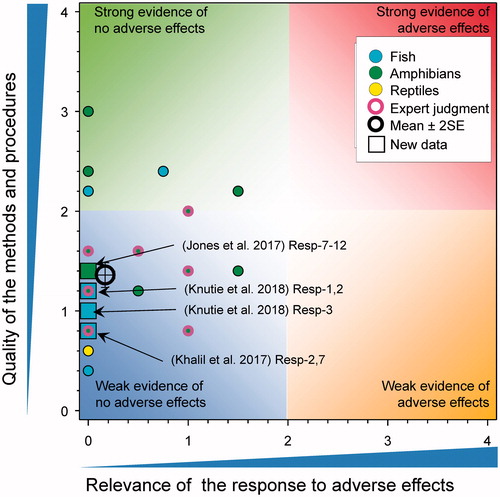
The updated mean score for relevance was 0.17 ± SE 0.05 and the updated mean score for quality was 1.36 ± SE 0.06. As the updated mean score for relevance was <1, the null hypothesis of causality was not falsified. As before (Van Der Kraak et al. Citation2014), the relevance of most immunological responses to the apical endpoints of survival, growth, development, or reproduction was not established.
Effects of atrazine on parasites in amphibians
As noted in the previous WoE (Van Der Kraak et al. Citation2014), studies on effects of atrazine parasitism are either direct (affecting the relationship with the terminal host) or indirect, affected the development of the parasite and/or its survival in the environment or its intermediate hosts.
Effects of atrazine on infection of frogs by trematodes
There were no new studies on the effects of atrazine infection of frogs by trematodes. The mean score for relevance was 0.44 ± SE 0.19 and that for quality was 1.34 ± SE 0.12, unchanged from the previous assessment (Van Der Kraak et al. Citation2014).
Indirect effects of atrazine on parasitism of amphibians
Only one new study was found in the literature (Gustafson et al. Citation2016) and it characterized indirect effects on a trematode parasite and its intermediate hosts (). The study used only two exposures, 3 and 30 μg atrazine/L. Exposures of uninfected snails (Physa acuta) did not affect survival but exposure of infected snails (Halipegus eccentricus) was significantly decreased at both exposures; a response that was not considered adverse because probability of infection in the terminal host would be reduced, a beneficial outcome. Exposure to atrazine did not increase the prevalence of infection in snails or the other intermediate ostracod host (Cypridopsis sp.). Exposure to atrazine had other beneficial effects; reduction in time of release of parasites (cercaria) and the number of parasites released from infected snails, and the infectivity of parasites (metacercaria) in the snails. Survival of the ostracod intermediate host was reduced by exposures to atrazine but not if ostracods were infected with parasites.
Figure 27. WoE analysis of the indirect effects of atrazine on infection of frogs by trematodes. Redrawn with data from Van Der Kraak et al. (Citation2014) with new data added and included in the mean and 2 × SE of the scores. Number of responses assessed = 51. Symbols may obscure others, see SI for this paper and Van Der Kraak et al. (Citation2014) for all responses. No data points were obscured by the legend.
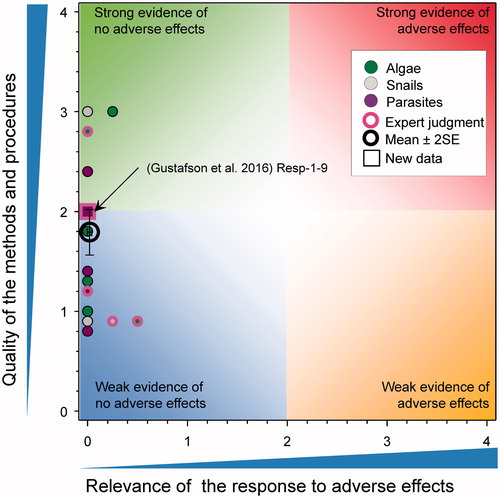
These observations are like those in the previous WoE. Overall, atrazine was associated with a reduced life-span of snails infected with trematodes, number of days of release of parasites, survival of parasite-infected ostracods and infectivity of metacercaria. Although statistically significant, these effects are beneficial to the definitive hosts (frogs) of the parasites and are not considered adverse to amphibians. The combined mean score for relevance was 0.04 ± SE 0.02 and the mean score for quality was 1.79 ± SE 0.11. As the combined mean score for relevance was <1, the null hypothesis of causality was not falsified.
Effects on behavior
Direct effects of atrazine on behavior of fish
There were three new studies that reported the behavior of fish exposed to atrazine (). Shenoy (Citation2014) examined responses in prenatally exposed guppy (quality of methods 1.4), Liu et al. (Citation2016) reported on a single behavior in zebrafish (quality of methods 1.6), and Araújo et al. (Citation2018) reported on avoidance and migration behaviors in guppy (quality of methods 1.2–2.4).
Figure 28. WoE analysis of the effects of atrazine on behavior of fish. Redrawn with data from Van Der Kraak et al. (Citation2014) with new data added and included in the mean and 2 × SE of the scores. Number of responses assessed = 42. Symbols may obscure others, see SI for this paper and Van Der Kraak et al. (Citation2014) for all responses. No data points were obscured by the legend.
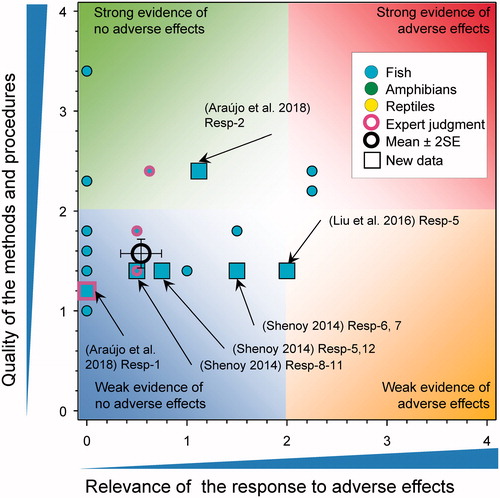
Shenoy (Citation2014) took guppies that had been prenatally exposed to atrazine at concentrations of 1 and 15 μg atrazine/L and then reared them to approximately 13 months of age and examined behaviors related to mating. The hypothesis was that prenatal exposure to atrazine would impact mating behaviors in male fish that in turn could reduce overall fecundity.
In terms of responses, Shenoy (Citation2014) examined the likelihood and number of guppy males (Poecilia reticulata) performing courtship displays, gonopodium swings, and forced copulatory attempts following prenatal exposure to atrazine at 1 and 15 μg/L in the absence of competitors. They reported the likelihood of performing courtship displays was significantly decreased, but that the number was not. The likelihood of performing gonopodium swings was significantly decreased, as well as the numbers. The likelihood of forced copulatory attempts was significantly decreased, as well as the numbers.
Shenoy (Citation2014) also reported responses (proximity to females, forced copulations, aggressive displays, and attacks) by guppy males (Poecilia reticulata) following prenatal exposure to atrazine at 1 and 15 μg/L on rival males. There was little consistency in the responses observed. Proximity to the female was not influenced by the treatment, or the interaction of treatment and paired control male's behavior but was influenced by the paired control male's proximity. The number of forced copulations was not influenced by the treatment, or paired control male's behavior, but was influenced by the interaction of treatment with the paired control male's behavior. The number of aggressive displays to the rival male was significantly reduced (but only for the high dose treatment), but not for paired control male's behavior or the interaction of the treatment with the covariate. Finally, the number of attacks on the rival male was significant for treatment, but not for paired control male's behavior or interaction of the treatment with the covariate.
The last response assessed was attractiveness of guppy males following prenatal exposure to atrazine at 1 and 15 μg/L by females. The female's preference for the control male over the treated male was reported as significantly influenced by the treatment, but only for the 1 μg/L treatment.
There are several issues that weaken the value of the observations reported by Shenoy (Citation2014) aside from the highlighted major methodological issues in the SI. First, it should be noted that actual exposure of males and females during mating was not reported as reducing mating success (e.g. number of fish per brood, time to brood), which should have occurred if atrazine can impair mating behavior. In fact, greater numbers of males were produced (16 males from the control, 12 males from the DMSO treatment, 23 males from the 1 μg/L atrazine treatment, and 32 males from the 15 μg/L atrazine treatment) with atrazine exposure, undermining the entire hypothesis. Shenoy (Citation2014) did report some responses related to atrazine exposure, but these were inconsistent and only for certain exposures at certain times. The observations themselves were only for 10 min, and no attempt was made to quantify actual impacts on apical endpoints such as successful breeding, which can take anywhere from 4 to 82 d as reported for the conditions under which these fish were held initially. As well, the proposed mechanism by which atrazine would exert an influence after approximately 13 months since exposure, is not plausible. Shenoy (Citation2014) proposed that “Atrazine is lipophilic (Matsui et al., 1995) and hence, can be stored in the yolk. Since the mothers of the exposed fish were living in atrazine-contaminated water throughout gestation, the embryos developing within them were also constantly exposed to atrazine. Atrazine may also be stored in the developing embryos' fat tissues, and be released gradually during its lifetime.” Atrazine is not lipophilic and does not bioconcentrate (see Van Der Kraak et al. Citation2014).
Liu et al. (Citation2016) examined the locomotory activity and swimming distances of zebrafish larvae exposed to atrazine and its degradates (DACT, DIA, and DEA) at concentrations of 30, 100, and 300 μg/L for 120 h. Significant differences were reported for the 100 and 300 μg atrazine/L related to locomotion/average swimming distances, but inconsistently between dark and light treatments and between trials.
Araújo et al. (Citation2018) conducted two experiments with guppies (P. reticulate) under laboratory conditions. The first examined avoidance of atrazine by guppy larvae exposed to atrazine at 0.02, 0.02, 0.3, 1.9, 11.2, and 105 µg/L as a gradient in an experimental test system (score for quality of methods was 2.4). The exposure system consisted of a series of chambers made from bottles open at the top and each containing 125 ml of water. Individual sub-chambers were isolated from each other with a removable plug and filled with exposure solutions. Three fish were added to each chamber and the connecting tubes opened. The fish were observed for 3 h with observations every 30 min under red light to reduce the influence of the observer on behavior, and this was performed four times (with and without an atrazine gradient). There was significant avoidance (two-way ANOVA, p < 0.001) reported. The concentration for 50% avoidance was calculated as 0.065 µg/L, but this value does not reflect the fact that there was no apparent difference between the control distribution (i.e. no atrazine gradient) and when atrazine was present at 0.02, 0.02, 0.3, and 1.9 µg/L (Figure 2 in Araújo et al. Citation2018). Significant differences between distributions of exposed and control fish were apparent only at 11.2 and 105 µg/L. The initial score for relevance was 2.25, but this was reduced by half (to 1.12) due to the lack of blinding of observations for this study, as well as the inappropriate statistical analysis to assess effects between the control state and the exposed state.
They also performed a separate study with guppies to examine the inhibition of migration of P. reticulata by atrazine at two concentrations, 150 and 1058 µg/L. The fish and the exposures were conducted in the same way as described above, except that the sub-chambers were set up with two chambers at each end containing no atrazine and the three central chambers containing a solution of atrazine at a single concentration. Each test scenario (control, 150, and 1058 µg/L) was replicated four times, again with no blinding of observers. Guppies apparently had a propensity to remain in their initial chamber and not distribute randomly, even under control conditions, which raises concerns about the experimental design to detect effects. In the end, there were statistically significant differences in the number of fish in the uncontaminated compartment as compared to “barrier” or the opposite uncontaminated side (Tukey test; p < 0.05) for both tested concentrations. As responses were observed at >100 μg/L, the score for relevance was reduced to 0.
Overall, some responses related to behavior in fish were reported, with the mean score for relevance was 0.53 ± SE 0.1 and the mean score for quality was 1.57 ± SE 0.07. As the combined mean score for relevance was <1, the null hypothesis of causality was not falsified.
Direct effects of atrazine on behavior of amphibians
There were three new studies that examined behaviors in amphibians following exposure to atrazine (). Ehrsam et al. (Citation2016) exposed Cuban tree frog (Osteopilus septentrionalis) tadpoles to 178 μg atrazine/L of atrazine for 7d and characterized responses with and without predator cues (i.e. predatory dragonfly larvae, Libellulidae sp.). The study was poorly conducted with a quality of methods score of 1. They reported the average location and activity in test chamber without cues, and the avoidance (location) and activity in the first 10 min of exposure to a predator cue. No differences in average location of atrazine exposed relative to solvent control animals were reported, while a statistically significant difference between atrazine exposed relative to solvent control animals was reported for activity of animals (∼53% versus ∼39% active, respectively). Atrazine-exposed frogs did not avoid the predator chemical cue for the first 10 min of observation and exhibited no statistically significant lack of avoidance during the entire 20 min exposure. A statistically significant increase in activity of atrazine exposed relative to solvent control animals following exposure to the predator cue was reported. While differences were reported, no linking to actual impairment of survival was attempted. As well, only a single concentration of atrazine (178 μg/L) was used and therefore, as the effects were observed at >100 μg/L, the score for relevance was reduced to 0.
Figure 29. WoE analysis of the effects of atrazine on time to behavior of amphibians. Redrawn with data from Van Der Kraak et al. (Citation2014) with new data added and included in the mean and 2 × SE of the scores. Number of responses assessed = 33. Symbols may obscure others, see SI for this paper and Van Der Kraak et al. (Citation2014) for all responses. No data points were obscured by the legend.
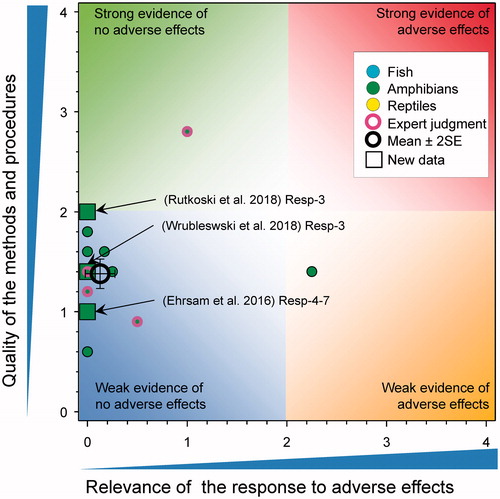
Rutkoski et al. (Citation2018) conducted a study to examine the effects of a 168 h exposure to formulated atrazine on mobility and spasmodic contractions in early larval stages of the frog Physalaemus gracilis (score for quality of methods was 2). The NOEC for any type of larval movement was reported as 10,000 µg/L and the LOEC was 25,000 µg/L. As responses were observed at >100 μg/L, the score for relevance was reduced to 0. In a study on swimming activity in embryos of the frog Physalaemus cuvieri, effects were only observed at concentrations >240 µg/L for 7 d (Wrubleswski et al. Citation2018) and the score for relevance was reduced to 0.
Overall, some responses related to behavior in amphibians were reported, there was no marked change in the overall assessment of amphibian behavior due to the use of unrealistic concentrations. The mean score for relevance was 0.13 ± SE 0.07 and the mean score for quality was 1.38 ± SE 0.07. As the combined mean score for relevance was <1, the null hypothesis of causality was not falsified.
Effects of atrazine on behavior of reptiles and effects on fish, amphibians, and reptiles at the population level
There were no new studies on the effects of atrazine on the behavior of reptiles or effects at the population level. For the behavior of reptiles mean score for relevance was 0 ± SE 0 and that for quality was 1.6 ± SE 0. For studies at the population level, the mean score for relevance was 0 ± SE 0 and that for quality was 2.6 ± SE 0.33, unchanged from the previous assessment (Van Der Kraak et al. Citation2014).
Overall discussion and conclusions
Effects of atrazine on fish, amphibians, and reptiles
As in the 2014 QWoE (Van Der Kraak et al. Citation2014), the mean and SE data were combined for the scores for quality and relevance of the responses discussed above and these are presented in graphical from in . Since the previous QWoE (Van Der Kraak et al. Citation2014), new studies have been published examining the effect of atrazine exposure on fish, amphibians, and reptiles. The evaluation these new studies in the same manner as previously used did not change the previous conclusions, which still hold; atrazine, at environmentally relevant concentrations, is unlikely to have ecologically significant effects on fish, amphibians, or reptiles.
Figure 30. Overall summary of all QWoEs. Symbols are means of the original data on quality and relevance from Van Der Kraak et al. (Citation2014) combined with the new studies published since 2014. The horizontal and vertical bars indicate 2 × SE of the combined data.
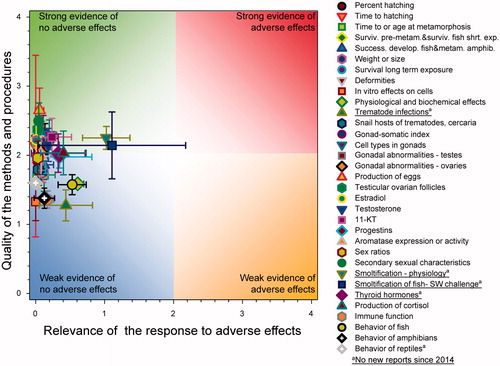
Because about four years had elapsed between the original QWoE and this update, the difference between the mean scores for the relevance and the quality of the studies assessed in the 2014 assessment were compared with the scores for the combined data. The results of the comparison are shown in . The largest change in the assessment was found for the production of cortisol. In this case, there was a reduction in the relevance of the response and this was coupled with an increase in the quality of the studies. The opposite effect was seen for behavior where the score for relevance was increased modestly (0.12) but the quality of the studies went down slightly (0.04). Overall, the mean difference in the average scores between the original and the updated assessment was not large; the overall average score for quality was 0.03 (a slight increase) and that for relevance was 0, no change.
Figure 31. Differences in the scores for relevance and quality between the QWoE published in 2014 (Van Der Kraak et al. Citation2014) and the all the scores in this update. Negative values indicate lower scores for the combined scores and positive values indicate greater scores.
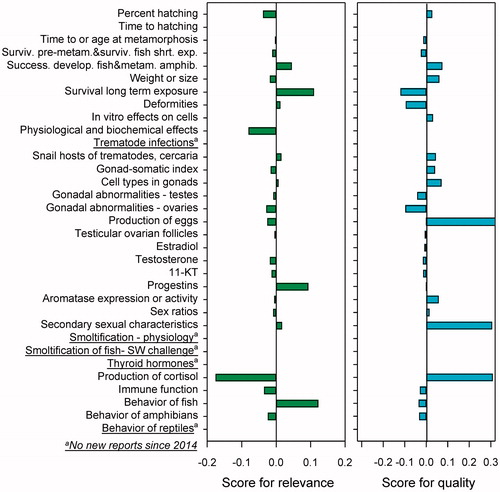
The small differences between the 2014 assessment and combined scores in this update might suggest that scoring was consistent but this is not easy to test because the number of responses scored varied across the endpoints assessed. For several endpoints, there were no new studies published since 2015 and for some there were only one or two endpoints added while for others, such as physiological and biochemical endpoints (70), many responses were added.
The use of WoE and QWoE in decision making
As discussed in Van Der Kraak et al. (Citation2014), WoE analyses had been used before 2014; however, QWoE frameworks have not yet been fully developed or adopted in the regulatory arena. Regulatory instruments such as REACH in Europe (EC 2006) mention the term and European Chemicals Agency (ECHA Citation2010) had developed guidance but the process is not yet formally used in regulatory decisions-making (Agerstrand and Beronius Citation2016). However, there still appears to be interest in adopting WoE; EFSA has published guidance on WoE (EFSA Citation2017) and this was a topic in recent workshop with the appropriate title of “The Science of Combining Apples and Oranges” held under the auspices of EFSA (European Food Safety Authority Citation2018), and a framework for WoE has been suggested by USEPA (Suter et al. Citation2017).
One QWoE approach that has become more widely used and accepted in the scientific and regulatory community is a scoring system that provides a weight of evidence for the risks associated with contaminated sediments. This methodology makes use of scoring derived from various parameters related to the chemistry and biology of freshwater and marine sediments and is based on the seminal work of Chapman (Citation2007, and earlier) with refinements by Piva et al. (Citation2011). In a search of the literature since 2015 (see below), a group of 26 papers were located focusing on the use of a quantitative weight of evidence for risk assessment and management of contaminated sediments. The framework uses an algorithm for combining the scores related to the chemistry and biology of the sediments and augments the decision-making process. This framework does not specifically assess the quality of the studies but is does score relevance in comparison to toxicity and exposure criteria. In practice, this framework and the concept of WoE is used as the basis for recommendations for aggregating data from several lines of evidence and thus helping to bridge data-to-decisions gaps in the management of contaminated sites (Bates et al. Citation2018).
Since 2014, several papers that make use of a framework for quantitative weight of evidence have been published. Some of these papers include the authors of this paper while others do not. To obtain a perspective of the use of weight of evidence in decision-making process since the publication of Van Der Kraak et al. (Citation2014), a search of the literature was undertaken via PubMed and Google Scholar®. The search terms used were “weight of evidence” and “toxicology” as a phrase to eliminate the vast number of papers where “weight,” “evidence,” and “toxicology” were mentioned (112,000, in total from Google Scholar since 2014). The search was limited to papers published after 2014. These references were evaluated to exclude those that did not have a focus in animal and/or environmental toxicology. The result was 440 references.
Of the 440 references, 290 used the term in a citation to other papers or in a metaphorical sense (Weed Citation2005) to describe an undocumented process of decision making. The remainder were then evaluated to focus in on papers where “weight of evidence” was used in the correct sense. Systematic reviews and some meta-analyses incorporate several of the aspects WoE in terms of evaluation of the quality of studies but generally lack quantitative procedures and are not discussed further here. The traditional meta-analysis makes use of statistical approaches to combine and quantitatively assess the results from multiple studies on the same endpoint to increase power and enhance estimates of the size of the effect. In this sense, it is quantitative, but the focus is narrow and does not address multiple lines of evidence as does the QWoE process.
As has been pointed out (Suter et al. Citation2017) WoE assessments can take on several forms. Some are based on hierarchical evidence such as might be provided in in vitro tests, laboratory in vivo tests on specific chemicals, toxicity tests on whole effluents etc. Other frameworks for WoE are based on assigning causality such as the Bradford-Hill “considerations” (Hill Citation1965) used in the determination of causality.
The basic framework utilized here; that is the scoring of quality of data and the relevance of the results of the studies to assessment endpoints as used in the 2014 assessment (Van Der Kraak et al. Citation2014) has been modified and applied to other environmental scenarios and risk assessment. In an evaluation of the toxicological and environmental properties of the cyclic volatile methyl siloxanes (CVMSs) the QWoE process was adapted by Bridges and Solomon (Citation2016) to aggregate lines of evidence for toxicity to aquatic organisms, persistence, biomagnification in food chains, and long-range transport of three CVMSs (D4, D5, and D6) in the global environment. Similarly, the QWoE process was adapted to aggregate the effects of three neonicotinoids, imidacloprid, clothianidin, and thiamethoxam on honeybee colonies (hives) when used as seed treatments (Solomon and Stephenson Citation2017a, Citation2017b, Citation2017c; Stephenson and Solomon Citation2017a, Citation2017b). This QWoE assessment integrated data from several lines of evidence including exposures via pollen, nectar, and water; effects in semi-field studies of honeybee colonies exposed to food from plants treated with insecticides; and ecoepidemiology studies based on field observations. Because different hypotheses were tested in these assessments, the scoring guides for the various groups of the responses differed from those used with here with atrazine. All these QWoE assessments provided detailed information on the scoring process and the quality and relevance of the observed responses to maximize transparency. The same framework has been adapted to conduct QWoE analyses of other types of data for use in regulatory decision making. A framework for the analysis of -omics data was developed by Bridges et al. (Citation2017) as was another framework for QWoE of reproductive and developmental toxicants (Dekant and Bridges Citation2016a, Citation2016b) and increasing the confidence in use of mode-of-action data to extrapolate risks to humans (Becker et al. Citation2017; Dekant et al. Citation2017). Others have suggested WoE can be used to assess information on adverse outcome pathways (Becker et al. Citation2015; Bal-Price and Meek Citation2017; Brockmeier et al. 2017; Browne et al. Citation2017; Armstrong et al. Citation2018) and weighted scores were used to characterize effects of atrazine in aquatic cosms (Giddings et al. Citation2018). Our QWoE framework was used to categorize responses into levels of biological organization. In this context, the overall relevance of each response was low across all levels of biological organization. This does not provide a consistent approach to assess causality for key event relationships in an adverse outcome pathway (AOP), but the lack of relevant responses suggests that atrazine does not affect AOPs related to reproduction. Thus, a formal analysis for causality is unwarranted.
The QWoE framework we have used is not the only approach. A number of papers that used hypothesis-based weight-of-evidence evaluations to assess causality such as for carcinogens and endocrine disruptors were published before 2014 (Rhomberg et al. Citation2010, Citation2011; Borgert et al. Citation2011; Bailey et al. Citation2012; Borgert et al. Citation2014) as well as after (Blackburn et al. Citation2015; Borgert et al. Citation2015; Rhomberg Citation2015; Bailey et al. Citation2016; Mihaich et al. Citation2017; Borghoff et al. Citation2018; Mihaich and Borgert Citation2018).
Recommendations and suggestions
Weight of evidence assessments and frameworks has been used in the past and their use and application in risk assessment is expanding. Based on observation, there are many permutations of WoE with no single harmonized approach that would satisfy the needs of global regulation. We do not believe that having different frameworks is counterproductive. Many of these frameworks have been developed to address different and sometimes specific questions. However, some suggestions to improve the transparency and utility of these assessments are provided here:
The criteria for assessment of quality and relevance of results should be clearly stated and made available in the publication or associated Supplemental information (SI).
Many published papers do not follow harmonized testing guidelines such as those of OECD or USEPA. Therefore, it is necessary to have flexibility in the criteria for assessment of quality. It is useful to provide a summary of the test methods in the evaluation of quality where various points related to the hypothesis tested and the design and conduct of the methods are discussed. This is a pooled criterion that obviously requires expert judgment, so reasoning for the pooled score should be clearly stated. In addition to the published QWoEs, there are several publications that provide ideas for what should be considered in this regard e.g. Klimisch et al. (Citation1997), Breton et al. (Citation2009), Moermond et al. (Citation2016, Citation2017), Hanson et al. (Citation2017).
It is useful to have some criteria that are simple but fundamental to the proper conduct of a study. For example, in toxicity testing, the number of doses or concentrations tested is a key to good study design. Also, transparency of the data is important to the quality of reporting.
The same applies to relevance. Here, a key criterion is statistical significance but, in the absence significant differences in a toxicity test, a dose- or concentration-response might be indicative of a causal relationship and should be considered as well. Another key criterion for relevance is the relationship of the measured response to apical or assessment endpoints. This allows for separation of scores for biomarkers that are indicators of exposure rather than biologically relevant effects and are not directly relevant to the assessment endpoint.
Keep the number of criteria small (4–5). The objective of the score is separate responses observed in experimental studies on the basis of quality and relevance. The score for a key criterion that is critical to a good study might be lost in the averaging of scores for many (> 5) criteria.
Keep the scores for individual criteria simple and use whole-numbers. This evaluation used scores from 0 to 4 to help differentiate quality and relevance of different studies that might be lost in the use of decimals in the scores. In addition, scores should be averaged arithmetically, and the mean score reported to only one decimal to avoid too much implied precision.
It is very useful to have an independent quality assurance person to evaluate the consistency of the scoring and to check for errors in transcription of key parameters.
Graphic presentation of the scores for quality and relevance is a useful illustrative tool when communicating the results of a QWoE assessment, especially when many studies have reported the same responses. The mean of the quality and relevance can be plotted on the graph (with an indication of variance, such as the standard error) as an indicator of the trend of the scores and the level of consistency in the results of the studies.
Declaration of interest
This study was funded by Syngenta Crop Protection LLC. Syngenta Crop Protection LLC is the primary registrant, producer, and marketer of atrazine herbicide. Atrazine also is marketed under license by Agan Chemical Manufacturing, Drexel Chemical Company, and Oxon Italia. RAB is an employee of Syngenta Crop Protection LLC and provided technical information on formulated products as well as access to reports of studies submitted to USEPA including measurements of concentrations of atrazine in surface waters as conducted by the primary registrant of atrazine, Syngenta Crop Protection LLC. The review and assessment of the studies included in this update was conducted by MLH, KRS, and GVDK, who worked as paid consultants for Syngenta Crop Protection LLC. The literature review strategy was exactly the same as that used in the previous Quantitative Weight of Evidence analysis (Van Der Kraak et al. Citation2014). The results of the reviews of the new studies in this paper, the WoE process, and the conclusions drawn are transparently described in detail in the SI to this MS. The opinions expressed in this paper and the SI are those of MLH, KRS, and GVDK only. The opinions expressed are not necessarily those of Syngenta Crop Protection LLC, the licensees listed above, or the employers of the authors. The data and opinions in the paper were not edited by scientists or legal counsel representing the registrants and none of the authors have been or are now engaged as expert witness on behalf of the registrant or other licensees of atrazine. MLH, KRS, and GVDK have made presentations and provided written information for Science Advisory Panels conducted by the US Environmental Protection Agency and related to their assessments of the effects of atrazine on aquatic organisms. MLH, KRS, and GVDK have been funded by Syngenta Crop Protection LLC in the past to oversee laboratory testing and data analyses, including the previous QWoE. Dr Gladys L. Stephenson of Aquaterra Environmental Consulting provided independent quality assurance for the scoring and descriptions of the new studies and was a paid consultant to Syngenta Crop Protection LLC. Mention of trade names or commercial products do not constitute endorsement or recommendation for use.
Supplemental material
Supplemental material for this article is available online here.
| Abbreviations | ||
| 11-KT | = | 11-Ketotestosterone |
| 17,20βP | = | 17,20β-Dihydroxy-4-pregnen-3-one |
| AChE | = | Acetylcholine esterase |
| ar | = | Androgen receptor |
| Bd | = | Batrachochytrium dendrobatidis |
| CAT | = | Catalase |
| circRNAs | = | Circular RNA (single-stranded RNA in the form of a covalently closed continuous loop) |
| CYP19 | = | Aromatase, a member of the cytochrome P450 superfamily |
| DACT | = | Diaminochlorotriazine |
| DEA | = | De-ethyl atrazine |
| DIA | = | Deisopropylatrazine |
| EC50 | = | Concentration causing a stated effect in 50% of the tested individuals |
| EPE | = | Expression of the egg protein transcripts |
| ERα | = | Estrogen receptor alpha |
| GLP | = | Good laboratory practice |
| GSI | = | Gonad-somatic index |
| hpf | = | Hours post-fertilization |
| LOEC | = | Lowest observed effect concentration |
| mRNA | = | Messenger RNA |
| OECD | = | Organization for Economic Cooperation and Development |
| QoM | = | Quality of methods |
| QWoE | = | Quantitative weight of evidence |
| SE | = | Standard error |
| SEJ | = | Score from expert judgment |
| SI | = | Supplemental information |
| SOD | = | Superoxide dismutase |
| TBARS | = | Thiobarbituric acid reactive substance |
| TOF | = | Testicular ovarian follicle |
| USEPA | = | United States Environmental Protection Agency |
| Vtg | = | Vitellogenin |
| WoE | = | Weight of evidence |
Supplemental Material
Download PDF (2.9 MB)Acknowledgments
The authors thank Syngenta Crop Protection LLC. of Greensboro for funding this study and for access to internal reports and data related to the use of atrazine and measurements of environmental concentrations of atrazine in surface waters.
References
- Abdel-Moneim A, Deegan D, Gao J, De Perre C, Doucette JS, Jenkinson B, Lee L, Sepúlveda MS. 2017. Gonadal intersex in smallmouth bass Micropterus dolomieu from northern Indiana with correlations to molecular biomarkers and anthropogenic chemicals. Environ Pollut. 230:1099–1107.
- Acquavella J, Garabrant D, Marsh G, Sorahan T, Weed DL. 2016. Glyphosate epidemiology expert panel review: a weight of evidence systematic review of the relationship between glyphosate exposure and non-Hodgkin's lymphoma or multiple myeloma. Crit Rev Toxicol. 46:28–43.
- Agerstrand M, Beronius A. 2016. Weight of evidence evaluation and systematic review in EU chemical risk assessment: foundation is laid but guidance is needed. Environ Int. 92–93:590–596.
- Ali F, Khan MQ, Anjum MZ, Khattak I. 2018a. Toxic effect of atrazine herbicide on the hematological indices of snow carp (Schizothorax plagiostomus): an indigenous fish species of economic importance. Fresenius Environ Bull. 27:3075–3080.
- Ali JM, Knight LA, D'Souza DL, Kolok AS. 2018b. Comparing the effects of atrazine and an environmentally-relevant mixture on estrogen-responsive gene expression in the northern leopard frog and the fathead minnow. Environ Toxicol Chem. 37:1182–1188.
- Araújo CVM, Silva DCVR, Gomes LET, Acayaba RD, Montagner CC, Moreira-Santos M, Ribeiro R, Pompêo MLM. 2018. Habitat fragmentation caused by contaminants: atrazine as a chemical barrier isolating fish populations. Chemosphere. 193:24–31.
- Armstrong BM, Murphy CA, Basu N. 2018. Using a vitellogenesis model to link in vitro neurochemical effects of pulp and paper mill effluents to adverse reproductive outcomes in fish. In: Garcia-Reyero N, Murphy CA, editors. A systems biology approach to advancing adverse outcome pathways for risk assessment. Cham: Springer; p. 317–347.
- Arukwe A, Myburgh J, Langberg HA, Adeogun AO, Braa IG, Moeder M, Schlenk D, Crago JP, Regoli F, Botha C. 2016. Developmental alterations and endocrine-disruptive responses in farmed Nile crocodiles (Crocodylus niloticus) exposed to contaminants from the Crocodile River, South Africa. Aquat Toxicol. 173:83–93.
- Bailey LA, Nascarella MA, Kerper LE, Rhomberg LR. 2016. Hypothesis-based weight-of-evidence evaluation and risk assessment for naphthalene carcinogenesis. Crit Rev Toxicol. 46:1–42.
- Bailey LA, Prueitt RL, Rhomberg LR. 2012. Hypothesis-based weight-of-evidence evaluation of methanol as a human carcinogen. Regul Toxicol Pharmacol. 62:278–291.
- Bal-Price A, Meek MEB. 2017. Adverse outcome pathways: application to enhance mechanistic understanding of neurotoxicity. Pharmacol Ther. 179:84–95.
- Bates ME, Massey OC, Wood MD. 2018. Weight-of-evidence concepts: introduction and application to sediment management. U.S. Army Engineer Research and Development Center. No. ERDC/EL SR-18-1. p. 37.
- Baxter L, Brain RA, Hosmer AJ, Nema M, Müller KM, Solomon KR, Hanson ML. 2015. Effects of atrazine on egg masses of the yellow-spotted salamander (Ambystoma maculatum) and its endosymbiotic alga (Oophila amblystomatis). Environ Pollut. 206:324–331.
- Baxter L, Brain R, Rodriguez-Gil JL, Hosmer A, Solomon K, Hanson M. 2014. Response of the green alga Oophila sp., a salamander endosymbiont, to a PSII-inhibitor under laboratory conditions. Environ Toxicol Chem. 33:1858–1864.
- BCPC. 2003. The e-Pesticide manual. Surrey (UK): British Crop Protection Council.
- Becker RA, Ankley GT, Edwards SW, Kennedy SW, Linkov I, Meek B, Sachana M, Segner H, Van Der Burg B, Villeneuve DL, et al. 2015. Increasing scientific confidence in adverse outcome pathways: application of tailored Bradford-Hill considerations for evaluating weight of evidence. Regul Toxicol Pharmacol. 72:514–537.
- Becker RA, Dellarco V, Seed J, Kronenberg JM, Meek B, Foreman J, Palermo C, Kirman C, Linkov I, Schoeny R, et al. 2017. Quantitative weight of evidence to assess confidence in potential modes of action. Regul Toxicol Pharmacol. 86:205–220.
- Blackburn K, Daston G, Fisher J, Lester C, Naciff JM, Rufer ES, Stuard SB, Woeller K. 2015. A strategy for safety assessment of chemicals with data gaps for developmental and/or reproductive toxicity. Regul Toxicol Pharmacol. 72:202–215.
- Borgert CJ, Mihaich EM, Ortego LS, Bentley KS, Holmes CM, Levine SL, Becker RA. 2011. Hypothesis-driven weight of evidence framework for evaluating data within the US EPA's Endocrine Disruptor Screening Program. Regul Toxicol Pharmacol. 61:185–191.
- Borgert CJ, Stuchal LD, Mihaich EM, Becker RA, Bentley KS, Brausch JM, Coady K, Geter DR, Gordon E, Guiney PD, et al. 2014. Relevance weighting of Tier 1 endocrine screening endpoints by rank order. Birth Defects Res B. 101:90–113.
- Borgert CJ, Wise K, Becker RA. 2015. Modernizing problem formulation for risk assessment necessitates articulation of mode of action. Regul Toxicol Pharmacol. 72:538–551.
- Borghoff S, Fitch S, Rager J, Huggett D. 2018. A hypothesis-driven weight-of-evidence analysis to evaluate potential endocrine activity of perfluorohexanoic acid. Regul Toxicol Pharmacol. 99:168–181.
- Brain RA, Schneider SZ, Anderson JC, Knopper LD, Wolf JC, Hanson ML. 2018. Extended fish short term reproduction assays with the fathead minnow and Japanese medaka: no evidence of impaired fecundity from exposure to atrazine. Chemosphere. 205:126–136.
- Breton RL, Gilron G, Thompson R, Rodney S, Teed S. 2009. A new quality assurance system for the evaluation of ecotoxicity studies submitted under the new substances notification regulations in Canada. Integr Environ Assess Manag. 5:127–137.
- Bridges J, Sauer UG, Buesen R, Deferme L, Tollefsen KE, Tralau T, van Ravenzwaay B, Poole A, Pemberton M. 2017. Framework for the quantitative weight-of-evidence analysis of ‘omics data for regulatory purposes. Regul Toxicol Pharmacol. 91:S46–S60.
- Bridges J, Solomon KR. 2016. Quantitative weight of evidence analysis of the persistence, bioaccumulation, toxicity and potential for long range transport of the cyclic volatile methyl siloxanes. J Toxicol Environ Health B. 19:345–379.
- Brockmeier EK, Hodges G, Hutchinson TH, Butler E, Hecker M, Tollefsen KE, Garcia-Reyero N, Kille P, Becker D, Chipman K, et al. 2017. The role of omics in the application of adverse outcome pathways for chemical risk assessment. Toxicol Sci. 158:252–262.
- Browne P, Noyes PD, Casey WM, Dix DJ. 2017. Application of adverse outcome pathways to U.S. EPA's endocrine disruptor screening program. Environ Health Perspect. 125:096001.
- Brusick D, Aardema M, Kier L, Kirkland D, Williams G. 2016. Genotoxicity Expert Panel review: weight of evidence evaluation of the genotoxicity of glyphosate, glyphosate-based formulations, and aminomethylphosphonic acid. Crit Rev Toxicol. 46:56–74.
- Chang LW, Toth GP, Gordon DA, Graham DW, Meier JR, Knapp CW, deNoyelles FJ, Campbell S, Lattier DL. 2005. Responses of molecular indicators of exposure in mesocosms: common carp (Cyprinus carpio) exposed to the herbicides alachlor and atrazine. Environ Toxicol Chem. 24:190–197.
- Chapman PM. 2007. Determining when contamination is pollution – weight of evidence determinations for sediments and effluents. Environ Int. 33:492–501.
- Chen X, Wang J, Zhu H, Ding J, Peng Y. 2015. Proteomics analysis of Xenopus laevis gonad tissue following chronic exposure to atrazine. Environ Toxicol Chem. 34:1770–1777.
- Collier ZA, Gust KA, Gonzalez-Morales B, Gong P, Wilbanks MS, Linkov I, Perkins EJ. 2016. A weight of evidence assessment approach for adverse outcome pathways. Regul Toxicol Pharmacol. 75:46–57.
- D'Angelo J, Freeman E. 2017. Effects of endocrine-disrupting chemical exposure on zebrafish ovarian follicles. Bios. 88:9–18.
- Dekant W, Bridges J. 2016a. Assessment of reproductive and developmental effects of DINP, DnHP and DCHP using quantitative weight of evidence. Regul Toxicol Pharmacol. 81:397–406.
- Dekant W, Bridges J. 2016b. A quantitative weight of evidence methodology for the assessment of reproductive and developmental toxicity and its application for classification and labeling of chemicals. Regul Toxicol Pharmacol. 82:173–185.
- Dekant W, Bridges J, Scialli AR. 2017. A quantitative weight of evidence assessment of confidence in modes-of-action and their human relevance. Regul Toxicol Pharmacol. 90:51–71.
- DeQuattro ZA, Peissig EJ, Antkiewicz DS, Lundgren EJ, Hedman CJ, Hemming JDC, Barry TP. 2012. Effects of progesterone on reproduction and embryonic development in the fathead minnow (Pimephales promelas). Environ Toxicol Chem. 31:851–856.
- dos Santos Mendonça J, Vieira LG, Valdes SAC, Vilca FZ, Tornisielo VL, Santos ALQ. 2016. Effects of the exposure to atrazine on bone development of Podocnemis expansa (Testudines, Podocnemididae). Ecotoxicology. 25:594–600.
- Du Gas LM, Ross PS, Walker J, Marlatt VL, Kennedy CJ. 2017. Effects of atrazine and chlorothalonil on the reproductive success, development, and growth of early life stage sockeye salmon (Oncorhynchus nerka). Environ Toxicol Chem. 36:1354–1364.
- EC. 2006. Concerning the Registration, Evaluation, Authorisation and Restriction of Chemicals (REACH), establishing a European Chemicals Agency, amending Directive 1999/45/EC and repealing Council Regulation (EEC) No 793/93 and Commission Regulation (EC) No 1488/94 as well as Council Directive 76/769/EEC and Commission Directives 91/155/EEC, 93/67/EEC, 93/105/EC and 2000/21/EC. In:REGULATION (EC) No 1907/2006 COUNCIL E. P. A., ed. Brussels. p. 520.
- ECHA. 2010. Practical Guide 2: how to report weight of evidence Helsinki, Finland. European Chemicals Agency. p. 26. http://echa.europa.eu/documents/10162/13655/pg_report_weight_of_evidence_en.pdf
- EFSA. 2017. EFSA Scientific Opinion. Guidance on the use of the weight of evidence approach in scientific assessments. EFSA J. 15:4971.
- Ehrsam M, Knutie SA, Rohr JR. 2016. The herbicide atrazine induces hyperactivity and compromises tadpole detection of predator chemical cues. Environ Toxicol Chem. 35:2239–2244.
- European Food Safety Authority. 2018. EFSA Scientific Colloquium 23–Joint European Food Safety Authority and Evidence-Based Toxicology Collaboration Colloquium Evidence Integration in Risk Assessment: The Science of Combining Apples and Oranges 25–26 October 2017 Lisbon, Portugal. EFSA Supporting Publications. 15:1396E.
- Fuzzen M, Bernier NJ, Van Der Kraak G. 2011. Differential effects of 17β-estradiol and 11-ketotestosterone on the endocrine stress response in zebrafish (Danio rerio). Gen Comp Endocrinol. 70:365–373.
- Fuzzen M, Van Der Kraak G, Bernier NJ. 2010. Stirring up new ideas about the regulation of the hypothalamic–pituitary–interrenal axis in zebrafish (Danio rerio). Zebrafish. 7:7349–7358.
- Gandar A, Laffaille P, Marty-Gasset N, Viala D, Molette C, Jean S. 2017. Proteome response of fish under multiple stress exposure: effects of pesticide mixtures and temperature increase. Aquat Toxicol. 184:61–77.
- Ghodageri MG, Katti P. 2013. In vitro induction/inhibition of germinal vesicle breakdown (GVBD) in frog (Euphlyctis cyanophlyctis) oocytes by endocrine active compounds. Drug Chem Toxicol. 36:217–223.
- Giddings JM, Anderson TA, Hall LW Jr, Kendall RJ, Richards RP, Solomon KR, Williams WM. 2005. A probabilistic aquatic ecological risk assessment of Atrazine in North American surface waters. Pensacola (FL): SETAC Press; p. 432.
- Giddings JM, Campana D, Nair S, Brain R. 2018. Data quality scoring system for microcosm and mesocosm studies used to derive a level of concern for atrazine. Integr Environ Assess Manag. 14:489–497.
- Gross M, Green RM, Weltje L, Wheeler JR. 2017. Weight of evidence approaches for the identification of endocrine disrupting properties of chemicals: review and recommendations for EU regulatory application. Regul Toxicol Pharmacol. 91:20–28.
- Gustafson KD, Belden JB, Bolek MG. 2016. Atrazine reduces the transmission of an amphibian trematode by altering snail and ostracod host-parasite interactions. Parasitol Res. 115:1583–1594.
- Hanson ML, Wolff BA, Green JW, Kivi M, Panter GH, Warne MSJ, Ågerstrand M, Sumpter JP. 2017. How we can make ecotoxicology more valuable to environmental protection. Sci Total Environ. 578:228–235.
- Hecker M, Park JW, Murphy MB, Jones PD, Solomon KR, Van Der Kraak G, Carr JA, Smith EE, Du Preez L, Kendall RJ, et al. 2005. Effects of atrazine on CYP19 gene expression and aromatase activity in testes and on plasma sex steroid concentrations of male African clawed frogs (Xenopus laevis). Toxicol Sci. 86:273–280.
- Hill AB. 1965. The environment and disease: association or causation? Proc R Soc Med. 58:295–300.
- Hoskins TD, Boone MD. 2018. Atrazine feminizes sex ratio in Blanchard's cricket frogs (Acris blanchardi) at concentrations as low as 0.1 µg/L. Environ Toxicol Chem. 37:427–435.
- Hoskins TD, Dellapina M, Boone MD. 2017. Short-term atrazine exposure at breeding has no impact on Blanchard's cricket frog (Acris blanchardi) reproductive success. Environ Toxicol Chem. 36:3284–3288.
- Hosmer AJ, Schneider SZ, Anderson JC, Knopper LD, Brain RA. 2017. Fish short-term reproduction assay with atrazine and the Japanese medaka (Oryzias latipes). Environ Toxicol Chem. 36:2327–2334.
- Jones DK, Dang TD, Urbina J, Bendis RJ, Buck JC, Cothran RD, Blaustein AR, Relyea RA. 2017. Effect of simultaneous amphibian exposure to pesticides and an emerging fungal pathogen, Batrachochytrium dendrobatidis. Environ Sci Technol. 51:671–679.
- Kerney R. 2011. Symbioses between salamander embryos and green algae. Symbiosis. 54:107–117.
- Khalil SR, Reda RM, Awad A. 2017. Efficacy of Spirulina platensis diet supplements on disease resistance and immune-related gene expression in Cyprinus carpio L. exposed to herbicide atrazine. Fish Shellfish Immunol. 67:119–128.
- Khan A, Shah N, Gul A, Sahar N, Ismail A, Muhammad M, Aziz F, Farooq M, Adnan M, Rizwan M. 2016. Comparative study of toxicological impinge of glyphosate and atrazine (herbicide) on stress biomarkers; blood biochemical and hematological parameters of the freshwater common carp (Cyprinus carpio). Pol J Environ Stud. 25:1995–2001.
- Khan A, Shah N, Muhammad M, Khan M, Ahmad M, Farooq M, Adnan M, Jawad S, Ullah H, Yousafzai A. 2016. Quantitative determination of lethal concentration LC50 of atrazine on biochemical parameters; total protein and serum albumin of freshwater fish grass carp (Ctenopharyngodon idella). Pol J Environ Stud. 25:1555–1561.
- Khan A, Yousafzai A, Shah N, Muhammad M, Ahmad M, Farooq M, Aziz F, Adnan M, Rizwan M, Jawad S. 2016. Enzymatic profile activity of grass carp (Ctenopharyngodon idella) after exposure to the pollutant named atrazine (herbicide). Pol J Environ Stud. 25:2003–2008.
- Kirsten KS, Canova R, de Figueiredo Soveral L, Friedrich MT, Frandoloso R, Kreutz LC. 2017. Reduced expression of selective immune-related genes in silver catfish (Rhamdia quelen) monocytes exposed to atrazine. Fish Shellfish Immunol. 64:78–83.
- Klimisch H.-J, Andreae M, Tillmann U. 1997. A systematic approach for evaluating the quality of experimental toxicological and ecotoxicological data. Regul Toxicol Pharmacol. 25:1–5.
- Knutie SA, Gabor C, Kohl KD, Rohr JR. 2018. Do host-associated gut microbiota mediate the effect of an herbicide on disease risk in frogs? J Anim Ecol. 87:489–499.
- LaLone CA, Villeneuve DL, Wu-Smart J, Milsk RY, Sappington K, Garber KV, Housenger J, Ankley GT. 2017. Weight of evidence evaluation of a network of adverse outcome pathways linking activation of the nicotinic acetylcholine receptor in honey bees to colony death. Sci Total Environ. 584–585:751–775.
- Li X, Huo J, Liu Z, Yue Q, Zhang L, Gong Y, Chen J, Bao H. 2019. An updated weight of evidence approach for deriving a health-based guidance value for 4-nonylphenol. J Appl Toxicol. 39:87–100.
- Liu Z, Wang Y, Zhu Z, Yang E, Feng X, Fu Z, Jin Y. 2016. Atrazine and its main metabolites alter the locomotor activity of larval zebrafish (Danio rerio). Chemosphere. 148:163–170.
- Lutter R, Abbott L, Becker R, Borgert C, Bradley A, Charnley G, Dudley S, Felsot A, Golden N, Gray G, et al. 2015. Improving weight of evidence approaches to chemical evaluations. Risk Anal. 35:186–192.
- Martin P, Bladier C, Meek B, Bruyere O, Feinblatt E, Touvier M, Watier L, Makowski D. 2018. Weight of evidence for hazard identification: a critical review of the literature. Environ Health Perspect. 126:076001.
- McMahon TA, Boughton RK, Martin LB, Rohr JR. 2017. Exposure to the herbicide atrazine nonlinearly affects tadpole corticosterone levels. J Herpetol. 51:270–273.
- Mihaich EM, Borgert CJ. 2018. Hypothesis-driven weight-of-evidence analysis for the endocrine disruption potential of benzene. Regul Toxicol Pharmacol. 100:7–15.
- Mihaich E, Capdevielle M, Urbach-Ross D, Slezak B. 2017. Hypothesis-driven weight-of-evidence analysis of endocrine disruption potential: a case study with triclosan. Crit Rev Toxicol. 47:263–285.
- Moermond C, Beasley A, Breton R, Junghans M, Laskowski R, Solomon K, Zahner H. 2017. Assessing the reliability of ecotoxicological studies: an overview of current needs and approaches. Integr Environ Assess Manag. 13:640–651.
- Moermond CT, Kase R, Korkaric M, Ågerstrand M. 2016. CRED: criteria for reporting and evaluating ecotoxicity data. Environ Toxicol Chem. 35:1297–1309.
- Møller P, Jacobsen NR. 2017. Weight of evidence analysis for assessing the genotoxic potential of carbon nanotubes. Crit Rev Toxicol. 47:871–888.
- Olivier HM, Moon BR. 2010. The effects of atrazine on spotted salamander embryos and their symbiotic alga. Ecotoxicology. 19:654–661.
- Olker JH. 2014. Effects of atrazine and climate change on amphibian larval development and growth [thesis]. Duluth: University of Minnesota. p. 238.
- Papoulias DM, Tillitt DE, Talykina MG, Whyte JJ, Richter CA. 2014. Atrazine reduces reproduction in Japanese medaka (Oryzias latipes). Aquat Toxicol. 154:230–239.
- Persch TSP, Weimer RN, Freitas BS, Oliveira GT. 2017. Metabolic parameters and oxidative balance in juvenile Rhamdia quelen exposed to rice paddy herbicides: Roundup®, Primoleo®, and Facet®. Chemosphere. 174:98–109.
- Piva F, Ciaprini F, Onorati F, Benedetti M, Fattorini D, Ausili A, Regoli F. 2011. Assessing sediment hazard through a weight of evidence approach with bioindicator organisms: a practical model to elaborate data from sediment chemistry, bioavailability, biomarkers and ecotoxicological bioassays. Chemosphere. 83:475–485.
- Popoola OM. 2018. Toxicity effect of atrazine on histology, haematology and biochemical indices of Clarias gariepinus. Int J Fish Aquat Stud. 6:87–92.
- Rhomberg L. 2015. Hypothesis-based weight of evidence: an approach to assessing causation and its application to regulatory toxicology. Risk Anal. 35:1114–1124.
- Rhomberg LR, Bailey LA, Goodman JE. 2010. Hypothesis-based weight of evidence: a tool for evaluating and communicating uncertainties and inconsistencies in the large body of evidence in proposing a carcinogenic mode of action–naphthalene as an example. Crit Rev Toxicol. 40:671–696.
- Rhomberg LR, Bailey LA, Goodman JE, Hamade AK, Mayfield D. 2011. Is exposure to formaldehyde in air causally associated with leukemia? – a hypothesis-based weight-of-evidence analysis. Crit Rev Toxicol. 41:555–621.
- Richter CA, Papoulias DM, Whyte JJ, Tillitt DE. 2016. Evaluation of potential mechanisms of atrazine-induced reproductive impairment in fathead minnow (Pimephales promelas) and Japanese medaka (Oryzias latipes). Environ Toxicol Chem. 35:2230–2238.
- Rimayi C, Odusanya D, Weiss JM, de Boer J, Chimuka L, Mbajiorgu F. 2018. Effects of environmentally relevant sub-chronic atrazine concentrations on African clawed frog (Xenopus laevis) survival, growth and male gonad development. Aquat Toxicol. 199:1–11.
- Rocca M, Morford LL, Blanset DL, Halpern WG, Cavagnaro J, Bowman CJ. 2018. Applying a weight of evidence approach to the evaluation of developmental toxicity of biopharmaceuticals. Regul Toxicol Pharmacol. 98:69–79.
- Russart KLG, Rhen T. 2016. Atrazine alters expression of reproductive and stress genes in the developing hypothalamus of the snapping turtle, Chelydra serpentina. Toxicology. 366:1–9.
- Rutkoski CF, Macagnan N, Kolcenti C, Vanzetto GV, Sturza PF, Hartmann PA, Hartmann MT. 2018. Lethal and sublethal effects of the herbicide atrazine in the early stages of development of Physalaemus gracilis (Anura: Leptodactylidae). Arch Environ Contam Toxicol. 74:587–593.
- Rycroft T, Massey O, Foran CM, Linkov I. 2018. Weight of evidence frameworks in evaluation of adverse outcome pathways. A systems biology approach to advancing adverse outcome pathways for risk assessment. Cham: Springer; p. 303–316.
- Sai L, Dong Z, Li L, Guo Q, Jia Q, Xie L, Bo C, Liu Y, Qu B, Li X, et al. 2016. Gene expression profiles in testis of developing male Xenopus laevis damaged by chronic exposure of atrazine. Chemosphere. 159:145–152.
- Sai L, Li L, Hu C, Qu B, Guo Q, Jia Q, Zhang Y, Bo C, Li X, Shao H, et al. 2018. Identification of circular RNAs and their alterations involved in developing male Xenopus laevis chronically exposed to atrazine. Chemosphere. 200:295–301.
- Sai L, Wu Q, Qu B, Bo C, Yu G, Jia Q, Xie L, Li Y, Guo Q, Ng J, et al. 2015. Assessing atrazine-induced toxicities in Bufo bufo gargarizans Cantor. Bull Environ Contam Toxicol. 94:152–157.
- Saka M, Tada N, Kamata Y. 2018. Chronic toxicity of 1,3,5-triazine herbicides in the postembryonic development of the western clawed frog Silurana tropicalis. Ecotoxicol Environ Saf. 147:373–381.
- Scott PD, Coleman HM, Colville A, Lim R, Matthews B, McDonald JA, Miranda A, Neale PA, Nugegoda D, Tremblay LA, et al. 2017. Assessing the potential for trace organic contaminants commonly found in Australian rivers to induce vitellogenin in the native rainbowfish (Melanotaenia fluviatilis) and the introduced mosquitofish (Gambusia holbrooki). Aquat Toxicol. 185:105–120.
- Shenoy K. 2014. Prenatal exposure to low doses of atrazine affects mating behaviors in male guppies. Homone Behav. 66:439–448.
- Shukla S, Jhamtani RC, Dahiya MS, Agarwal R. 2017. Oxidative injury caused by individual and combined exposure of neonicotinoid, organophosphate and herbicide in zebrafish. Toxicol Rep. 4:240–244.
- Snyder MN, Henderson WM, Glinski DA, Purucker ST. 2017. Biomarker analysis of American toad (Anaxyrus americanus) and grey tree frog (Hyla versicolor) tadpoles following exposure to atrazine. Aquat Toxicol. 182:184–193.
- Solomon KR, Stephenson GL. 2017. Quantitative weight of evidence assessment of higher tier studies on the toxicity and risks of neonicotinoid insecticides in honeybees 3: Clothianidin. J Toxicol Environ Health B. 20:346–364.
- Solomon KR, Stephenson GL. 2017a. Quantitative weight of evidence assessment of risk to honeybee colonies from use of imidacloprid, clothianidin, and thiamethoxam as seed treatments: a postscript. J Toxicol Environ Health B. 20:383–386.
- Solomon KR, Stephenson GL. 2017b. Quantitative weight of evidence assessment of higher tier studies on the toxicity and risks of neonicotinoid insecticides in honeybees 1: methods. J Toxicol Environ Health B. 20:316–329.
- Stephenson GL, Solomon KR. 2017a. Quantitative weight of evidence assessment of higher tier studies on the toxicity and risks of neonicotinoid insecticides in honeybees 2: Imidacloprid. J Toxicol Environ Health B. 20:330–345.
- Stephenson GL, Solomon KR. 2017b. Quantitative weight of evidence assessment of higher tier studies on the toxicity and risks of neonicotinoid insecticides in honeybees 4: Thiamethoxam. J Toxicol Environ Health B. 20:365–382.
- Stevenson RW, Chapman PM. 2017. Integrating causation in investigative ecological weight of evidence assessments. Integr Environ Assess Manag. 13:702–713.
- Suter G, Cormier S, Barron M. 2017. A weight of evidence framework for environmental assessments: inferring qualities. Integr Environ Assess Manag. 13:1038–1044.
- Svartz G, Herkovits J, Perez-Coll C. 2012. Sublethal effects of atrazine on embryo-larval development of Rhinella arenarum (Anura: Bufonidae). Ecotoxicology. 21:1251–1259.
- Syngenta. 2015. Atrazine – fish short-term reproduction assay with the Japanese Medaka (Oryzias latipes). Greensboro (NC): Syngenta Crop Protection (unpublished report). No. 528A-275. p. 139.
- Syngenta. 2017a. Atrazine – fish short-term reproduction assay with the Fathead Minnow (Pimephales promelas). Greensboro (NC): Syngenta Crop Protection (unpublished report). No. 528A-315. p. 159.
- Syngenta. 2017b. Atrazine – fish short-term reproduction assay with the Japanese Medaka (Oryzias latipes). Greensboro (NC): Syngenta Crop Protection (unpublished report). No. 528A-275. p. 139.
- Tillitt DE, Papoulias DM, Whyte JJ, Richter CA. 2010. Atrazine reduces reproduction in fathead minnow (Pimephales promelas). Aquat Toxicol. 99:149–159.
- Tulaby Dezfuly Z, Mohammadian T. 2016. Acute toxicity evaluation of five herbicides: paraquat, 2, 4-dichlorophenoxy acetic acid (2, 4-D), trifluralin, glyphosite and atrazine in Luciobarbus esocinus fingerlings. Iran J Vet Med. 10:319–331.
- USEPA. 2016. Refined ecological risk assessment for atrazine. Washington (DC): United States Environmental Protection Agency, Office of Pesticide Programs, Environmental Fate and Effects Division. p. 520.
- USEPA. 2017. Data from Atrazine Ecological Monitoring Program for 2004 to 2017. USEPA website. [accessed 2018 September]. https://www.regulations.gov/docket?D=EPA-HQ-OPP-2003-0367
- Van Der Kraak GJ, Hosmer AJ, Hanson ML, Kloas W, Solomon KR. 2014. Effects of atrazine in fish, amphibians, and reptiles: an analysis based on quantitative weight of evidence. Crit Rev Toxicol. 44:1–66.
- Van Der Kraak G, Matsumoto J, Kim M, Hosmer AJ. 2015. Atrazine and its degradates have little effect on the corticosteroid stress response in the zebrafish. Comp Biochem Physiol C. 170:1–7.
- Walker BS, Kramer AG, Lassiter CS. 2018. Atrazine affects craniofacial chondrogenesis and axial skeleton mineralization in zebrafish (Danio rerio). Toxicol Ind Health. 34:329–338.
- Wang Y, Lv L, Yu Y, Yang G, Xu Z, Wang Q, Cai L. 2017. Single and joint toxic effects of five selected pesticides on the early life stages of zebrafish (Denio rerio). Chemosphere. 170:61–67.
- Weber GJ, Sepulveda MS, Peterson SM, Lewis SS, Freeman JL. 2013. Transcriptome alterations following developmental atrazine exposure in zebrafish are associated with disruption of neuroendocrine and reproductive system function, cell cycle, and carcinogenesis. Toxicol Sci. 132:458–466.
- Weed DL. 2005. Weight of evidence: a review of concepts and methods. Risk Anal. 25:1545–1557.
- Wirbisky SE, Freeman JL. 2017. Atrazine exposure elicits copy number alterations in the zebrafish genome. Comp Biochem Physiol C. 194:1–8.
- Wirbisky S, Freeman J. 2015. Atrazine exposure and reproductive dysfunction through the hypothalamus-pituitary-gonadal (HPG) axis. Toxics. 3:414–450.
- Wirbisky SE, Sepúlveda MS, Weber GJ, Jannasch AS, Horzmann KA, Freeman JL. 2016a. Embryonic atrazine exposure elicits alterations in genes associated with neuroendocrine function in adult male zebrafish. Toxicol Sci. 153:149–164.
- Wirbisky SE, Weber GJ, Schlotman KE, Sepúlveda MS, Freeman JL. 2016b. Embryonic atrazine exposure alters zebrafish and human miRNAs associated with angiogenesis, cancer, and neurodevelopment. Food Chem Toxicol. 98:25–33.
- Wirbisky SE, Weber GJ, Sepúlveda MS, Lin TL, Jannasch AS, Freeman JL. 2016c. An embryonic atrazine exposure results in reproductive dysfunction in adult zebrafish and morphological alterations in their offspring. Sci Rep. 6:21337.
- Wirbisky-Hershberger SE, Sanchez OF, Horzmann KA, Thanki D, Yuan C, Freeman JL. 2017. Atrazine exposure decreases the activity of DNMTs, global DNA methylation levels, and dnmt expression. Food Chem Toxicol. 109:727–734.
- Wrubleswski J, Reichert FW, Galon L, Hartmann PA, Hartmann MT. 2018. Acute and chronic toxicity of pesticides on tadpoles of Physalaemus cuvieri (Anura, Leptodactylidae). Ecotoxicology. 27:360–368.