
Abstract
Traditionally, human health risk assessment focuses on defining the hazard through mammalian toxicity studies followed by exposure estimation. We have explored ways of predicting exposure based primarily on the use scenario and comparing the exposure to reference dose values derived by various regulatory agencies (US EPA, JMPR, and EU Commission) in order to identify mammalian toxicity studies that are relevant to human health risk assessment. Human dietary exposure was based on existing residue data for substances with comparable use on the same or similar crops. Human occupational exposures were based on the use scenarios and application methods. To provide a point of comparison for the exposure predictions, data were collated for acute, chronic and occupational reference dose values derived by various regulatory agencies (US EPA, JMPR, and EU Commission). The exposure predictions and range of hazard endpoints were compared using the ILSI HESI Risk21 risk matrix plots in order to visualise and contextualise the level of potential concern for the exposure prediction. In addition, an approach is proposed to categorise the likelihood of acceptability of risk based on where the exposure sits relative to the distribution of reference dose values. The approaches proposed in this study allow for exposure prediction based on the Good Agricultural Practice (GAP) in conjunction with the use of existing hazard data for crop protection products in order to make an initial determination on acceptability of risk and to identify key studies that are required for human health risk assessment and also opportunities for study waivers.
1. Introduction
Human health risk assessment involves characterisation of both hazard and exposure. For many years, the traditional approach to support the registration of crop protection products has been to generate extensive mammalian toxicity data through the conduct of a sequential series of toxicity studies with the active substance with the aim of fulfilling the various data requirements worldwide. The focus has been on defining the hazard and only then considering the implications for human health risk assessment by contextualisation of the hazard compared to estimated human exposure.
Human health dietary risk assessment for crop protection products is underpinned by robust and reliable exposure data measuring residue levels in crops, livestock, and processed commodities which, when utilised in conjunction with dietary exposure models and food consumption data, allow for a detailed assessment of the potential for human dietary exposure. These assessments are specific to a given region with different dietary habits and with different risk assessment practices taken into consideration.
Human health occupational risk assessment is based on occupational exposure, which can be estimated based on knowledge of the use scenario, application methods and use of established exposure models which again are specific to a given region (e.g. the European Food Safety Authority (EFSA) model in the EU (European Food Safety Authority (EFSA) Citation2014) and The United States Environmental Protection Agency (USEPA) Occupational Pesticide Handler Unit Exposure Surrogate Reference database in the USA (EPA Citation2021a)).
In contrast to the exposure assessment, because the toxicology data requirements across different regions of the world are not fully harmonised, the combined toxicity database to support global registration typically contains a large amount of data that do not contribute to human health risk assessment and can therefore be considered as redundant for the purpose of risk evaluation and risk management (Parsons Citation2012; Wolf et al. Citation2020). A focus on hazard evaluation is also not scientifically justified nor sustainable because “hazard first” evaluation strategies require the use of large numbers of animals and the performance of repetitive and costly studies that contribute little to human or environmental risk-based decisions (Wolf et al. Citation2020).
In recognition of the need to reduce unnecessary vertebrate testing and to focus mammalian toxicology data generation on data of direct relevance to human health risk assessment, there have been a number of initiatives aimed at adopting a more tiered approach to data generation and minimise redundant testing. Doe et al. (Citation2006) published a proposal developed by the Agricultural Chemical Safety Assessment (ACSA) Technical Committee of the International Life Sciences Institute Health and Environmental Sciences Institute (ILSI HESI), for an improved approach to assessing the safety of crop protection chemicals. The goal was to ensure that studies were scientifically appropriate and necessary, and that tests emphasise toxicological endpoints and exposure durations that are relevant for risk assessment (Cooper et al. Citation2006). The ACSA approach was designed to provide more relevant data for deriving reference dose values for shorter time periods of human exposure with fewer studies for deriving longer term reference dose values. More recently, a problem formulation-based conceptual framework was published by ILSI HESI, which presented a roadmap for the assessment process together with a risk matrix as a means of visualisation of exposure relative to toxicity. Together these tools allow for prioritisation of further relevant data generation where more precision is required to make a risk determination (Embry et al. Citation2014; Pastoor et al. Citation2014). In 2019, US EPA issued a memorandum which stated the intent to pursue a reduction in animal testing using new approach methods as alternatives to vertebrate testing (Wheeler Citation2019). The EPA stated its intention to reduce requests for and funding of mammal studies by 30% by 2025 and to eliminate all mammalian study requests by 2035. Within this memorandum the EPA acknowledged the important contribution that study waivers have made to saving the use of over 200 000 laboratory animals over a 7-year period.
Both the ACSA and RISK21 initiatives are focussed on minimising the use of vertebrate animals in mammalian toxicity testing in order to avoid generation of redundant data and to make best use of existing knowledge and alternative approaches to identifying points of departure for use in human health risk assessment. In addition, RISK21 highlights the importance of exposure assessment ahead of hazard identification as a knowledge of the exposure scenarios informs which hazard data would be relevant for risk determination.
In this paper we present approaches to evaluation of the potential for human health risks arising from exposure to crop protection products based on the use of existing hazard and exposure data and the use scenario and Good Agricultural Practice (GAP) as defined by the product label. This was achieved by exploring various approaches to prediction of human exposure based on the use scenario for the substance of interest and through utilisation of existing residue data for substances with comparable use scenarios on the same or similar crops. The starting premise is that the magnitude of exposure primarily depends on the use rate and use scenario of the crop protection product, with the chemical class and pesticidal mode of action having a lesser influence on the exposure potential.
In order to contextualise the acceptability of the predicted exposures, comparisons were made to the abundance of existing mammalian toxicity data for crop protection products from which various regulatory agencies have derived reference dose values (i.e. levels of exposure without appreciable risk to human health) for the purpose of conducting human health risk assessments that form the basis of regulatory decisions for product registration. Reference dose ranges were defined for different regions for fungicides, insecticides and herbicides in order to define an envelope of reference dose values for each pesticidal indication which was then compared to estimations of human exposure obtained from data for products with similar use-scenarios.
Use-specific exposure estimates were compared to the range of reference dose values allowing for an initial determination of potential risks to human health which can be used as a basis for prioritisation of further data generation to provide an acceptable level of precision for regulatory decision making. We have explored different approaches to presentation of exposure and hazard data in order to visualise potential risk including use of the RISK21 matrix. The overall objective was to make the best use of existing knowledge to make an initial judgement on the acceptability of risk for the given use scenarios and to identify priorities for further data generation for refinement where necessary.
To further explore the feasibility of exposure and hazard prediction based on use-scenario for a specific area of chemistry, a specific case was studied for use of succinate dehydrogenase inhibitors (SDHI; Mitochondrial Complex II inhibitors; FRAC Code No. 7) on different crops in the USA and the EU with a focus on using reference dose values for the specific chemical class and an analysis of the study types from which these endpoints are derived as a starting point to inform testing strategies.
2. Methodology
2.1. Collation of reference dose values from different regulatory agencies
In order to make a determination on the risks to human health arising from the use of a crop protection product, it is necessary for regulatory agencies to define levels of exposure that are judged to have reasonable certainty of causing no harm. Separate reference dose values are derived for acute and chronic dietary exposure and various regions utilise different approaches to establishing acceptable levels of exposure for those involved in pesticide application and for post application exposure scenarios. The reference dose data collected herein combine the information from the key toxicological studies and safety or uncertainty factors.
Reference dose data were collated separately for acute, chronic and occupational/worker exposure for fungicides (n = 81 substances), insecticides (n = 62 substances) and herbicides (n = 47 substances) using online information sources summarising the outcome of regulatory decisions made by US EPA (USA regulations.gov), Joint Meeting on Pesticide Residues (JMPR) (https://www.who.int/foodsafety/databases/en/) and the EU Commission’s Pesticide Database (https://ec.europa.eu/food/plant/pesticides/eu-pesticides-db_en). Reference dose ranges were also collated for the SDHIs (n = 21 substances) for a more focussed analysis of reference dose values within a chemical class.
The distribution of reference dose values was defined by the minimum, maximum and percentile values for each pesticide indication (i.e. fungicides, insecticides, and herbicides) and for each regulatory agency.
Although the focus herein is mainly on US EPA and EFSA derived references dose values for the purposes of estimating risk based on exposure from use scenarios, references dose values applicable to dietary exposure from JMPR have been collected and included to allow for further comparison of these derived references dose values across regulatory authorities.
For dietary references dose values in the US, the acute and chronic population adjusted doses (aPADs or cPADs) are presented. The PAD values contain all of the requisite safety factors relevant to a US assessment. For the EU and JMPR, the acute and chronic reference dose values (ARfD or ADI) are presented, which contain the requisite safety factors.
For assessing occupational risk, the most conservative reference dose value was collected in all cases. This provides a conservative approach for acute occupational exposures because the chronic duration reference dose will be lower than the acute duration reference dose.
Additionally, there are differences in the approaches for assigning reference dose value for occupational risk between the US and EU. For the US, occupational exposure limits (OELs) specific to the route of exposure (dermal or inhalation) were calculated and presented; the OEL combines the assigned point of departure and the uncertainty (or safety) factor or margin of exposure (MOE) for the occupational point of departure. For the EU, the acceptable operator exposure level (AOEL) was presented. It is important to note that the AOEL combines not only the assigned point of departure and safety factors, but also a correction factor for oral absorption (if oral absorption is below 80%). Therefore, while the US OEL values presented are route specific, the EU AOEL values are typically not route specific and assumed to be the internal or systemic dose, and are therefore applicable to both inhalation and dermal routes of exposure. As stated above, the acute acceptable operator exposure levels (AAOELs) were not collected for this evaluation as the AOEL values were more conservative and the AAOEL values were limited in their availability.
In addition, it should be noted that the listed reference dose values are subject to change as regulatory agencies periodically review their conclusions and may update the reference dose values.
2.2. Selection of use scenarios and evaluation of exposure potential
For the purpose of this evaluation, a number of use scenarios were identified and used as the basis for exposure prediction. Although the use scenarios were based on actual product labels, the exposure assessors had no knowledge of the product or active substance to be evaluated and were only presented with the GAP as defined on the product label. The use scenarios selected were intended to cover fungicide, insecticide and herbicide uses in the USA and fungicide use in the EU across a variety of different crop scenarios. Exposure potential was assessed for acute and chronic dietary intake for the USA and EU, for all occupational exposures for the USA and for operators, bystanders, and workers that perform post-application activities, for the EU. summarises the use scenarios that were used for exposure prediction and risk evaluation.
Table 1. Use scenarios for exposure prediction and risk evaluation.
2.3. Approaches to estimation and acute and chronic dietary exposure
For the USA use scenarios, exposure evaluation was undertaken using active ingredients. These compounds were selected based on the crop protection product type (i.e. fungicide, insecticide, herbicide) and use on the specific crop of interest (i.e. soya bean, sweet corn or cotton). Where possible, substances with similar GAPs were used. The dietary risk assessment results were evaluated using the Dietary Exposure Evaluation Model (DEEM-FCID version 4.02) for the relevant crop of interest. Exposures were evaluated using the relevant tolerance value for the respective active ingredients and crops and running the assessment assuming 100% crop treated. The Estimated Drinking Water Concentrations (EDWC) were obtained from the most recent relevant EPA assessments for the compounds and were run in DEEM either as water alone or with the relevant tolerance for the crop of interest again assuming 100% crop treated. It should be noted that the driver behind the EDWC in all cases was based on a use other than the crop of interest (i.e. other crop or turf) since other use patterns or application rates led to higher EDWC values. Finally, the EPA aggregate (all crops plus water) assessment results were taken from the most recent EPA risk assessment for the compounds. Thus, for each use scenario, four different outputs were obtained for different sub-populations for the following exposure scenarios:
Estimated dietary exposure for the use scenario (crop) of interest at the tolerance level for each compound
Estimated exposure from US EPA EDWC (worst-case out of all approved uses) for each compound
Estimate of combined dietary exposure for the use scenario of interest at the tolerance level residues used for food commodities and highest EDWC values for drinking water
The US EPA Aggregate assessment (All food at tolerance or refined residues plus EDWC) for each compound
For the European fungicide use scenario on wheat, exposure estimates were obtained using the EU Pesticides Database. For data selection, all pesticide active substances having maximum residue levels (MRLs) set for wheat in the EU were identified and the raw data were exported into Microsoft® Excel® in order to filter out the most relevant information. Because the MRL data was not specific to just fungicides, the data was first sorted to identify only fungicides then all substances with MRLs set at the limit of quantification (LOQ) were removed. This resulted in 36 substances that matched the required scenario. For these 36 substances, detailed GAP information and residue data were obtained using information available on the EFSA website (e.g. from reasoned opinions). This part of the data selection process was based on expert judgement to identify those key residue data supporting the highest residue (HR) and supervised trials median residue (STMR). Once suitable fungicides were identified based on the similarity of the GAP, acute and chronic dietary intakes were estimated using the EFSA PRIMo (Version 3.1; 2019/03/19).
2.4. Estimation of occupational, bystander and re-entry worker exposure
Non-dietary exposures were evaluated using the GAP information provided in . For the USA use scenarios, occupational handler exposures were estimated for the relevant application methods (e.g. aerial, ground boom, etc.) using standard dermal (single layer with gloves) and inhalation (no respirator) unit exposures which express the anticipated exposure per pound of active ingredient handled (EPA Citation2021a). The maximum single application rate for the relevant application scenario was used. The default assumption was used for daily area treated (U.S. Environmental Protection Agency (EPA) Citation2001). For the US EPA dermal assessments, the body weight of an adult was assumed to be 80 kg (U.S. Environmental Protection Agency (EPA) Citation2012) and dermal absorption was assumed to be 100%. The 100% dermal absorption is considered a “Tier I” conservative mean of estimating the potential for dermal exposure and refinements to the percentage of dermal absorption are often made. However, as this evaluation is using conservative methodologies, the use of 100% dermal absorption is employed. These methods follow the standard unrefined procedure for conducting occupational exposure and risk assessments for US EPA.
For the EU use scenario, exposure was predicted using the EFSA model (European Food Safety Authority (EFSA) Citation2014). This provides 95th percentile outputs for acute risk assessment and 75th percentile outputs for longer-term exposure. Acute exposure was predicted for operators, and bystander adults and children. Long-term exposure was predicted for operators, workers and resident adults or children. Hence, bystander exposure predictions were based around the 95th percentile and resident exposure predictions were based on 75th percentiles. Operator exposure was assessed with and without PPE (work wear and gloves during mixing, loading and application). The EU AOEL is derived as a systemic or internal dose and thereby considers exposure through the inhalation, dermal and oral routes. Product specific data for dermal absorption (concentrated formulation = 0.3% and in use formulation dilution: 0.5%) were applied and oral and inhalation absorption were assumed to be 100%.
2.5. Evaluation of acute and chronic dietary exposure for a specific pesticide mode of action using SDHI fungicide use scenarios for USA and EU
In order to evaluate use scenarios within a specific area of chemistry, representative GAPs were selected for the use of an SDHI fungicide in the USA (stone fruit and canola) and the EU (wheat) as shown in . Reference dose data were gathered for SDHI fungicides (i.e. those substance grouped under FRAC Code number 7) based on regulatory decisions taken by US EPA, JMPR and the EU Commission. As stated previously, references dose values from JMPR were included for comparison purposes only; exposure predictions are included for EPA and EU only. Exposure predictions were made based only on the use scenario without knowledge of the chemical or product under evaluation. Fungicides for exposure prediction were identified based on similarity in the GAP rather than substances from the same chemical class.
Table 2. Use scenarios evaluated for SDHI fungicides.
2.6. Comparison of exposure predictions with reference dose values derived by regulatory agencies – contextualisation of potential risk
We explored approaches for comparing the exposure and hazard predictions in a manner that allows the exposure predictions to be contextualised by comparison to the range of reference dose values for a specific region and pesticide use indication. For example, acute exposure predictions for the USA use scenario on fungicides were compared to the range of acute reference doses (aPADs) that US EPA have derived for fungicides. This allows for visualisation of the likely acceptability of a given use scenario based on an understanding of how the exposure estimates relate to a range of reference dose values defined by levels of exposure judged by regulatory agencies to pose acceptable levels of risk for specific substances. We therefore present comparisons of the exposure estimates and reference dose ranges using two different approaches. First, we used the HESI Risk21 Web Tool (https://risk21.org/webtool/) to present the data using the RISK21 risk matrix (Embry et al. Citation2014). Second, we present an approach for comparing the exposure estimates with the reference dose range that allows for a judgement call to be made regarding the acceptability of risk based upon where the range of worst-case exposure estimates sits within the reference dose distribution. Using a pragmatic approach, where the exposure estimate falls below the 5th percentile value for a reference dose range, one can have reasonable confidence that this level of exposure should not pose an unacceptable risk. As conservatism is built into these assessments in the selection of the reference dose values and exposure estimates, where exposure between the 5th and 25th percentile of the reference dose ranges is also considered not pose an unacceptable risk. Once the exposure prediction is within the range of reported reference dose values, the judgement on acceptability becomes more subjective and refinements to the exposure estimates would be useful. presents a proposed approach for judging acceptability of risk.
Table 3. Proposed approach to judge the acceptability of risk based on comparison of predicted exposure with the reference dose range distribution.
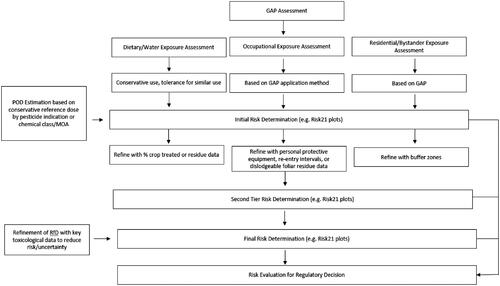
presents a summary the overall approach we propose for risk evaluation based on use scenario and the steps that may be taken to refine the assessment to a sufficient degree that it could be used as a basis for regulatory decision making.
Figure 1. Outline of approach to exposure and hazard prediction for risk evaluation. POD: point of departure; RfD: reference dose; GAP: good agricultural practice; MOA: mode of action.
3. Results
3.1. Reference dose data collated from different regulatory agencies
The detailed reference dose data sets obtained from online regulatory authority sources are provided in supplemental data files, which provide details of each substance for which data was obtained, the different reference dose values agreed by each authority for each substance and the NOAELs, LOAELS, uncertainty factors and key studies upon which these were based. The range of reference dose values are summarised in which present the range of values obtained for each pesticidal indication by region for acute and chronic dietary exposure and for occupational endpoints.
Table 4. Range of Acute Reference Dose (aPAD or ARfD) Values from US EPA, JMPR and the EU.
Table 5. Range of chronic reference dose (cPAD or ADI) values from US EPA, JMPR and the EU.
Table 6. Range of occupational reference values from US EPA and the EU.
It should be noted that reference dose values are not necessarily set for every substance, for example, in many cases the ARfD/aPAD does not need to be set due to lack of acute toxicity. In addition, it wasn’t always possible to obtain all reference dose values for each substance from each of the three regulatory agencies, as not all active ingredients are registered by all regulatory agencies. Consequently, the number of substances in a given reference dose range data set was lower than the total number of substances evaluated.
For the SDHI reference dose values, the number of compounds for which ARfDs/aPADs were available was quite limited. This was due to the fact that a number of substances have only recently been submitted for approval and do not yet have reference dose values established (6 out of 21 evaluated) and some substances (three for Europe and four for the US EPA) did not require an ARfD/aPAD due to lack of acute toxicity. An evaluation of the study type and endpoint that formed the basis of the ARfD/aPAD for the EU and USA is presented in and the basis for the ADI/cPAD in .
Table 7. Basis for acute reference doses (ARfD) set by US EPA and EU commission for SDHI fungicides.
Table 8. Basis for chronic reference doses (ADI/cPAD) set by US EPA and EU commission for SDHI fungicides.
3.2. Assessment of acute and chronic dietary exposure potential using pesticides for the USA use scenarios
The range of worst-case exposure values (i.e. most sensitive sub-population) for each of the pesticide compounds for the acute and chronic dietary exposure are presented in . includes exposure values for the USA use scenarios for a fungicide used on soya beans, an insecticide used on sweet corn, a herbicide used on cotton and for the SDHI use scenario in the USA. More detailed exposure data for each pesticide is presented in Supplementary data Tables A1–A5 in Appendix 1. The range of estimated exposure was defined using the lowest and highest values observed across all of the pesticides for the crop of interest alone at tolerance, estimated drinking water concentration (EDWC), EDWC plus exposure from crop at tolerance, or the US EPA aggregate assessment. These worst-case exposure value ranges were used as the basis for comparison with the reference dose ranges for the respective region and pesticide indication. The purpose of running each of these assessments was to mimic each step in the registration process as a tolerance is established, water is modelled, and additional uses are added for a given chemical.
Table 9. Summary of range of exposure estimates for use scenario in USA – most sensitive population for acute and chronic dietary exposure estimates based on surrogate compounds.
For the USA use scenarios exposure for a single crop at tolerance provided the lowest exposure values and, in most cases, the EDWC made a significant incremental contribution to exposure with the US EPA aggregate assessment, which takes account all crops on the label, giving the highest exposure values. These results were expected; the EDWC is typically the highest exposure contributor in US dietary risk assessments as the models used to obtain the EDWC can overpredict drinking water concentrations (Jackson et al. Citation2005).
3.3. Assessment of acute and chronic dietary exposure potential using pesticides for the EU use scenarios
summarises the acute and chronic exposure predictions for the EU use scenario on wheat and summarises the exposure estimates data for the SDHI EU use scenario on wheat. For the use scenario on wheat, 112 positive (i.e. >LOQ) MRLs were identified 36 of which had a GAP that matched the EU scenario. From this, seven SDHI substances were identified and acute and chronic dietary exposure was assessed for each of them to provide an overall range of exposure for the worst-case sub-population. For the SDHI use scenario on wheat in the EU, 10 SDHI compounds were identified from the same database of EU MRLs, residues data and GAPs.
Table 10. Acute and chronic exposure estimates for EU use scenario on wheat.
Table 11. Acute and chronic exposure estimates for EU use scenario for SDHI on wheat.
3.4. Assessment of occupational exposure for the USA
The occupational exposure estimates for the USA use scenarios are presented in and for the EU use scenario on wheat in .
Table 12. Occupational exposure estimates for USA use scenarios.
Table 13. Acute and long-term occupational exposure estimates for EU fungicide use scenario on wheat.
3.5. Comparison of acute and chronic dietary exposure estimates with reference dose ranges to contextualise potential risk
For the comparison of the dietary exposure with reference dose ranges, the worst-case exposure value ranges from the pesticides for the most sensitive population were used for the respective region and pesticide indication. In addition, the 5th–75th percentile of the range of reference dose values were used from were used for the respective region and pesticide indication.
In order to compare the exposure estimates to the relevant range of reference dose values, we explored different options for presentation and evaluation of the data. The online webtool for the RISK21 risk matrix was used to compare the exposure and hazard data. Alternate plots are available in the Supplementary data. Because the hazard data are reference dose values with margins of safety already built-in, the margin of exposure (MOE) was set to 1. present Risk21 plots for the acute and chronic dietary exposure evaluations for the USA use scenarios for fungicides, insecticides and herbicides. present the acute and chronic exposure evaluations for the USA SDHI use scenarios on stone fruit and canola and presents the EU use scenarios for a fungicide used on wheat and the SDHI use scenario on wheat.
Figure 2. Risk21 plots for fungicide USA use scenario on soya bean for acute and chronic exposure. (a) Soya bean alone at tolerance, (b) EDWC, (c) tolerance plus EDWC, and (d) US EPA aggregate assessment for surrogate substance including all crops on the label and EDWC. Line denotes median reference dose value, toxicity values are 5th and 75th percentile from the aPAD/cPAD range, respectively. Exposure values are for the most sensitive population and worst case surrogate compound for acute or chronic exposures, respectively. Blue box refers to acute duration assessment and black box refers to chronic duration assessment.
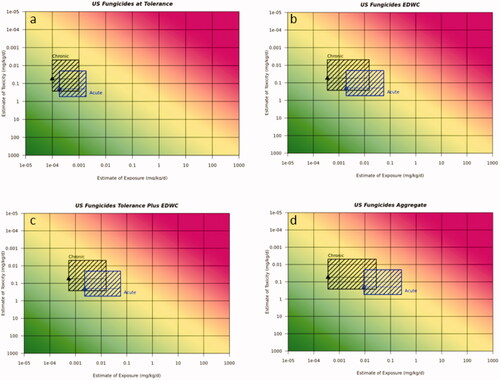
Figure 3. Risk21 plots for insecticide USA use scenario on sweet corn for acute and chronic exposure. (a) Sweet corn alone at tolerance, (b) EDWC, (c) tolerance plus EDWC, and (d) US EPA aggregate assessment for surrogate substance including all crops on the label and EDWC. Line denotes median reference dose value, toxicity values are 5th and 75th percentile from the aPAD/cPAD range, respectively. Exposure values are for the most sensitive population and worst case surrogate compound for acute or chronic exposures, respectively. Blue box refers to acute duration assessment and black box refers to chronic duration assessment.
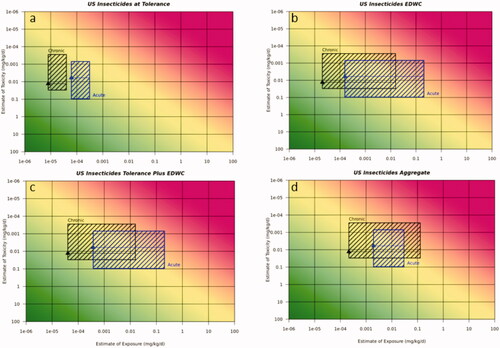
Figure 4. Risk21 plots for herbicide USA use scenario on cotton for acute and chronic exposure. (a) Cotton alone at tolerance, (b) EDWC, (c) tolerance plus EDWC, and (d) US EPA aggregate assessment for surrogate substance including all crops on the label and EDWC. Line denotes median reference dose value, toxicity values are 5th and 75th percentile from the aPAD/cPAD range, respectively. Exposure values are for the most sensitive population and worst case surrogate compound for acute or chronic exposures, respectively. Blue box refers to acute duration assessment and black box refers to chronic duration assessment.
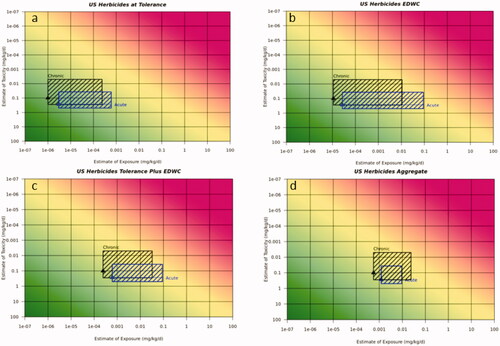
Figure 5. Risk21 plots for SDHI USA use scenario on stone fruit for acute and chronic exposure. (a) Stone fruit alone at tolerance, (b) EDWC, (c) tolerance plus EDWC, and (d) US EPA aggregate assessment for surrogate substance including all crops on the label and EDWC. Line denotes median reference dose value, toxicity values are 5th and 75th percentile from the aPAD/cPAD range, respectively. Exposure values are for the most sensitive population and worst case surrogate compound for acute or chronic exposures, respectively. Blue box refers to acute duration assessment and black box refers to chronic duration assessment.
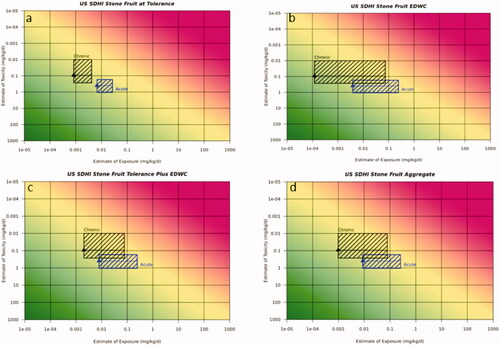
Figure 6. Risk21 plots for EU use scenarios on wheat. (a) Fungicide on wheat acute dietary exposure (b) fungicide on wheat chronic dietary exposure (c) SDHI on wheat acute dietary exposure (d) SDHI on wheat chronic dietary exposure. Line denotes median reference dose value, toxicity values are 5th and 75th percentile from the aRfD/ADI range, respectively. Exposure values are for the most sensitive population and worst case surrogate compound for acute and chronic exposures, respectively. Blue box represents acute duration exposure and black box represents chronic duration exposure.
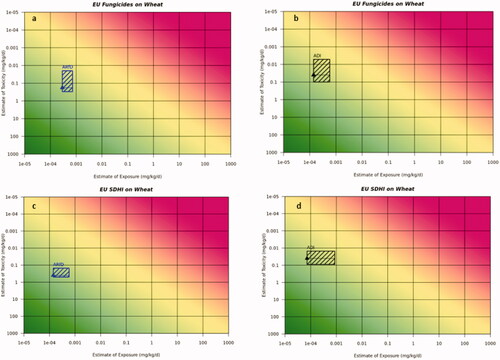
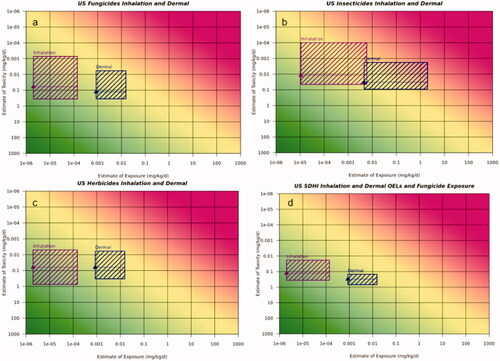
Figure 7. Risk21 plots for US occupational exposure via inhalation and dermal routes of exposure. (a) Fungicide use scenario, (b) Insecticides use scenario, (c) Herbicide use scenario, and (d) USA SDHI scenario. Line denotes median calculated occupational exposure level (OEL) reference dose value, toxicity values are 5th and 75th percentile from the range of derived dermal and inhalation occupational reference dose ranges for the USA. Exposure values were derived from the most conservative (highest potential for) exposure for inhalation and dermal exposures. Magenta box represents inhalation exposures and dark blue box represents dermal exposures.
In all cases, exposure estimates for the crop of interest at tolerance demonstrated acceptable risk for both the acute and chronic exposure scenarios using the Risk21 plots. The addition of the EDWC to the exposure assessment resulted in the upper range of estimated exposure that was above the MOE line and hence indicative of potential unacceptable risk. The impact of the EDWC was particularly evident for the acute insecticide exposure scenario and to a somewhat lesser extent for the chronic insecticide exposure scenario. This was less evident for the fungicide and herbicide use scenarios where exposure was mostly below the MOE for both acute and chronic exposure.
As discussed in the method sections, it is possible to make a judgement call on acceptability of risk based on where the predicted worst-case exposure sits in the distribution of reference dose values. present a comparison of the worst-case acute and chronic dietary exposure estimates for the USA and EU use scenarios with the relevant reference dose range together with a judgement call on the likely acceptability of risk based upon how the exposure estimate relates to the various percentile values of the reference dose distribution using the assessment scheme outline in .
Table 14. Judgement on acceptability of risk: acute exposure for USA use scenarios.
Table 15. Judgement on acceptability of risk: chronic exposure for USA use scenarios.
Table 16. Judgement on acceptability of risk: fungicides and SDHI use scenarios for the EU acute and chronic exposure.
Using this approach, the acute exposure predictions for the fungicide use scenario on soya bean in the USA indicated that the acute and chronic risk was likely not to pose an unacceptable risk, with the exception of the EPA’s aggregate exposure assessment for acute exposure which fell within the 50th–75th percentile of the reference dose range distribution, reflecting the higher contribution of all crops on the label. For the insecticide use scenario in the USA, the use on sweet corn alone at tolerance was concluded to not pose an unacceptable risk for acute and chronic exposure, however adding the drinking water contribution gave unacceptable levels of risk (i.e. exposure >75th percentile of aPAD range) for the acute exposure with drinking water alone, drinking water plus sweet corn at tolerance. For chronic exposure, the US EPA aggregate assessment gave exposure >95th percentile of the cPAD range indicating unacceptable risk and gave potentially unacceptable risk (exposure in the 50th–75th percentile of the cPAD range) for the drinking water plus sweet corn. The herbicide use scenario on cotton gave acceptable acute and chronic exposures at tolerance and in the aggregate assessment, however the drinking water contribution and dietary plus drinking water contribution resulted in exposures >25th percentile, thus additional refinements would be useful to increase the confidence that the exposures would not pose an unacceptable risk. The acute SDHI use scenarios on stone fruit and canola gave acceptable levels of risk (below 25th percentile), whereas for chronic exposure, the US EPA contribution of drinking water and the aggregate assessments indicated the need for refinements as exposures were above the 25th percentile.
For the EU fungicide use scenario on wheat and EU SDHI on wheat, exposure predictions were <5th percentile of the respective acute and chronic reference dose range indicating acceptable risk.
3.6. Comparison of occupational exposure estimates with reference dose ranges to contextualise potential risk
presents the occupational Risk21 plots for the US use scenarios for fungicides on soya bean, insecticides on sweet corn and herbicides on cotton focussing on occupational inhalation and dermal exposure, as these routes of exposure are evaluated separately in the US. Supporting exposure estimates are available in . Based on the Risk21 plots, exposure estimates for inhalation exposure demonstrated no unacceptable risk for occupational exposure in the US for fungicides, herbicides and SDHIs. However, using this approach, inhalation exposure for insecticides did indicate the potential for unacceptable risk. Based on the Risk21 plots, dermal occupational exposure, using a default 100% dermal absorption factor, indicate the potential for unacceptable risk for fungicides, herbicides and insecticides. Dermal exposure specific to the SDHI fungicides reduces the potential for unacceptable risk.
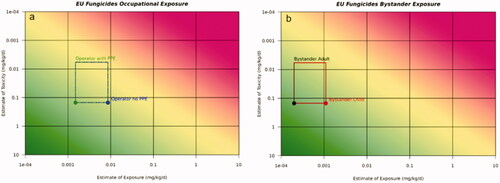
presents the EU acute and long-term occupational (operator) exposure scenarios for fungicides on wheat. As stated before, the AOEL reference dose is a systemic dose, incorporating a correction factor for absorption. As such, the AOEL is considered an internal dose and both inhalation and dermal exposures are considered together for the EU. For this evaluation, only the AOEL reference dose value were used for both acute and long-term exposures. The supporting exposure estimates are available in . Based on the Risk21 plots, exposure estimates for acute- and long-term operator exposures demonstrated no unacceptable risk for fungicides in the EU. Additionally exposures to fungicides uses on wheat in the EU also demonstrated no unacceptable risk for bystander and residential exposure (available in the supplemental data).
Figure 8. Risk21 plots for acute (a) and long-term operator (b) with and without PPE exposures for EU fungicide use scenario on wheat. Line denotes median reference value, toxicity values are 5th and 75th percentile from the range of systemic AOELs for fungicides in the EU.
4. Discussion
In this evaluation, we have evaluated approaches to estimate potential human exposure to crop protection products based on their use scenario and to contextualise the acceptability of the exposure estimates by comparison to reference dose ranges derived by different regulatory agencies. In order to present a visual comparison of exposure and potential hazard we have used the Risk21 matrix and also explored alternative approaches of data presentation to further contextualise the acceptability of risk.
4.1. Reference dose data
There are extensive toxicological data requirements for crop protection products and the majority of these studies use animals. For a single new active ingredient, 5000–7000 animals are necessary to develop the toxicological data set for a single active ingredient (Craig et al. Citation2019). Many of these toxicological studies are duplicative and are conducted only to fill toxicological data requirements, adding no useful information on the toxicological profile of the active ingredient, or having an impact on the selection of reference dose values. Animal studies include multiple repeated dose studies of 28-day, 90-day, 1-year and 2-year duration, which all evaluate the same endpoints. New approaches that reduce, refine, and replace (3Rs) animal studies while still providing the regulatory agencies with critical valid information are imperative. The approach proposed herein provides a tiered approach to hazard identification based on conservative existing hazard data and allowing for refinement based on chemical family or mode of action, with only directed animal testing conducted to refine PODs only to when necessary to refine risk evaluations.
There are different ways in which the distribution of reference dose values can be derived and used to contextualise exposure. In this study we chose to derive values by region separating data from US EPA, EU and JMPR and also separating the data by pesticide indication for fungicides, insecticides and herbicides. Whilst this may be viewed as creating a data set that is more relevant to the exposure scenario and the regulatory framework under which it will be evaluated, it does reduce the number of data points. This becomes more apparent when further refining the data set for a specific pesticide mode of action as was the case for the SDHI use scenario. An alternative approach would be to pool a larger data set and include, for example, all insecticide ARfDs from each region into a single data set giving a much larger number of data points.
Reference dose data are available for a larger number of chemicals than we have collated in this study, for example the EU pesticides database lists over 1000 substances, and also from other regulatory agencies so there is considerable scope to further expand these data sets. As reflected by the evaluation of the SDHI use scenarios, it is also possible to evaluate the basis of the NOAELs and LOAELs upon which the reference dose values are derived for a specific mode of action or chemistry and the study types from which they came in order to identify the type of toxicity studies are likely to drive reference dose derivation and also which studies are more likely to be redundant. However, it should be noted that this level of detail is very time consuming to extract from the available online information sources. As regulatory agencies further develop their information resources consideration should be given to the development of databases that capture these detailed aspects of the approval decision making process.
Few studies have attempted to define reference dose ranges based on existing regulatory decisions. An alternative approach was taken by Yoshida et al. (Citation2013) who simulated the ARfD setting process of the regulatory agencies for 201 pesticides for which they were able to set ARfDs for over 90% of the substances evaluated with 30% of substances not requiring an ARfD due to lack of acute toxicity. A detailed analysis was provided of the study type from which the ARfD was derived for each pesticidal mechanism of action and also the mean reference dose values for each chemical class. However, this approach is very time consuming compared to the use of published reference dose values and it relied upon evaluation reports which did not always contain all relevant information. In a study that evaluated the utility of probabilistic exposure modelling for acute dietary risk assessment, Crépet et al. (Citation2021) published a list of ARfDs for 89 pesticides evaluated by JMPR, although the basis for derivation of the ARfD was not provided.
ARfD/aPAD values were generally higher for herbicides than for fungicides and insecticides, with insecticides having the lower values. This is not unexpected based on the premise that some classes of insecticide tend to be more acutely toxic to mammals, although this does not apply to all insecticides. The minimum chronic reference dose values were also lower for insecticides than for fungicides and herbicides. It was also noted that much fewer ARfDs/aPADs were available for herbicides than for fungicides and insecticides which may reflect the fact they tend not to be as acutely toxic. These observations are consistent with the study by Yoshida et al. (Citation2013) who unsurprisingly identified cholinesterase inhibitors as having the lowest ARfDs.
The collation of reference dose data and derivation of ranges of acceptable exposure has some parallels with the use of the threshold of toxicological concern approach (Kroes et al. Citation2004; Barlow Citation2005). However, in contrast to TTCs, which are derived from a lower bound value from a distribution of NOAELs for specific toxicological end points such as genotoxicity, teratogenicity or carcinogenicity, reference dose values represent levels of exposure that are deemed acceptable in terms of risk to human health from a specific chemical having been derived through application of appropriate uncertainty (safety) factors.
The collection and presentation of reference dose data for the US EPA, JMPR, and EU provide useful information on the ranges of references dose values and the extensive data available from the reviews conducted on the regulatory agencies. These data provide an initial approach to assess the hazard potential of new active ingredients, without the generation of extensive, duplicative animal studies. It is important to consider that reference dose values for each pesticide is based on 5000–7000 animals (Craig et al. Citation2019) and redundancy of testing. Therefore, each reference dose value is based on the entire data package evaluated by a regulatory authority.
In application, the assignment of the reference dose for the acute and chronic dietary and occupational risk evaluations can be selected based each type of pesticides, each region, or all pesticides and regions together. If exposure is low, then the most conservative reference dose values provides a conservative approach to assessing risk. This paper presents a sampling of the overall number of pesticides of each type and regions. This may be adequate when exposures are low. The point being that additional animal testing will not impact the overall dietary or occupational risk assessment when exposures are low.
As the exposure becomes higher, the impact of the selected reference dose values becomes more important to the assessment. If exposure is high, then refinement of the reference dose values for the selected pesticide of interest becomes necessary. As stated previously, the selected reference dose values can be based on the chemical class/mode of action. This approach narrows the number of samples, however the available reference doses are more applicable to the specific pesticide of interest. However, structural and mode of action similarity increases the confidence in the selected reference dose values and therefore decreases the number of reference doses necessary. Justification of the use a decreased number of references dose values must be provided based on similarities between the compounds. Directed toxicological testing based on the key studies for the chemical class/mode of action would increase the confidence in the selected reference doses.
4.2. Exposure estimates for USA use scenarios
For the exposure estimates based on the USA use scenarios, a key decision is the selection of pesticides used in the evaluation. Where possible pesticides were selected based on the crop protection product type (i.e. fungicide, insecticide, or herbicide), use on the specific crop of interest (i.e. soya bean, sweet corn or cotton) and, where possible, similarity in the GAP. This approach places greater emphasis on the use scenario as the key driver for determining exposure potential and is intended to be agnostic with respect to chemical structure and pesticidal mode of action.
Our exposure estimates assumed 100% crop treated which is a fairly standard conservative assumption and could be refined with more specific usage data if available. Other refinements to the occupational exposure assessment could also be applied and include, but are not limited to, the use of personal protective equipment and the percent of the market share of the market leader (% crop treated). Further risk management options could include no spray “buffer” zones for bystanders and residents and minimum re-entry intervals for post application workers.
Estimation of exposure specifically for the crop of interest allows the contribution of a single crop to be understood. Thus, this approach may be particularly useful when understanding the contribution that additional crops that may be added to a product label are included, as would be the case for a new active substances where, in many cases, the number of crops on the product label may be expanded over time. Therefore, this approach to exposure estimation can be used in the absence of product specific residue data as a tool to inform the potential acceptability of risk for crops of potential interest. The US EPA aggregate exposure assessment was used to represent a worst-case exposure from a mature product with a broad label. It is important to note that whilst this US EPA aggregate assessment was used as a basis for making a worst-case exposure prediction, in contrast to the regulatory evaluation of these substances where exposure is compared to the specific aPAD/cPAD for the substance itself, our study compared this exposure to the relevant reference dose range distribution. Consequently, in our study the US EPA aggregate assessment may give exposure estimates that suggest potentially unacceptable risk in contrast to US EPA’s acceptable regulatory risk assessment upon which the product is specifically approved.
We reported the range of exposure estimates from the lowest to highest values obtained across all the compounds for the use scenario of interest. The number of pesticides chosen was 4–5 compounds, which was judged to give a reasonable reflection of exposure potential for the use of interest. A larger number of compounds could be used if these are readily available, but a balance needs to be struck between the resource required to run the exposure estimates and the confidence that the predictions provide a representative range of predicted exposures. Evaluation of exposure from water poses certain challenges. For an active ingredient where the label expanded over time, the worst-case water modelling would change as crops or use rates changed over time. Here the compounds included multiple crops and uses already and therefore this change was not as obvious. Finally, it should also be noted that exposure from water modelling is often considered conservative with limited options for refinement using higher tiered modelling. Previous research has shown that models (FQPA Index Reservoir Screening Tool (FIRST) (EPA 2021b) and Pesticide Root Zone Model for GroundWater (PRZM)/Pesticide Root Zone Model for GroundWater (EXAMS) (EPA 2021b)) commonly used to estimate concentrations of crop protection chemicals in drinking water can overpredict concentrations by several orders of magnitude, and a general overprediction factor of 20 was estimated (Jackson et al. Citation2005).
4.3. Exposure estimates for EU use scenarios
Identification of compounds for the EU exposure scenario was based on MRL data extracted from EU Pesticides Database. This database was interrogated to provide MRL information for the crop of interest (wheat), by searching for correlations between GAP criteria (location, rate, timing, etc.) and residues data (MRL, HR, STMR values) for pesticides used on wheat. Detailed residues data including individual measured values for each crop and substance was then collated using information resources on the EFSA website. The resulting data set of MRLs, detailed residue data and GAP information was used to identify suitable compounds which were then subject to dietary risk assessment using the standard European model (i.e. European Food Safety Authority (EFSA) (Citation2021) Pesticide Residue Intake Model (PRIMo) revision 3.1) to provide the basis of our risk predictions. The worst-case range of exposures was then compared to the relevant reference dose range for the EU.
The established data set can be used to model potential exposures to various critical use patterns/GAPs (including less critical GAPs that fall within the established risk envelope) but is limited to the substance type and crop scenarios tested (i.e. use of EU approved fungicide/SDHI substances on wheat). Nonetheless, the scope could be extended to other potential substances and use patterns in order to make a broader range of exposure predictions. However, the methodologies employed for data collection required manual approaches and expert judgement to ensure that appropriate residues data were retrieved from relevant EU data sources (e.g. EU Pesticides Database, EFSA journals, Draft Assessment Reports (DARs), etc.) and ultimately relies on the underpinning residues data to be freely available, accurate, and up-to-date. It is important to note that there can be instances where there are discrepancies and errors in reporting between various EU data sources (e.g. DAR and EFSA journals) and this requires careful consideration to investigate the true origin of the key residue data endpoints. The success of the methodology in providing an accurate exposure estimate therefore does inherently rely on the accuracy of reporting at EU level. Moreover, it highlights the need for all such residues data/endpoints (i.e. residues endpoints underpinning a specific use/GAP and associated STMR, HR and MRL values) to be accurately monitored, updated, recorded and incorporated into the EU Pesticides Database (or a similar, standalone database). Often, such data are only readily available and accessible to Competent Authorities, EU Member States and EFSA. Therefore, open access to such data would facilitate and harmonise the future conduct of routine risk assessments, enabling stakeholders to perform more accurate and robust risk assessments as part of their substance portfolios and regulatory submissions. The cost and time to develop and maintain these supporting data are not prohibitive. The cost and time required to gather and document the hazard and exposure data in the approach described herein are less than that required for the conduct of animal studies.
4.4. Comparison of exposure with reference dose ranges
The RISK21 webtool provides a useful basis for comparison of exposure and hazard data in order to contextualise risk against the required margin of exposure depending on the assessment presented. In this case, because the RISK21 matrix is comparing exposure with reference dose values as opposed to NOAELs, the MOE was set to 1. Therefore, the judgement on acceptability of exposure is made largely based on the proportion of exposure appearing above the yellow line depicting the MOE (). In addition to the Risk21 plots, we developed a subjective approach to contextualise risk based on where the exposure estimate sits within the range of reference dose values. Generally speaking, if exposure was below the 25th percentile of the reference dose range, the exposure was likely not to pose an unacceptable risk. Exposures above the 25th percentile, decreases the likelihood that the exposure would not pose an unacceptable risk and therefore identifies the need to refine the exposure prediction, the reference dose range or both. The criteria applied to make a judgement call on risk can be adapted depending on the scenario being assessed, the uncertainties and conservatism in the exposure and hazard predictions and the question that the assessment is intended to address.
The options for refinement of the assessment will vary from more detailed analysis of existing data such as using reference dose values for the specific chemical class if available, refinement of the exposure assessment (for dietary assessments this can involve refinement of residues such as averages from field trials or monitoring, percent crop treated estimates, water monitoring data, and Monte Carlo assessments using residue distributions for food and water in acute assessments).
The dietary assessments for the USA use scenarios for fungicides and herbicides generally indicated the exposures do not pose an unacceptable level of risk for both acute and chronic exposure, as was the case for the EU use scenarios. However, for insecticides, the exposure assessment showed the potential for unacceptable risk or potentially unacceptable risk once the drinking water component was introduced whereas acute and chronic exposure from sweet corn alone was acceptable. Thus, the drinking water contribution is identified as a key parameter for refinement for this assessment.
The Risk21 plots for the acute and chronic exposure estimates for the use of a fungicide on wheat in the EU and the use of an SDHI on wheat in the EU indicated acceptable risk. In contrast to the US exposure predictions that included food and drinking water, the exposure predictions for the EU use scenarios were based on consumption data in the EFSA PRIMo only for raw and processed crop commodities in conjunction with residue data. In the EU, if the predicted environmental concentration (PEC) in ground water is <0.1 µg/L, then exposure from drinking water is considered “acceptable” and no further assessment is required.
For the US occupational assessments, occupational exposure is driven by the dermal route as generally speaking, there is typically lower exposure via the inhalation route of exposure compared to dermal route of exposure. For fungicides and herbicides, the occupational exposures indicated the exposures are likely to not pose an unacceptable risk. For insecticides the upper estimates of exposure indicated unacceptable risk especially for the dermal route of exposure, where dermal absorption was assumed to be 100%, indicating the need for refinement.
The EU acute and long-term operator exposure estimates were likely not to pose an unacceptable risk for the use scenario on wheat when compared to the range of AOEL values.
The options for refinement of the assessment will vary from more detailed analysis of existing data such as using reference dose values for the specific chemical class or mode of action, if available, or refinement of the exposure assessment (for occupational assessments these include refinements to the default dermal absorption factor, inclusion of additional PPE, and evaluation of dislodgeable foliar residues).
4.5. Evaluation of SDHI mode of action
The primary purpose of the SDHI case study was to focus on using hazard data specific to the chemical class/mode of action under evaluation. One challenge of focussing the hazard data on a specific chemical class/mode of action is that there are a much smaller number of substances in the data set. It was noted for the SDHIs that there are still several new substances in the evaluation process, which do not yet have references dose values established. This is particularly the case for the ARfD/aPAD because the acute reference dose is not derived for substances that do not exhibit acute toxicity. Typically where ARfDs/aPADs were set for the SDHIs, these were based on acute neurotoxicity studies or developmental toxicity studies both in the EU and USA with only once substance (isopyrazam) having an aPAD set by US EPA based on clinical signs of toxicity in the initial days of dosing in a 90 day dog study. However, resulting aPAD of 0.3 mg/kg bw was higher than the corresponding ARfD of 0.2 mg/kg bw set by the EU based on a rat developmental toxicity study. It is important to note that the use of the acute neurotoxicity or developmental toxicity studies for ARfD/aPAD setting does not indicate that the SDHIs are predominantly neurotoxic or developmental toxins, rather the choice of this study type reflects the duration of exposure as one that is more relevant to ARfD/aPAD setting than in other study types.
The selection of the acute neurotoxicity study, or developmental toxicity study, as the key study for the ARfDs/aPADs is also reflected in the larger reference dose data sets collated for the fungicides, insecticides and herbicides (see supplemental data files). However, certain chemical classes, such as pyrethroids, the dog tends to be the more sensitive species hence ARfDs/aPADs are frequently based on clinical signs of toxicity in the initial days of dosing in sub-chronic dog studies. There may also be some regional preferences, as in the EU the ARfD was most frequently set based on developmental toxicity studies (5/13 substances evaluated) with endpoints based on either effects in offspring or maternal effects shortly after commencement of dosing whereas US EPA tended to set the ARfD/aPAD on the acute neurotoxicity study (8/13 substances). A recent study (Moxon et al. Citation2020), has shown that, in the EU, most ARfDs are derived from repeat dose studies and that there is an over-representation of prenatal developmental toxicity studies, in particular ARfDs may be inappropriately derived if they are based on maternal effects in the rabbit.
In most cases, the ADIs/cPADs for the SDHIs are based on histopathological effects in liver and or thyroid and, mean body weight decreases observed in the combined rat chronic toxicity/carcinogenicity study and less frequently the mouse. Occasionally the ADI/cPAD is based on effects on these end points in the 2-generation reproductive toxicity study (inpyrfluxam and isofetamid in the USA and penthiopyrad in the EU). Although we did not collate data from subchronic toxicity studies as part of this exercise, the data sources reviewed indicate that for most SDHIs that cause liver, thyroid and body weight effects in long-term studies, these effects are also seen with sub-chronic dosing in 28 day and 90 day toxicity studies and there appears to be little difference between the NOAELs and LOAELs seen in sub-chronic and chronic toxicity studies (see supplemental data files) suggesting that points of departure could be readily derived from sub-chronic studies with appropriate safety factors used for derivation of the ADI/cPAD. This observation is consistent with other studies comparing sub-chronic and chronic toxicity endpoints which show that a factor of two may be sufficient to extrapolate from one to the other (Guth et al. Citation2020).
Although the SDHI data set was fairly limited in number, it illustrates that using the available chemical specific hazard data (e.g. triazoles, pyrethroids or strobilurins) or data for a specific mode of action class (e.g. SDHI, inhibitors of fatty acid synthesis, photosystem two inhibitors) can make a key contribution to understanding of which hazard data would be important to prioritise to provide the key data for reference dose derivation and human health risk assessment. The detailed assessment of these existing data should therefore provide the basis for a dialogue between the registrants and regulators to agree which studies are key and which may be viewed as redundant and subject to waiver. This would be of particular value for new active ingredient testing programs where the opportunities for waiving unnecessary studies may be significant. In the case of a new SDHI for example, it could be foreseen that the conduct of rat and rabbit developmental toxicity studies and the acute neurotoxicity study would provide sufficient data to derive an ARfD/aPAD for SDHIs. Similarly for chronic toxicity, most of the ADIs/cPADs were based on the 2 year rat study or the 2-generation reproductive toxicity study. If similar points of departure are observed in sub-chronic studies in the rat, it may be possible to reliably predict the ADI/cPAD using shorter-term studies. As in vitro and in silico methodologies become more accepted and harmonised by regulatory authorities, these types of approaches will replace further reduce the need for even targeted animal testing.
5. Conclusions
This evaluation demonstrates the usefulness of starting human health risk determinations with a tiered approach using dietary and occupational exposures for a specific crop of interest and existing regulatory agency reference dose data. Using the Risk21 approach, this tiered methodology can identify the potential for unacceptable risk based on the proposed crop and use scenario and identify the need for refinements of exposure and hazard. Detailed evaluation of existing hazard data for a specific chemical class or mode of action can help to identify the key studies that are required for human health risk assessment and also to identify opportunities for study waivers. This approach reduces the reliance on conducting new and redundant animal testing in line with the international commitment to refine, replace and refine animals studies (3Rs) while still providing the regulatory agencies with critical toxicological information and maintaining the risk standard of the regulatory agencies. The reliance of existing reference dose data in this risk based approach provides a conservative worst-case approach for identifying endpoints for risk assessment (ARfD/aPAD, ADI/cPAD) while replacing or reducing the need to for new animal testing. The exposure-first approach allows for refinement of risk through refining potential exposures with toxicological studies conducted only if necessary and refined for the animal testing to impact the selection or refinement of the endpoint(s) for risk assessment.
Supplemental Material
Download MS Word (46.9 KB)Supplemental Material
Download MS Word (175.4 KB)Acknowledgements
HG2 8RE, UK. A draft of this manuscript was reviewed by the following members of Crop Life International: Manoj Aggarwal, Corteva Agriscience and Ramanarayanan Tharacad, Syngenta. The final decision whether to accept or reject comments from Crop Life International was at the sole discretion of the authors. The authors gratefully acknowledge the advice of the editor and also the comments of the four reviewers selected by the editor, which helped to improve the quality of final version of the manuscript.
Declaration of interest
There are no conflicts of interest for any of the authors to disclose related to the submission of this manuscript. At the time of writing all authors are affiliated with Exponent, a publicly listed consulting firm headquartered in Menlo Park, California USA. None of the authors of this paper have been involved in the last 5 years with regulatory or legal proceedings related to the contents of the paper.
Supplemental material
Supplemental data for this article is available online at https://doi.org/10.1080/10408444.2021.1987384.
Additional information
Funding
References
- Barlow S. 2005. Threshold of toxicological concern (TTC) – a tool for assessing substances of unknown toxicity present at low levels in the diet. International Life Science Institute Europe Concise Monograph Series.
- Cooper RL, Lamb JC, Barlow SM, Bentley K, Brady AM, Doerrer NG, Eisenbrandt DL, Fenner-Crisp PA, Hines RN, Irvine LF, et al. 2006. A tiered approach to life stages testing for agricultural chemical safety assessment. Crit Rev Toxicol. 36(1):69–98.
- Craig E, Lowe K, Akerman G, Dawson J, May B, Reaves E, Lowit A. 2019. Reducing the need for animal testing while increasing efficiency in a pesticide regulatory setting: lessons from the EPA Office of Pesticide Programs' Hazard and Science Policy Council. Regul Toxicol Pharmacol. 108:104481.
- Crépet A, Luong TM, Baines J, Boon PE, Ennis J, Kennedy M, Massarelli I, Miller D, Nako S, Reuss R, et al. 2021. An international probabilistic risk assessment of acute dietary exposure to pesticide residues in relation to codex maximum residue limits for pesticides in food. Food Con. 121:107563.
- Doe JE, Boobis AR, Blacker A, Dellarco V, Doerrer NG, Franklin C, Goodman JI, Kronenberg JM, Lewis R, McConnell EE, et al. 2006. A tiered approach to systemic toxicity testing for agricultural chemical safety assessment. Crit Rev Toxicol. 36(1):37–68.
- Embry MR, Bachman AN, Bell DR, Boobis AR, Cohen SM, Dellarco V, Dewhurst I, Doerrer NG, Hines RN, Moretto A, et al. 2014. Risk assessment in the 21st century: roadmap and matrix. Crit Rev Toxicol. 44(sup3):6–16.
- European Food Safety Authority (EFSA). 2014. Guidance on the assessment of exposure of operators, workers, residents and bystanders in risk assessment for plant protection products. Efsa J. 12(10):3874–3855.
- European Food Safety Authority (EFSA). 2021. Pesticide evaluation: Tools. Calculators-Tools. PRIMo – Pesticide Residue Intake Model. https://www.efsa.europa.eu/en/applications/pesticides/tools.
- Guth S, Roth A, Engeli B, Lachenmeier DW, Cartus AT, Hüser S, Baum M, Diel P, Eisenbrand G, Hengstler JG, et al. 2020. Comparison of points of departure between subchronic and chronic toxicity studies on food additives, food contaminants and natural food constituents. Food Chem Tox. 146:111784.
- Jackson S, Hendley P, Jones R, Poletika M, Russell M. 2005. Comparison of regulatory method estimated drinking water exposure concentrations with monitoring results from surface drinking water supplies. J Agric Food Chem. 53(22):8840–8847.
- Kroes R, Renwick AG, Cheeseman M, Kleiner J, Mangelsdorf I, Piersma A, Schilter B, Schlatter J, van Schothorst F, Vos JH, et al. 2004. Structure-based thresholds of toxicological concern (TTC): guidance for application to substances present at low levels in the diet. Food Chem Toxicol. 42(1):65–83.
- Moxon M, Strupp C, Aggarwal M, Odum J, Lewis R, Zedet S, Mehta J. 2020. An analysis of the setting of the acute reference dose (ARfD) for pesticides in Europe. Regul Toxicol Pharmacol. 113:104638.
- Parsons P. 2012. Safety evaluation of new pesticide active ingredients: enquiry-led approach to data generation. In: Jeschke P, Krämer W, Schirmer U, Witschel M, editors. Modern methods in crop protection research. 2nd ed. Wiley-VCH; pp. 351–379.
- Pastoor TP, Bachman AN, Bell DR, Cohen SM, Dellarco M, Dewhurst IC, Doe JE, Doerrer NG, Embry M, Hines RN, et al. 2014. A 21st century roadmap for human health risk assessment. Crit Rev Toxicol. 44(Suppl 3):1–5.
- U.S. Environmental Protection Agency (EPA). 2001. Standard Values for Daily Acres Treated in Agriculture. ExpoSAC Policy 9.1 Health Effects Division, Office of Pesticide Programs, Washington, DC. September 25.
- U.S. Environmental Protection Agency (EPA). 2012. Standard Operating Procedures for Residential Pesticide Exposure Assessment. Health Effects Division, Office of Pesticide Programs, Washington, DC. October.
- U.S. Environmental Protection Agency (EPA). 2021a. Occupational Pesticide Handler Unit Exposure Surrogate Reference Table. Health Effects Division, Office of Pesticide Programs, Washington, DC. May.
- U.S. Environmental Protection Agency (EPA). 2021b. About Water Exposure Models Used in Pesticide Assessments. https://www.epa.gov/pesticide-science-and-assessing-pesticide-risks/about-water-exposure-models-used-pesticide#water_models.
- Wheeler AR. 2019. Directive to Prioritize Efforts to Reduce Animal Testing. US EPA Memorandum, September 10th 2019. https://www.epa.gov/environmental-topics/administrator-memo-prioritizing-efforts-reduce-animal-testing-september-20-2019.
- Wolf DC, Aggarwal M, Battalora M, Blacker A, Catalano SI, Cazarin K, Lautenschalaeger D, Pais MC, Rodríguez M, Rupprecht K, et al. 2020. Implementing a globally harmonized risk assessment-based approach for regulatory decision-making of crop protection products. Pest Manag Sci. 76(10):3311–3315.
- Yoshida M, Suzuki D, Matsumoto K, Shirota M, Inoue K, Takahashi M, Morita T, Ono A. 2013. Simulation of acute reference dose (ARfD) settings for pesticides in Japan. J Toxicol Sci. 38(2):205–214.