ABSTRACT
Based on a new deep drilling on southern Gotland (Sweden), this study is the first to document the carbon isotope chemostratigraphy of the Upper Ordovician through lowermost Silurian sedimentary record from the central parts of the Baltic Sea subsurface. The lithological record of the Stora Sutarve core has similarities with adjacent successions in both the Viki core in the East Baltic area and the Borenshult core in the Swedish mainland. The core includes the Kahula (including 13 bentonites in the “Kinnekulle K-bentonite complex”), Hirmuse(?), Rägavere, Paekna, Jonstorp, Loka, Motala and Kallholn formations. Several of the internationally recognized upper Ordovician δ13C excursions have been identified in the core, including the Guttenberg Isotope Carbon Excursion (GICE), Moe excursion, Hirnantian Isotope Carbon Excursion (HICE), and an undefined early Silurian carbon isotope excursion, presumably the Early Aeronian Carbon Isotope Excursion (EACIE). We particularly address the microstratigraphy of the Hirnantian Stage and the finer details of the HICE, which is not fully complete and entirely confined to the 2.09-m-thick Loka Formation. This formation yields abundant, but low-richness brachiopod faunas characteristic of the Hirnantian Stage and is, based on erosional-depositional surfaces and facies, interpreted as reflecting interglacial warming and eustatic transgression related to ice-sheet contraction in Gondwana. Based on very dense carbon isotope sampling we identify four clusters of δ13C values that aid to define significant changes in the preserved record of the HICE and which may facilitate global correlation of the succession and the herein interpreted sea-level record.
Introduction
The Late Ordovician–Early Silurian time interval brackets one of the largest mass extinction intervals known from the fossil record (Rasmussen et al. Citation2023, with references therein). The extinctions peaked during an ice age that occurred during the terminal Ordovician Hirnantian Stage, which thus, in turn, has been suggested as a causal determinant behind the extinctions (Harper et al. Citation2014). Extensive evidence in the sedimentological and geochemical record is believed to reflect major eustatic sea-level change and a markedly decreased stability of the global carbon cycle. The latter is evidenced by a series of carbon isotope excursions (Bergström et al. Citation2009, Citation2020a; Ghienne et al. Citation2014). The associated changes in eustatic sea-level leave an incomplete stratigraphic record, particularly during the Hirnantian, which marked the time of greatest ice extent. To enable a better understanding of this fascinating interval, the current study provides data from an area on Baltica that hitherto not has been studied. The aim with the present study is, therefore, to make a stratigraphic assessment of the Upper Ordovician to lowermost Silurian succession of the Stora Sutarve deep drillcore from southernmost Gotland (). This is the first carbon isotope chemostratigraphy of this interval from the Gotland area, including an especially detailed account of the microfacies and carbon isotope chemostratigraphy of the Hirnantian Stage. Comparison is made to the Borenshult core on the Swedish mainland and to the Viki core from the Estonian island Saaremaa. The study also includes an interpretation of relative sea-level changes during the Hirnantian Stage with comparisons to the Oslo area (Calner et al. Citation2021), the sea-level model of Kiipli & Kiipli (Citation2020), and the Late Ordovician Glacial Cycles of Ghienne et al. (Citation2014).
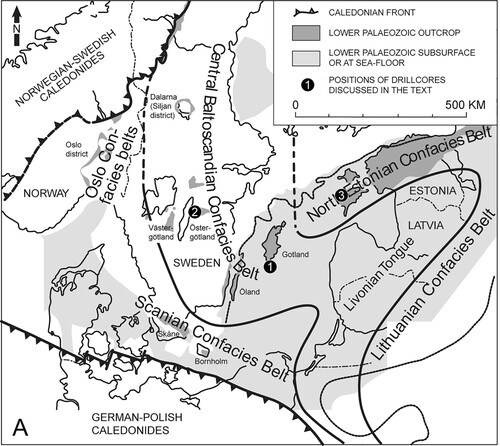
Figure 1. Map of the Baltoscandian basin, showing the geographical distribution of confacies belts and the locations of the cores discussed herein; (1) Stora Sutarve core, (2) Borenshult core and (3) Viki core.
The Hirnantian Stage in Baltoscandia
The Baltoscandian Basin was an epicontinental sea that covered most of the Baltic Shield in the Ordovician. The regional changes in sedimentary facies of the Ordovician segment of the basin fill formed the basis for the establishment of broad facies belts () that reflect bathymetry and depositional depths of the basin – the so-called “confacies belts” of Jaanusson (Jaanusson Citation1973; see also Harris et al. Citation2004). Furthest to the west, in the shield areas affected by isostatic subsidence due to the Caledonian Orogeny, is the confacies belt with the deepest shale facies including the Oslo and the Scanian confacies belts. The Central Baltoscandian Confacies Belt, which covers large parts of Sweden and extends into the Livonian Tongue, is dominated by marl and argillaceous limestone facies. Further to the east is the limestone-dominated North Estonian Confacies Belt (Jaanusson Citation1973; Harris et al. Citation2004). The boundaries of the confacies belt are spatially fluid across time (Jaanusson Citation1995) and Gotland is in a “transitional zone” (Harris et al. Citation2004).
The preserved sedimentary record of the Hirnantian Stage in southern Sweden is generally only a few metres thick and is represented by different rock types and formations in different geographical areas (). In the Skåne province the Hirnantian Stage includes mainly mudrock and shale belonging to the Lindegård Mudstone and Kallholn Formation (Bergström et al. Citation2014). In the Siljan region, the Hirnantian Stage is represented by parts of the carbonate mud mounds of the Boda Limestone and the overlying Glisstjärn Formation, or the Loka Formation outside the areas with mound facies (Schmitz & Bergström Citation2007; Ebbestad et al. Citation2014). At the Råssnäsudden outcrop, near the city of Motala in the Östergötland province, the Hirnantian Stage is confined within the Loka Formation, which was established and originally defined in this area by Bergström and Bergström (Citation1996). This name has replaced the previous formation names Tommarp Formation (Jaanusson Citation1982) and Dalmanitina Beds. At Råssnäsudden, the Loka Formation constitutes a lower unit of mudrock, a middle unit of oolitic limestone and an upper unit of mudrock (Bergström & Bergström Citation1996). The corresponding succession can be studied in the now well-studied Borenshult drillcore, which was drilled in the city of Motala, near the outcrop where the Loka Formation was established (Bergström et al. Citation2011). In the Borenshult core, the total Hirnantian succession is 3.86 m thick, and the lower member of the Loka Formation is missing (Bergström et al. Citation2011). Here the formation starts with a quartz-rich oolitic and laminated grainstone (Skultorp Member), overlain by an informal “upper member” of calcareous mudstone, and the upper and lower boundaries of the formation are developed as unconformities (Bergström et al. Citation2011). The Skultorp Member is a distinct limestone unit that was originally studied and described from Mösseberg in Västergötland by Stridsberg (Citation1980) and which includes low latitude, warm-water carbonate elements such as corals and ooids. The highest δ13C values of the HICE, reaching peak values between +3‰ and +4‰, is associated with this Skultorp Member in southern Sweden (Bergström et al. Citation2012b, and herein).
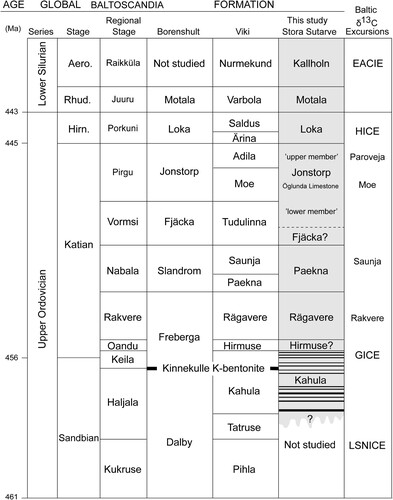
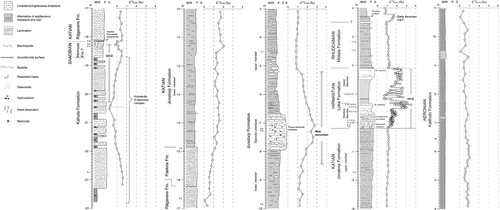
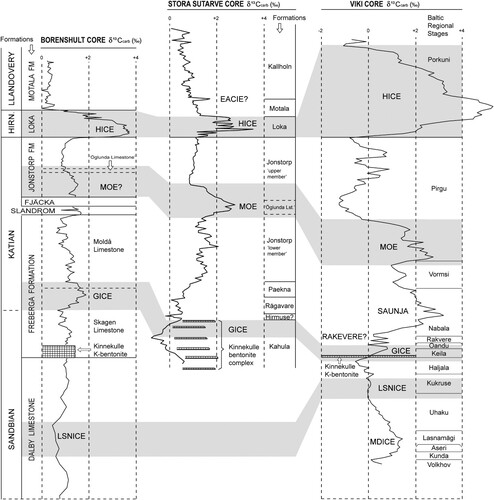
Figure 2. Proposed Upper Ordovician and lowermost Silurian stratigraphy of the Stora Sutarve core with correlation to previously drilled cores in the Swedish mainland (Borenshult core) and Estonia (Viki core). The stratigraphy of the Borenshult core is based on Bergström et al. (Citation2011, Citation2012b) whereas data from the Viki core are from Põldvere (Citation2010). Horizontal black lines in the Kahula Formation of the Stora Sutarve core indicates a series of 13 bentonites documented in this study. Any correlation with the widespread Kinnekulle K-bentonite requires further study. The approximate stratigraphic positions of Baltic δ13C excursions are based on Ainsaar et al. (Citation2010) and Bauert et al. (Citation2014).
Coquinas of both Hindella and Brevilamnulella have been identified within the Boda Limestone at several localities around Lake Siljan in central Sweden (Suzuki et al. Citation2009; Rasmussen et al. Citation2010; Ebbestad et al. Citation2014; Kröger et al. Citation2015). The Hindella coquinas generally occur in the Hirnantian close to the peak of the HICE whereas the Brevilamnulella coquinas occur closely below the unconformity at the upper boundary of the formation (Suzuki et al. Citation2009; Ebbestad et al. Citation2014; Kröger et al. Citation2015). Similarly in Norway, abundant coquinas of Brevilamnulella kjerulfi were identified in the upper part of the Langøye Formation of Hirnantian age (Brenchley & Cocks Citation1982; see Calner et al. Citation2021 for a recent study of these strata).
The Hirnantian Stage in the East Baltic area (here named the Porkuni regional stage) varies in thickness from a few metres to ca 20 m. The stage constitutes the Kuldiga and Saldus formations in the Livonian Tongue (an easterly extension of the Central Baltoscandian Confacies Belt) and the Ärina Formation in the North Estonian Confacies Belt (Jaanusson, Citation1995; Harris et al. Citation2004). In the Viki core from the Estonian island Saaremaa, the Hirnantian Stage is 3.4 m thick and constitutes the Ärina and Saldus formations (Põldvere, Citation2010). The drill site is positioned in the marginal area of the North Estonian Confacies Belt (Jaanusson Citation1995; Põldvere Citation2010). The Ärina Formation is here developed as an argillaceous limestone (Põldvere Citation2010). The lower Piltene member of the Saldus Formation is an oolitic limestone whereas the upper Broceni member is a quartz-rich, laminated and finely crystalline limestone (Põldvere Citation2010). The δ13C values of the HICE in the Viki core show a rapid rise from baseline values around −1‰ in the Adila Formation to +2‰ in the Ärina Formation and reach its peak at +5.2‰ in the oolitic Piltene Member of the overlying Saldus Formation (Hints et al. Citation2014). The δ13C values then display a rapid drop to a plateau of +3‰ in the Broceni Member of the Saldus Formation, followed by a drop to baseline values between −1‰ and 0‰ (Hints et al. Citation2014).
The prominent jumps in the δ13C record, normally cutting parts of the rising and falling limbs of the δ13C anomaly imply stratigraphic hiatuses in the Hirnantian Stage (Brenchley et al. Citation2003). These two gaps are inferably related to erosion and/or non-deposition when sea-level fell due to ice-sheet advances associated with the Hirnantian Stage (Sutcliffe et al. Citation2000; Brenchley et al. Citation2003). The two hiatuses occur at several localities in Europe, North America and China and was referred to as HA and HB, respectively, by Bergström (Citation2006). Interglacial warm water limestone facies sometimes occur between the two hiatuses, such as the oolitic and coral bearing Skultorp Member of the Loka Formation (Stridsberg Citation1975; Bergström et al. Citation2012b).
In contrast to this normally quoted model, a series of no less than four regressions and three transgressions have been identified in the Porkuni regional stage, which corresponds to the Hirnantian Stage, in the East Baltic area of the Baltoscandian Basin (Kiipli & Kiipli Citation2020). The cycles have successively higher amplitude regressions and weaker transgressions, and they are thus higher-order cycles superimposed on a longer-term regression. This pattern may be due to a step-wisely growing ice-sheet in Gondwana (Kiipli & Kiipli Citation2020). The Porkuni regional stage has its lower boundary corresponding to the lower boundary of the S. taugourdeuai chitinozoan biozone (Kiipli & Kiipli Citation2020) and the same biozone is confined within the longer-term Late Ordovician Glacial Cycle 3 (LOGC-3) of Ghienne et al. (Citation2014). Four sea-level cycles were also inferred in the Oslo-Asker district of the Baltoscandian Basin (Calner et al. Citation2021). Based on the dating of the Hirnantian Stage to 0.47 +/− 0.34 Ma (Ling et al. Citation2019), the four cycles in the latter area were interpreted as fourth-order cyclicity (eccentricity) of ca 100 ka superimposed on the LOGC-2 (younger parts) and LOGC-3 cycles (Calner et al. Citation2021).
Materials and methods
The Stora Sutarve drillcore was drilled near Hamra (drill site at coordinates Sweref 99 N 6320673 E 699981; ) on southernmost Gotland by the Geological Survey of Sweden in 2018. Coring was stopped at −564.95 m in the Cambrian (Miaolingian) Faludden Sandstone and the core thus includes the entire Ordovician and most of the Silurian succession of the Baltoscandian Basin.
For the present study 34.5 m of the core, from core boxes no. 81–86, were studied (see metric details and core photographs in Appendix 1). This interval of the core was documented in terms of general lithology and stratigraphic changes. More than 40 pieces of the core, ranging from 10 to 35 cm in length, were cut and polished. From these slabs, a total of 22 thin sections were produced at the Flügel Lab in Erlangen. Polished slabs and thin sections were studied in a light microscope and a polarizing light microscope respectively, for overall analysis of microfacies textures. A total of 391 whole-rock carbon isotope samples were collected from the core using a handheld micro-drill. Sample distance was normally ca 10 cm, except for the Hirnantian Loka Formation where sampling was much denser to compare the isotope signal of various carbonate microfacies and make a high-resolution assessment of the HICE. The exact position of these samples and their relation to microfacies is illustrated in Appendix 2. A few samples were deliberately collected from the cement of spar-filled bioclasts and lithoclasts to evaluate the offset in δ13C (these data are not included in the isotope curve). Details and metric data for all carbon isotope data are provided in . A cross plot of the δ13C and δ18O values show low covariation (R2 = 0.3614; ). Carbonate powders were reacted with 100% phosphoric acid at 70°C using a Kiel IV carbonate device connected to a MAT 253 mass spectrometer. The CO2 generated was used for analysing the carbon, calibrated by the Chinese national standard (GBW-04405) with a δ13C value of 0.57 ± 0.03‰ (VPDB) during the analysis. The analytical precision is better than ±0.04‰ for δ13C. All the isotope analyses were carried out in the Stable Isotope Lab at the Nanjing Institute of Geology and Palaeontology, Chinese Academy of Sciences, China.
Figure 3. Cross plot of stable isotope data included in this study (see ). Relatively low covariation of δ13C and δ18O values suggest the data represent the original sea-water signal and is not strongly flawed by diagenesis.
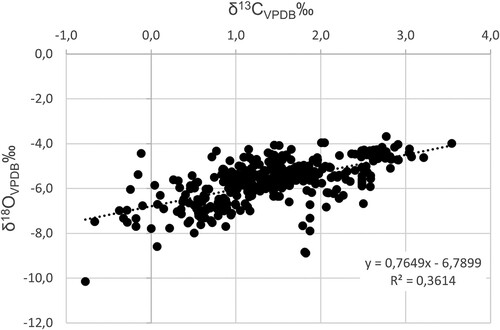
Table 1. Summary of all δ13C and δ18O data from the Stora Sutarve core, with information on sample-id, sample depth in metres below or above the base of our subunit B in the Loka Formation (the 0-level), and stratigraphic unit.
The Borenshult core, including thin sections of all the lithological units (Bergström et al. Citation2011, Citation2012b), was available in the core lab for direct comparison.
Stratigraphy and sedimentology of the studied section
The studied part of the core section constitutes mainly argillaceous, bioclastic limestone with subordinate mudstone and clean limestone (). A prominent feature is a series of 13 bentonites in the lower part of the studied interval. Based on the herein established carbon isotope stratigraphy and lithological comparison with the Borenshult (Bergström et al. Citation2011, Citation2012b) and Viki (Põldvere Citation2010) cores, the bentonites are provisionally grouped as the “Kinnekulle K-bentonite complex” and the studied interval is subdivided into eight formations (), representing the uppermost Sandbian through lowermost Silurian. Due to overall lithological similarities with the Viki core, Estonian formation names have been preferred for the lower parts of the studied section. In the upper part, beginning from the Jonstorp Formation, Swedish formation names have been used. This is elaborated in the respective formation description. For this reason, below, we refer to the classic East Baltic regional stage system (Männil, Citation1966) followed by the new Scandinavian regional stage terminology of Nielsen et al. (Citation2023).
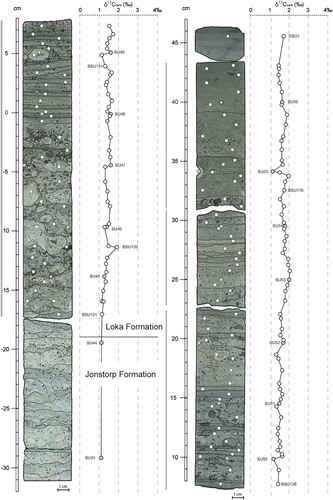
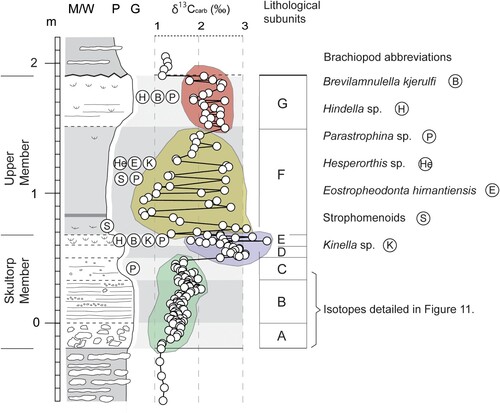
Figure 4. Log profile showing sedimentary facies, stratigraphic nomenclature and carbon isotope stratigraphy (δ13Ccarb) of the Upper Ordovician through lowermost Silurian of the Stora Sutarve core. The identified carbon isotope excursions include GICE = Guttenberg Isotope Carbon Excursion, Moe excursion, HICE = Hirnantian Isotope Carbon Excursion and an early Silurian isotope excursion provisionally interpreted as the Early Aeronian Carbon Isotope Excursion. The stratigraphical positions of the Hirnantian Brevilamnulella coquinas are indicated. Abbreviations: M/W = mudstone/wackestone, P = packstone, G = grainstone. T = thin section samples and P = polished slab samples illustrated herein.
Kahula Formation
The Kahula Formation (A) of the Haljala and Keila (middle-upper Dalbyan) regional stages ranges from −23.78 to −18.72 m (thus at least 4.51 m thick), in the studied core material. It is a greyish crinoid packstone–grainstone with subordinate, wavy sub-centimetre thick beds of marl. Skeletal fragments are mainly derived from crinoids, trilobites and bryozoans whereas brachiopods and ostracods are subordinate. The formation includes 13 bentonites, in ascending order at; −23.78 m with a thickness of 47 cm; −21.88 m with a thickness of 9 cm; −21.70 m with a thickness of 17 cm; −21.45 m with a thickness of 6 cm; −21.19 m with a thickness of 3 cm; −20.88 m with a thickness of 23 cm; −20.47 m with a thickness of 5 cm; −20.26 m with a thickness of 7 cm; −20.11 m with a thickness of 7 cm; −19.88 m with a thickness of 1 cm; −19.1 m with a thickness of 4 cm; −19.0 m with a thickness of 9 cm and at −18.81 m with a thickness of 7 cm. Microstylolites, small pyrite grains, blackened grains and fractures filled with black calcite occurs sparsely. There is a possible conglomerate bed between −22.12 and −22.02 m. The conglomerate clasts are a grainstone, with similar skeletal fragments as within the enclosing formation. The conglomerate matrix is a mix of clay/marl, bioclasts and smaller reworked clasts. A cavity filled with hydrocarbons and large calcite crystals occurs at −21.49 m. Connected to the cavity are sub-millimetre thick fractures filled with black calcite. The lithology changes gradually upwards into a wackestone/packstone, with a pure carbonate matrix without detrital clay weathering products. One centimetre below the uppermost bentonite bed, at −18.81 m, is a mineralized hardground. The upper boundary of the formation is provisionally set at the top of the thirteenth and uppermost bentonite. This section of the core has been designated to the Kahula Formation due to overall lithological similarities to the Kahula Formation of the Viki core, which also includes multiple bentonite beds and a level with a conglomerate (Põldvere Citation2010, p. 9). The lithology is different from the greenish limestone with wavy marl beds in the Dalby and Freberga formations of the Borenshult core. No whole cystoids, which is characteristic of the Dalby Formation in the Borenshult core (Bergström et al. Citation2011), occur in the studied interval of the Stora Sutarve core.
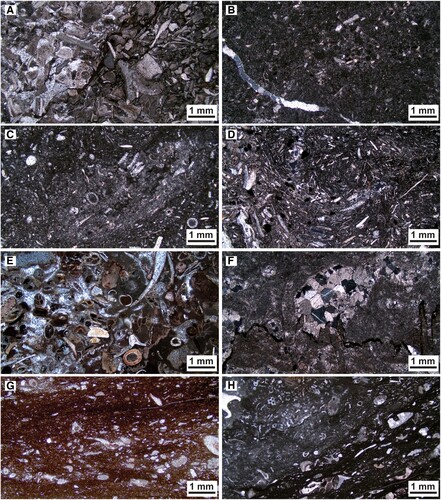
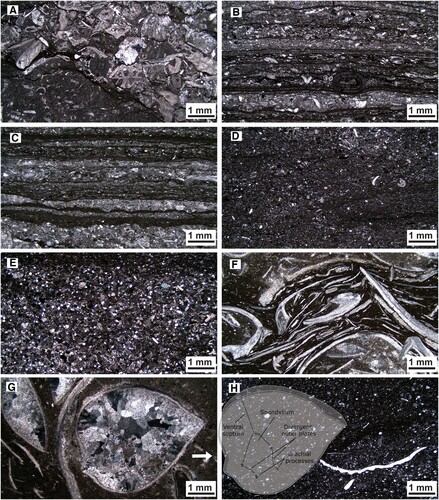
Figure 5. Thin sections of the Upper Ordovician formations of the Stora Sutarve core. For the stratigraphic position of the thin sections, see left margin of profiles in . A. Grainstone-packstone of the Kahula Formation with mainly crinoid fragments (T-1 in ). B. Fine-grained bioclastic wackestone of the Hirmuse Formation (T-2). C. Packstone of the Rägavere Formation with calcareous algae and crinoid fragments (T-3). D. Strongly bioturbated packstone of the Paekna Formation with glauconite grains (black spheres) (T-4). E. Crinoidal grainstone-packstone interval of the informal “lower member” of the Jonstorp Formation (T-5). F. The Öglunda Limestone of the Jonstorp Formation with recrystallized calcareous algae (T-6). G. Reddish dense wackestone to packstone microfacies of the informal “upper member” of the Jonstorp Formation with mainly crinoid fragments (T-7). H. Greenish bioclastic wackestone–packstone of the “upper member” of the Jonstorp Formation with crinoid fragments and calcareous algae (T-8).
Hirmuse Formation
The base of the Hirmuse Formation (B and A) of the Oandu (lowermost Moldåan) regional stage is set immediately above the uppermost bed of the bentonite complex and ranges from −18.72 to −18.18 m (0.54 m thick). It is a light grey, dense wackestone; in places light greenish or bluish. Much of the matrix is exceptionally fine-grained and interpreted as induced from microbial activity. Skeletal fragments are mainly derived from crinoids, bryozoans, ostracods, trilobites and brachiopods, whereas gastropods are subordinate. Bioturbation is sparse and includes burrows of the genus Planolites. Fractures ranging from millimetres to 1 cm in width and several centimetres long are common. The fractures are filled with large blocky calcite crystals that are sometimes dark in colour due to inclusions of hydrocarbons. Pyrite is abundant and ranges in size from minute grains to mottles of several millimetres. The upper boundary of the formation is set at the first of a series of stacked mineralized hardgrounds (B). The formation shows sign of possible freshwater diagenesis in the form of vertical fissures filled with coarse calcite spar. This lithology has provisionally been designated as the Hirmuse Formation as it is transitional between the inferred Kahula and Rägavere formations. There is no lithology in the Borenshult core that is similar to that of the Hirmuse Formation of the Stora Sutarve core.
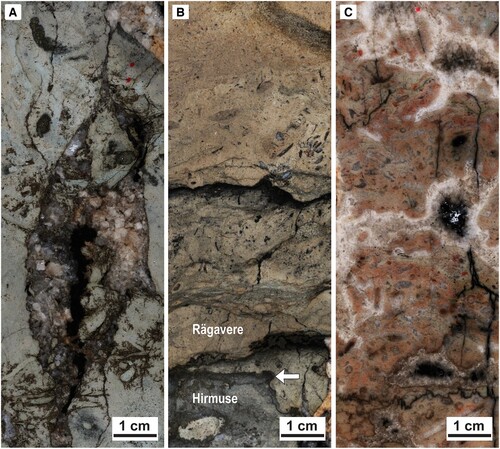
Figure 6. Polished slabs of selected intervals from the core. For the stratigraphic position of the sample, see . A. The Hirmuse Formation (P-1) showing vertical fissure with large blocky calcite crystals, blackened by hydrocarbons. B. The Hirmuse-Rägavere boundary (arrow; P-2), and stacked mineralized (blackened) corrosive hardgrounds in the basal part of the Rägavere Formation. C. The Öglunda Limestone (P-3), showing a porous biohermal limestone (boundstone, with some hydrocarbons), mainly built up by recrystallized in situ calcareous algae of the genus Dasyporella.
Rägavere Formation
The Rägavere Formation (C) of the Rakvere (middle Moldåan) regional stage is separated from the underlying Hirmuse Formation by a phosphatized hardground (B) and ranges from −18.18 to −16.32 m (1.86 m thick). It is a light brownish grey packstone. Skeletal fragments are mainly derived from crinoids, trilobites, bryozoans, calcareous algae and ostracods whereas gastropods are subordinate. The calcareous algae belong to the genus Vermiporella and occur throughout the formation but are especially abundant between −17.80 and −17.70 m. Sparse glauconite grains occur. Fractures of submillimetre-size are filled with calcite, which at some places is black in colour. At the base of the formation are stacked, amalgamated, phosphatized and partly pyritized hardgrounds which indicates episodic non-deposition. The upper boundary of the formation is set at a sharp change in the lithology, interpreted as an unconformity. At this unconformity is a centimetre-sized coral preserved. This unit has been designated as corresponding to the Rägavere Formation, based on the abundant presence of calcareous algae as well as on the lithological similarity with Võhma core from Estonia (Kröger et al. Citation2019; fig. 3b). The same similarities are seen in the Viki core (Põldvere Citation2010; fig T-38 in appendix 3). No similar lithology occurs in the Borenshult core, where no calcareous algae have been identified.
Paekna Formation
The Paekna Formation (D) of the Nabala (upper Moldåan) regional stage is separated from the underlying Rägavere Formation by an unconformity. The formation ranges from −16.32 to −14.81 m in the core (1.51 m thick). It is a light grey packstone with submillimetre to millimetre thick wavy and horizontal beds of marl. Glauconite grains are very abundant throughout and distinctive for the formation. Skeletal fragments are mainly derived from crinoids, trilobites, brachiopods, bryozoans and ostracods. Stylolites and microstylolites are sparse. The upper boundary of the formation is not sharp, but transitional and marked by a rapid increase in marl/clay content and a synchronous rapid decrease in glauconite. This interval in the Stora Sutarve core shows a lithology similar to the Paekna Formation of the Viki core (Põldvere Citation2010; fig. D-61 in appendix 2), especially in the high abundance of glauconite grains. There is no lithology in the Borenshult core that is similar to the Paekna Formation of the Stora Sutarve core.
It is notable that the Slandrom Formation, known from both, the Borenshult core (Bergström et al. Citation2011) and the Viki core (as the Saunja Formation (Põldvere Citation2010)), is missing in the Stora Sutarve core. This formation belongs to the upper part of the Nabala regional stage and is normally easily identified due to its very fine-grained microcrystalline (aphanitic) texture (Calner et al. Citation2010). No sign of an unconformity or hiatus is present between the Paekna Formation and the overlying Jonstorp Formation.
Fjäcka shale
Across south and south-central Sweden, a black shale known as the Fjäcka shale occurs at this stratigraphic level (Calner et al. Citation2010; Bergström et al. Citation2011, Citation2016; Ebbestad et al. Citation2014). The Stora Sutarve core does not have this, typically black Fjäcka shale, although a possible lateral mudrock equivalent occurs at this level in the core, see below. This may suggest that parts of the Vormsi (topmost Moldåan) regional stage is missing in the core.
Jonstorp Formation
The strata herein designated to the Jonstorp Formation of the Pirgu (Jerrestadian) regional stage have a tripartite subdivision in the informal “lower member” and “upper member” separated by the more calcareous Öglunda Limestone. This is similar to the stratigraphy in the Borenshult core, although with different thicknesses (cf. Bergström et al. Citation2011). Above Paekna, follows the lower member, which ranges from −14.81 to −7.95 m in the core (6.86 m thick). In the basal portions of the Jonstorp Formation an argillaceous wackestone rich in crinoid debris (which is typical for the lower member of the Jonstorp Formation) is interbedded with a dark mudrock that inferably corresponds to and is a less distinct lateral facies expression of the Fjäcka Shale. This interfingering of two lithofacies extends for 2.31 m. From −12.5 m the lower Jonstorp lithology continues without the interbedded mudrock. The colour is mainly red but alternates to greyish green in some intervals. At −11.6 m, the lithology gradually changes to a marly crinoid packstone-wackestone. In some intervals from −9.6 m and above, the lithology changes to a crinoid packstone with inclusions of grainstone (E). These intervals have rather atypical lithofacies for the Jonstorp Formation. Skeletal fragments are mainly derived from crinoids whereas bryozoans, trilobites, brachiopods, ostracods and gastropods are subordinate. At the upper boundary of the lower member is a rapid decrease in clay along with the appearance of calcareous algae. There is no lower member equivalent in the Viki core as the Pirgu Stage starts with the Moe Formation (Põldvere, Citation2010, p. 10). The lower member of the Jonstorp Formation in the Borenshult core is similar to this lithology apart from the atypical intervals of crinoid packstone with grainstone inclusions. The lower member of Borenshult is greenish while Stora Sutarves’ lower member is mainly red.
The lower member of the Jonstorp Formation is overlain by the Öglunda Limestone (F and C), which ranges between −7.95 and −6.7 m (1.25 m thick). This unit is a light grey and pinkish porous biohermal limestone (boundstone) with a wackestone matrix. The lithology is mostly built up of micro and millimetre-sized, recrystallized in situ calcareous algae of the genus Dasyporella. Centimetre-sized porosity occurs as several cavities filled with large calcite crystals and kerogen ranging mainly from about −7.74 to −7.0 m. There are also many vertical fractures filled with calcite and hydrocarbons. Skeletal fragments apart from the calcareous algae are subordinate and are mainly derived from trilobites and crinoids. Solution seams and stylolites occur abundantly throughout this unit. The upper boundary towards the upper member of the Jonstorp Formation is gradual, with an increase of micrite/clay and a decrease in the abundance of calcareous algae. This unit is lithologically similar to the Moe Formation of the Viki core (Põldvere Citation2010; fig. D-53, D-54 and D-55 in appendix 2) and to the descriptions of the Moe Formation in Hints et al. (Citation2005, pp. 232–234). The Öglunda Limestone has a similarly porous lithology as in the Borenshult core but with the addition of calcareous algae and hydrocarbons.
Strata referred to the upper informal member of the Jonstorp Formation ranges between −6.7 and −0.19 m in the core (6.51 m thick). These constitute wavy beds of marl between nodules of limestone that is a crinoid packstone-wackestone and that varies between red (G) and greenish-grey (H) in colour. The skeletal fragments are mainly derived from crinoids, trilobites, bryozoans, brachiopods, calcareous algae and ostracods with subordinate gastropods. There are a few calcareous algae in the lowermost 0.25 m of the unit. The upper boundary marked by a rapid change to a reworked conglomeratic lithology of the lowermost Loka Formation. The Jonstorp Formation of Borenshult is similar to this lithology, except that the upper member is entirely red in that core whereas, the upper member in the Stora Sutarve core varies between greenish and red.
Loka Formation
The Jonstorp Formation is overlain by the Loka Formation of the Porkuni (lower Tommarpian) regional stage. This formation is key to understand the environmental changes during the Hirnantian Global Stage and is therefore described in deeper detail herein. The unit ranges from −0.19 to 1.9 m (2.09 m thick) in the core ( and ) and can broadly be subdivided into a lower limestone unit and an upper, more argillaceous unit, the latter becoming successively more calcareous up-section. The lower limestone unit is overall a partly laminated, oolitic and lithoclastic limestone, very similar to the Skultorp Member of the Loka Formation in Västergötland (Stridsberg Citation1980) and Östergötland (Bergström et al. Citation2011, p. 161), and to the Saldus Formation in the Viki core.
Figure 7. Polished slabs showing the carbonate microfacies of the Loka Formation. For stratigraphic position of the polished slab, see . A. Section ranging from −0.17 to 0.02 m (subunit A, P-4) showing abundant, light bluish-grey reworked clasts that in thin section display a microfacies dominated by calcareous algae and that is identical to the upper portions of the underlying Jonstorp Formation. The matrix between the clasts is a bioclastic packstone (lower part) or bioclastic grainstone with rare ooids (upper part). B. Section ranging from 0.02 to 0.08 m (subunit B, P-5) showing thin but conspicuous grainstone-packstone sets separated by thin lamina of organic-rich mudstone. C. Section ranging from 0.31 to 0.355 m (subunits B-C, P-6) showing the boundary of subunit B to the overlying wackestone with streaks of organic-rich mud of subunit C. D. Section ranging from 0.52 to 0.59 m (subunit D, P-7) showing a well-sorted, quartz-rich packstone, almost approaching a calcareous siltstone, with streaks of organic-rich mud. E. Section ranging from 0.595 to 0.675 m (subunit E, P-8) showing a distinct brachiopod coquina. The more calcareous middle part contains several whole, articulated and spar-filled brachiopods. The more mud-rich lower and upper parts contain brachiopod fragment with a preferred horizontal orientation. F. Section ranging from 0.955 to 1.065 m (subunit F, P-9) showing a fine-grained wackestone with a more strongly calcareous matrix.
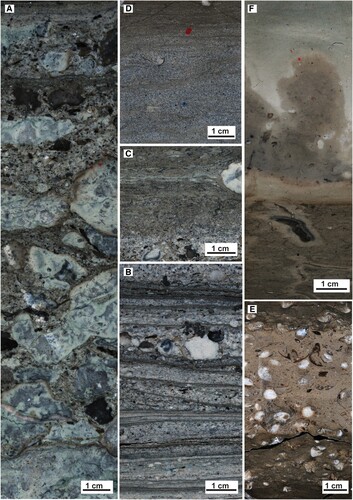
Figure 8. Thin sections of the Loka Formation in the Stora Sutarve core. For stratigraphic position of the thin section, see . A. From ca −0.13 m (subunit A, T-9). Reworked clasts (lower left) with similar calcareous algae wackestone microfacies as in the upper Jonstorp Formation in a grainstone-packstone matrix with mainly crinoid and bryozoan fragments. B. From ca 0 m (subunit B, T-10). Laminated grainstone-packstone sets separated by thin lamina of organic-rich mudstone. Mainly crinoid fragments are seen in the grainstone-packstone sets of this thin section. A concentrically laminated ooid with a crinoid bioclast as core is seen in the lower middle part of the photograph. C. From ca 0.08 m (subunit B, T-11). Detail of laminated grainstone-packstone sets separated by organic-rich mud. Mainly crinoid fragments are seen in the grainstone-packstone sets of this thin section. D. From ca 0.40 m (subunit C, T-12). Fine-grained bioclastic wackestone–packstone with crinoid and bryozoan fragments. E. From ca 0.58 m (subunit D, T-13), a well-sorted quartz-rich packstone, almost approaching a calcareous siltstone. Apart from quartz grains, crinoid fragments are also seen in this thin section. F. From ca 0.67 m (subunit E, T-14), brachiopod fragments with preferred orientation from the brachiopod coquina. G. From ca 0.65 m (subunit E, T-15), whole articulated and spar-filled brachiopods from the brachiopod coquina. The larger brachiopod is identified as B. kjerulfi. The inserted sketch shows the outline of specimen in G and the main morphological characters used for determination. H. From ca 1.05 m (subunit F, T-16), fine-grained bioclastic wackestone with a strophomenoid brachiopod.
Lithological subunits and carbonate microfacies of the Loka Formation
Based on lithological variation the Loka Formation can be divided into seven lithological subunits, herein named A to G in ascending order. An individual subunit may constitute more than one carbonate microfacies.
The lowermost subunit A ranges from −0.19 to 0 m (A and A). The unit has a conglomeratic texture with slightly rounded clasts that are ca 0.5–2 cm in diameter. The lithoclasts are light grey and have a similar microfacies as the upper Jonstorp Formation, containing the same distinct calcareous algae. This implies that the Jonstorp–Loka contact is not fully conformable although no distinct erosional surface is obvious from the core section and the stable carbon isotope stratigraphy across the boundary does not support any substantial hiatus. A few of the “Jonstorp lithoclasts” are dark through mineralization. In the lowermost part between −0.19 and −0.16 m, the matrix between the clasts is composed of the typical greenish Jonstorp marl. From −0.16 to 0 m the matrix changes to a packstone–grainstone microfacies typical of the overlying subunit B. This packstone–grainstone matrix includes rare ooids. The ooids are dark in colour and occur with radial symmetry, concentric symmetry and radial-concentric symmetry. Most have a spherical shape, but a few are elongated, and some are fragmented. The majority of ooids have a crinoid bioclast as nucleus. Skeletal fragments are mainly derived from crinoids whereas bryozoans, trilobites, brachiopods, ostracods and calcitarchs are subordinate.
Subunit B ranges from 0 to 0.32 m (B and B–C) and overall appears coarsely and conspicuously laminated for this reason the base of this subunit was assigned as reference level (0) for metric measurements of this study. It is composed of a few millimetres thick sets of packstone–grainstone, each separated by thin but distinct laminae of silt-sized quartz and organic-rich mudstone with scattered bioclasts or microscopic bioclastic lenses. “Jonstorp lithoclasts” are present also in this subunit but show an upward decrease in both size and numbers. Ooids still occur in this subunit. Skeletal fragments are mainly derived from crinoids whereas bryozoans, trilobites, brachiopods, ostracods and calcitarchs are subordinate.
Subunit C ranges from 0.33 to 0.505 m (C and D). It is a wackestone–packstone. The lamination is much less distinct and is replaced by streaks of clay. At 0.38 m is the last identifiable lithoclast of upper Jonstorp origin. Skeletal fragments are much fewer in abundance. Rare ooids still occurs in this subunit. Quartz grains are sparse. Skeletal fragments are mainly derived from crinoids whereas bryozoans, trilobites, brachiopods, calcitarchs and ostracods are subordinate. From 0.38 m and upward the skeletal fragments are much fewer in numbers.
Subunit D differs from C by an increased content of quartz grains and skeletal fragments, and it ranges from 0.505 to 0.60 m (D and E). It is a well-sorted quartz-rich packstone with streaks of organic-rich clay, almost approaching a calcareous siltstone. Rare ooids still occur. Skeletal fragments are mainly derived from crinoids whereas brachiopods, bryozoans, calcitarchs and trilobites are subordinate.
Subunit E ranges from 0.60 to 0.68 m and is a brachiopod coquina packstone (E and F–G). The coquina is made up of whole, articulated brachiopods and brachiopod skeletal fragments. The matrix is darker and inferably organic-rich mud in the lowermost 2 cm and in the top 1.5 cm, whereas the middle part is more calcareous. The lower and upper parts contain disarticulated brachiopod shells orientated with their long axis parallel to the bedding whereas the middle part constitutes articulated spar-filled brachiopods without preferred sorting or orientation. Quartz grains are abundant in the top 2 cm but occur sparsely throughout the coquina.
Subunit F is separated from E by a rapid change to more clay-rich facies and it ranges from 0.68 to ∼1.52 m (F and H). It is a brownish grey wackestone with sparse quartz grains. The most condensed dark mudrock of the entire Loka Formation is situated between 0.81 and 0.82 m. Above there is a gradual upward increase in carbonate content. Skeletal fragments are few in numbers and are derived from brachiopods, crinoids, bryozoans, trilobites and gastropods (Hormotoma).
Subunit G is separated from F by a gradual change to packstone and the unit ranges from ∼1.52 to 1.90 m. It is a grey packstone–grainstone with wavy interbedding of greenish marl. A second brachiopod coquina appears between 1.75 and 1.82 m. Skeletal fragments are mainly derived from crinoids, trilobites, brachiopods, bivalves and ostracods with subordinate gastropods and rugose corals. The upper boundary of subunit G is a conspicuous, erosional unconformity, with ca 1 dm of relief, and corresponds to the top of the Loka Formation.
Based on the above, the more calcareous subunits A–E are herein assigned as the Skultorp Member whereas the more argillaceous subunits F–G are assigned as the Upper Member of the Loka Formation.
Brachiopod fauna of the Loka Formation
The stratigraphical position of the identified brachiopods are shown in . It should be noted that all occurrences are determined based on polished core surfaces or thin sections with limited morphological characteristics available (e.g., example in G). Consequently, most determinations are kept at the generic level under open nomenclature. In the wackestone, above the laminated packstone-grainstone sets, in the upper part of subunit C, Parastrophina sp. is identified at 0.43 m. In subunit E, Brevilamnulella kjerulfi (G) and Hindella sp. have both been identified in the brachiopod coquina along with Kinnella sp. and Parastrophina sp. In subunit F, representing a more fine-grained, clay-rich facies, several strophomenoids have been identified between 0.68 and 0.80 m and around 1.26 m. Around 1.30 m Parastrophina sp., Hesperorthis? sp., Kinnella? sp. and Eostropheodonta? hirnantiensis occur. In subunit G, Hindella sp., B. kjerulfi and Parastrophina sp. occur up to the unconformity and with greater abundance within the brachiopod coquina between 1.75 and 1.82 m. Out of the identified brachiopods, Hindella, Kinella and Eostropheodonta belong to the preferentially cold–temperate water Hirnantia fauna whereas Brevilamnulella, Parastrophina and Hesperorthis belong to the equatorial warm-water Edgewood-Cathay fauna. If the subdivision of transitional benthic faunas (TBF; see Discussion) is applied Kinella is associated with TBF-1, Hindella, Parastrophina and Eostropheodonta are associated with TBF-2 and Brevilamnulella, and Hesperorthis are associated with TBF-3 (Wang et al., Citation2019).
Motala Formation
The strata above the upper unconformable boundary of the Loka Formation are herein provisionally assigned to the Motala Formation of Silurian (Rhuddanian) Age (). The formation ranges from 1.90 to 3.71 m (1.81 m thick). It is a grey marly wackestone with nodular interbeds of reddish packstone. Skeletal fragments are mainly derived from crinoids, ostracods, brachiopods, trilobites whereas gastropods are subordinate. The lithology is similar to that of the informal middle member of the Motala Formation in the Borenshult core, which is a greenish grey wackestone with nodules of reddish wackestone (Bergström et al. Citation2011). Thus, the Stora Sutarve core is missing the informal lower and upper members of this formation as seen in the Borenshult core. In the Viki core, the Varbola Formation of the Juuru regional stage, above the Porkuni regional stage, display less similarities as it is described as a cryptocrystalline limestone with patches and interbeds with marlstone and argillaceous limestone. It contains glauconite and pyritized discontinuity surfaces (Põldvere Citation2010). The upper boundary of the Motala Formation is associated with a sharp change to a black siliciclastic mudstone at 3.71 m in the core. This distinct boundary is interpreted as a flooding surface.
Figure 9. Thin sections of the Silurian Motala Formation. The stratigraphic position of the thin section is shown in . A. Crinoidal packstone from ca 2.54 m (T-17) including a large brachiopod fragment. B. Bioclastic wackestone from ca 2.83 m (T-18) mainly including crinoid and bryozoan fragments.
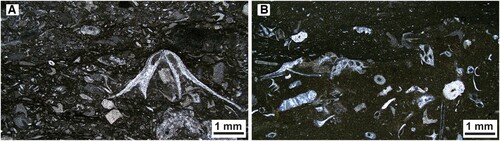
Figure 10. (Colour version online) Detailed lithological stratigraphy (subunits A–G) of the Loka Formation and its relationship to a high-resolution record of the HICE and the stratigraphic positions of the herein identified brachiopods. Four clusters of δ13C values, with four different positions above the baseline and with different trends, respectively, are marked in colours. In green is a cluster of δ13C values with a stable and slowly increasing trend, forming the initial rising limb of HICE. The top of this cluster is defined by an offset in the δ13C values by more than one permil over less than one centimetre of stratigraphy, suggesting a period of non-deposition or erosion. The blue cluster includes substantially higher δ13C values than the green cluster and the two peak δ13C values of the HICE. The yellow-greenish cluster corresponds to an interval with strongly fluctuating δ13C values in the plateau interval. This interval is richer in clay minerals and organic material, which probably account for the scatter of data. Note the upwards decreasing range of scatter, which align with successively increased CaCO3-content in the same direction. Red denotes an interval in the plateau where carbonate content is distinctly higher and data scatter decreases. Note the one permil negative jump in the δ13C values above the red cluster, back to baseline values, and that a clear falling limb is missing, suggesting that the M. persculptus graptolite Zone (H2 time slice) is cut out at the unconformity on top of the Loka Formation in Stora Sutarve core.
Kallholn Formation
The black mudstone above the Motala Formation is herein provisionally referred to as the Kallholn Formation (Bergström et al. Citation2012a). It is separated from the underlying Motala Formation by a sharp boundary and ranges from 3.71 to at least 11.09 m (minimum 7.38 m thick), which is at the upper end of the studied core material. The formation constitutes a dark mudstone with centimetre-sized mottles of pyrite, sometimes with sub-centimetre close to euhedral pyrite crystals. Macrofossils are dominated by graptolites and bivalves. Throughout the mudstone are a few, 5–20 cm thick interbeds of bioturbated grey wackestone with a higher calcareous content in the matrix. Skeletal fragments in the wackestone intervals are mainly derived from brachiopods, crinoids and trilobites. The Viki core does not have a mudrock interval above the Hirnantian. The Borenshult core ends before any appearance of mudrock.
Upper Ordovician carbon isotope chemostratigraphy
The Upper Ordovician succession hosts seven pronounced anomalies in the δ13C record of marine carbonates (Bergström et al. Citation2020a). These anomalies are mostly well constrained by biostratigraphy and identified in several remote locations. They can thus be interpreted as reflecting offsets or disruptions to the global carbon cycle and related to changes in the ocean-atmosphere system and climate. The best documented and most widely recognized of these are the early Katian Guttenberg Isotope Carbon Excursion (GICE) and the Hirnantian Isotope Carbon Excursion (HICE). In the Baltoscandian basin these two anomalies are separated by the Rakvere, Saunja, Moe and Paroveja carbon isotope excursions (Ainsaar et al. Citation2010; ). Over the last decade work has been undertaken to study how these smaller excursions relate to especially the North American isotope stratigraphy and Rakvere is now correlated with the Kope excursion, Saunja with the Waynesville excursion, Moe with the Whitewater excursion, and Paroveja with the Elkhorn excursion (Bergström et al. Citation2020a; Goldman et al. Citation2020). In the Baltoscandian Basin, the Lower Sandbian Negative Isotope Carbon Excursion (LSNICE) has also been identified (Bauert et al. Citation2014).
The HICE is the most profound of all Ordovician anomalies in terms of offset from baseline values and is known from many tens of localities globally (e.g., Ripperdan et al. Citation1998; Finney et al. Citation1999; Brenchley et al. Citation2003; Chen et al. Citation2006; Fan et al. Citation2009; Ainsaar et al. Citation2010; Achab et al. Citation2011; Jones et al. Citation2011; Bergström et al. Citation2012b, Citation2014; Ebbestad et al. Citation2014; Calner et al. Citation2021). From a morphological point of view, the ideal tripartite signature of the HICE (and any δ13C anomaly given a steady continuous sedimentation rate) consists of a rising limb, a peak interval (sometimes extended as a plateau) and a falling limb, as first discussed based on East Baltic core sections by Brenchley et al. (Citation2003). The rising limb and plateau belong in the N. extraordinarius Zone and the H1 time slice, whereas the falling limb belongs in the N. persculptus Zone and H2 time slice. The anomaly therefore represents an exceptional geochemical marker for correlations of even thin packages of sedimentary strata between regions and continents. A more recent stratigraphic problem, however, both for placing the base of the Hirnantian Stage correct and to exactly pin-point the onset of the HICE, is the current international discrepancy in the usage of chitinozoan biostratigraphy; the base of the Hirnantian corresponds to the first appearance datum (FAD) of the chitinozoan Spinachitina taugourdeaui in Northern Europe (Kiipli & Kiipli Citation2020), whereas the base of the stage is defined by the FAD of Belonechitina gamachiana in North America (Amberg et al. Citation2016; Kiipli & Kiipli Citation2020, p. 2; see also Calner et al. Citation2021 for a discussion based on the Oslo-Asker district succession). The problem arises as the FAD of S. taugourdeaui is regarded as coeval to the FAD of N. extraordinarius in Europe but to the FAD of N. persculptus in Anticosti.
Pre-HICE in the Stora Sutarve core
Within the Kahula Formation (−23.23 to −18.72 m) 21 δ13C samples were analysed (). From −22.92 m with a value of 0.62‰, the δ13C values decline slowly to a minimum of −0.78‰ at −20.50 m. A slow increase commences and the uppermost sampling point in the formation, just before the uppermost bentonite bed, shows a δ13C value of 0.32‰ at −18.88 m. Within the Hirmuse Formation (−18.72 to −18.18 m), six δ13C samples were analysed. Up to −18.48 m (0.51‰) the values continue the increasing trend from the Kahula Formation. A stepwise negative shift follows, with a drop to minimum −0.17‰ at −18.26 m. Within the Rägavere Formation (−18.18 to −16.32 m), 10 δ13C samples were analysed. Values increase to and stabilize at a baseline of around ∼0.30‰. At −16.72 m one value shows a negative shift to 0.07‰ directly followed by an increase to 0.65‰. Within the Paekna Formation (−16.32 to −14.81 m), eight δ13C samples were analysed. Values increase from 0.57‰ at −16.30 m to 1.14‰ at −14.90 m at the top of the formation. Within the Jonstorp Formation (−14.81 to −7.95 m), 78 δ13C samples were analysed, out of which 34 samples were from the lower member. Values are seen to fluctuate at a new increased baseline around 1.20–1.50‰. A temporary increase in one value to 2.07‰ is seen at −11.31 m followed by slightly higher baseline values that increase again just below the Öglunda Limestone. From the Öglunda Limestone, seven of the 78 Jonstorp Formation samples were analysed. The slightly higher and increasing baseline continues to increase rapidly in the Öglunda Limestone and an excursion is evident. This excursion reaches a maximum of 2.77‰ at −7.09 m. From the upper member, 37 of the 78 Jonstorp Formation δ13C samples were analysed. A decrease from the excursion in the Öglunda Limestone continues from a value of 2.19‰ at −6.5 m and stabilizes at 0.91‰ at −5.1 m. A baseline around ∼1.00‰ continues throughout the member to the upper boundary of the Jonstorp Formation.
The HICE interval in the Stora Sutarve core
A total of 189 δ13C samples were analysed from the 2.09-m-thick Loka Formation (−0.19 to 1.9 m in the core; and ). The exact sampling points, and thereby the relationship between the highly resolved isotope stratigraphy and the variation in carbonate microfacies, are shown in the scanned core section in Appendix 2. The five topmost δ13C values of the Jonstorp Formation have a mean of 1.16‰, forming the pre-HICE δ13C baseline. Within the HICE-interval, four clusters of δ13C values can be discerned and these help to define significant and likely statistically solid changes in the HICE trend (). The clusters have been defined qualitatively based on their increasing or decreasing trends in δ13C values or because of exceptional scattering of data.
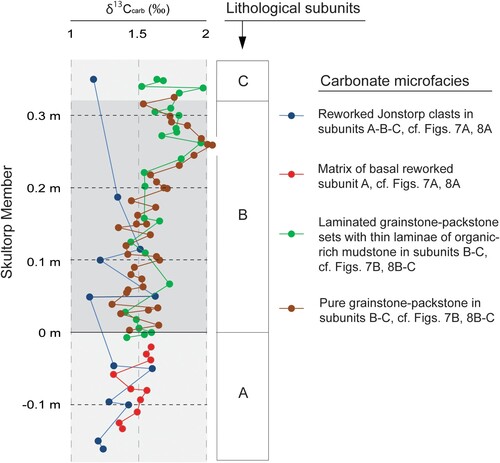
Figure 11. (Colour version online) High-resolution expression of the carbon isotope data during the first 0.5 m of the HICE, corresponding to the initial part of the rising limb. Note the slightly lower δ13C values of the reworked clasts (in blue) that on lithological basis derives from the upper Jonstorp Formation.
The initial rising limb forms a cluster, coloured green in . This rising limb is overall steady but shows small variations and two diffuse “intra-rise-peaks”, the first in the lower part of subunit B and the second in the uppermost part of subunit B and transitioning into the basal subunit C. The second “intra-rise-peak” is most pronounced between ca 0.22 and 0.27 m, where there is a more rapid rise up to a series of five values near 2.00‰ (highest at) 2.04‰. This second “intra-rise-peak” is followed by a weak negative trend that ends around 0.43 m in subunit C. The decreasing trend is followed abruptly by a significant jump in δ13C, of ca 1‰. This jump starts from 1.65‰ at 0.48 m and occurs over only 2 cm of stratigraphy between 0.48 and 0.5 m. It marks the transition to a second cluster, coloured blue in . This cluster shows much more scattering of δ13C data. It has an average δ13C value of 2.67‰ and includes the peak δ13C values of the HICE in the core. Although the core is broken into smaller pieces in this interval there is no obvious change in facies, or any clear indication of core loss associated with the jump from the first to the second cluster. The second cluster straddles the topmost subunit C, subunit D and subunit E (the coquina). Subunit E shows relatively large fluctuation in the δ13C values. It is likely that some of the fluctuation in subunit E is caused by un-noticed spar-filled whole fossils of a finer size fraction and thus difficult to avoid when sampling. The maximum δ13C value of 3.54‰, at 0.63 m, in subunit E (the coquina) marks the peak value in the Loka Formation and of the HICE in the Stora Sutarve core. Subunit F differs from all other subunits in having the most pronounced fluctuation in δ13C values. It has an average δ13C value of 1.85‰ with a minimum value of 0.72‰ at 0.855 m and a maximum value of 3.07‰ at 0.725 m. In subunit G, the fluctuation of δ13C values has stabilized. It has an average value of ∼2.30‰ with a minimum value of 1.87‰ at 1.73 m and a maximum value of 2.58‰ at 1.71 m. The three uppermost samples, just below the top-Loka unconformity are taken at 1.84, 1.845 and 1.87 m and have δ13C values of 2.53‰, 2.49‰ and 2.31‰, respectively. At the unconformity, sample DSU31 is taken roughly 3 mm above the unconformity and has a value of 1.79‰. Sample SU-71 is taken roughly 0.5 cm above the unconformity and has a value of 2.31‰. Sample DSU-32 is taken roughly one cm above the unconformity and has a value of 1.17‰, which is at the baseline of the Motala Formation. Hence, there is an offset of more than 1.00‰ between samples separated by only 0.5 cm, adding evidence for a hiatus associated with the unconformity at the top of the Loka Formation.
The initial rise of the HICE has been studied in particular detail to understand how δ13C values correspond to different microfacies, and to evaluate if the microfacies, which may represent different environments and/or processes, have any potential impact on these values. The δ13C values in the lowermost part of the Loka Formation (−0.16 to 0.34 m) represent sampling from four different carbonate microfacies. The microfacies constitutes: (1) lithoclasts with similar wackestone–packstone microfacies as in the upper Jonstorp Formation, that is, reworked strata (lithoclasts are distributed within subunits A–C); (2) packstone–grainstone matrix in the basal reworked facies (subunit A); (3) pure packstone–grainstone sets of the laminated facies (subunit B) and (4) laminated packstone–grainstone sets, separated by laminae mixed with quartz-rich organic mudstone (subunit B). The δ13C-records of the four microfacies are plotted together in . It is expected that the lithoclasts with a similar microfacies as the upper Jonstorp Formation generally have lower values than the other three microfacies, as the latter formed later, when HICE developed. As the δ13C values of these three microfacies steadily increase, initiating the rising limb of the HICE in the basal Loka Formation, the samples from clasts, as predicted, behave steadier and appear to display an increasing offset to the rising limb up-section, adding evidence for a reworked origin from older strata. The packstone–grainstone matrix in subunit A shows an increasing trend that upwards is sustained by the two microfacies of the laminated facies. The graph also shows that the values between individual depositional sets in the laminated subunit B are changing, not always increasing upwards from one set to the next although with a general trend of increasing upwards. This also means that the many thin depositional sets in subunit B did not form due to flow-regime changes during one single depositional event, but that the sets were deposited one-by-one, separated by some significant amount of time. A few values within each plot change close to the uncertainty of the method, although the trends remain.
Post-HICE in the Stora Sutarve core
Within the Motala Formation (1.90 to 3.71 m), 28 δ13C samples were analysed (). Directly following the unconformity at the base of this formation the values return to a baseline of ∼1.20‰. From 3.55 m, the values start to increase and at 3.7 m values reach 1.71‰ just below the flooding surface that marks the transition into the Silurian. Within the Silurian mudstone (3.7 to 11.09 m), 51 δ13C samples were analysed. At 3.76 m, above the basal flooding surface the value is 1.76‰ followed by an immediate drop to 0.79‰ at 3.8 m. The values continue to slowly decrease from ∼0.90‰ to ∼0.40‰ and the last and uppermost value of 0.37‰ is recorded at 10.9 m.
Discussion
Stratigraphy and sedimentology
Among the most significant stratigraphic markers, of the studied core interval, are the 13 bentonite beds in the Kahula Formation (). These are most likely including the Kinnekulle K-bentonite (sensu e.g., Bergström et al. Citation2011, Citation2012b) of Upper Sandbian age although it cannot be properly identified in the core without further study. Above the uppermost bentonite bed, is the Hirmuse Formation, which includes fissures filled with coarse spar, herein interpreted as freshwater diagenesis due to exposure of the succession. Based on the position above the bentonites and our isotope stratigraphy the Hirmuse Formation corresponds roughly to the middle Freberga Formation of the Borenshult core, which includes a conglomeratic level separating the local Skagen and Moldå limestones (Bergström et al. Citation2011, p. 159). It is likely that the sea-level lowstand producing that conglomerate caused the observed freshwater diagenesis in the Hirmuse Formation. The Hirmuse Formation is also characterized by Planolites trace fossils and a series of stacked mineralized hardgrounds (B). The Rägavere Formation above is characterized by abundant calcareous algae of the genus Vermiporella. The overlying Paekna Formation is characterized by a high abundance of detrital glauconite. The Slandrom Formation and its Estonian counterpart Saunja Formation, which are widespread at this stratigraphic level (e.g., Calner et al. Citation2010), are notably missing in the Stora Sutarve core where their typical, fine-grained (aphanitic) facies have not been encountered. Commonly, the black, organic-rich (oil shale) Fjäcka Shale follows above the Slandrom Formation. No black shale is, however, found in the Stora Sutarve core at this stratigraphic level. Instead, the glauconite-rich Paekna Formation is followed immediately by the Jonstorp Formation. As been noted above, however, the lowermost portion of the lower member of the Jonstorp Formation interfingers with a dark-coloured mudstone, which is here provisionally interpreted as a Fjäcka Shale equivalent. The lower Jonstorp member is overlain by the conspicuous Öglunda Limestone (F and C). This is a porous biohermal limestone (boundstone) with abundant calcareous algae of the genus Dasyporella. Hydrocarbons are present in the pore spaces. The upper Jonstorp member shows a typical, reddish, crinoidal wackestone–packstone facies as seen in most of south-central Sweden. The Loka Formation of Hirnantian age is overall very similar to the Loka Formation in the Borenshult core in Östergötland (Bergström et al. Citation2011). The reworked clasts, of similar microfacies as the upper member of the Jonstorp Formation, in its basal parts implies some erosion and redeposition at this level, but it should be noted that our isotope stratigraphy, in spite of very dense sampling, does not show any marked offset in δ13C that would imply a more substantial hiatus. The Loka Formation continues with conspicuously laminated limestone (A and B–C). The lower Skultorp Member includes a distinct brachiopod coquina (E and F–G) near the top. The overlying upper member is clay-rich and includes a darker mudstone interval. The carbonate content increases upwards in the upper member and the formation ends in an unconformity at the upper boundary which inferably marks the Silurian boundary. Above the Loka Formation is the Motala Formation, which ends in a flooding surface. A mudstone belonging to the Kallholn Formation follows on top of the Motala Formation and continuous to the end of the studied core.
Carbon isotope stratigraphy
The δ13C isotope excursions identified in the studied section include the GICE, the Moe excursion, the HICE and an excursion associated with the flooding surface at the inferred Ordovician–Silurian boundary (). Approximately between −21.90 and −19.32 m, in between the bentonite beds in the Sandbian Kahula Formation, is a pronounced negative excursion with a minimum value of −0.76‰ at −20.50 m. This anomaly may be of stratigraphic importance, as LSNICE has been identified between bentonite beds at the Sandbian GSSP in the Fågelsång valley east of Lund (Bergström et al. Citation2020b). However, LSNICE is typically associated with the upper Kukruse regional stage in the East Baltic area (the “upper Kukruse low” of Kaljo et al. Citation2007), and with the boundary between Baltoscandian Chemostratigraphical zones BC4 and BC5 (Ainsaar et al. Citation2010). This corresponds to a level below the Kinnekulle Bentonite (within BC5; Ainsaar et al. Citation2010, p. 195) and just below the Baltoniodus gerdae conodont subzone, in both that area and in the Borenshult drillcore (see discussion in Bauert et al. Citation2014, p. 196 and their reference to Bergström et al. Citation2012b, fig. 5). Hence, the negative excursion in the Stora Sutarve core may better represent a slightly younger anomaly, possibly an isotopic low that occurs within the Haljala regional stage and isotopic zone BC5 (see Ainsaar et al. Citation2010, fig. 3). Additional biostratigraphic data and, preferably, additional sampling below this interval in the Stora Sutarve core, is however, needed to affirm this. The trend of increasing δ13C values above the negative excursion, from −19.52 m, has been designated the GICE. The rising limb of this excursion occurs within the uppermost metre of the Kahula Formation, which includes three bentonite beds. It continues into the Hirmuse Formation where a distinct decrease from 0.51‰ to −0.17‰ in the δ13C values is interpreted as a truncation and erosion of strata, although it is not by any means obvious in the lithology. The GICE thus occurs among the top three bentonite beds in the Kinnekulle bentonite complex, similar to what has been reported elsewhere in the Baltoscandian basin (Ainsaar et al. Citation2010; Bergström et al. Citation2012b; Bauert et al. Citation2014; Hints et al. Citation2014). The Rakvere excursion is associated with the Rägavere Formation (Rakvere regional stage) but no isotope excursion is identified in the Rägavere Formation of the Stora Sutarve core. The Rägavere and Paekna formations are separated by an unconformity, but this is not noticeable in the δ13C values, although the Rägavere excursion could be in the missing strata of the hiatus. δ13C values of the Paekna Formation (Nabala regional stage) show an increase to a higher baseline of values. This increase might be part of a broader trend and is not pronounced enough to confidently be assigned to the Saunja excursion, which is associated with the Nabala regional stage. In the lower member of the Jonstorp Formation, there is an increase in δ13C values from 1.28‰ to 2.07‰ between −11.54 and −11.31 m, which might be because the high δ13C value is derived from a more calcareous nodule. The subsequent δ13C values continue at a slightly higher baseline around ∼1.70‰, but nothing notable occurs in the lithology that is associated with the increase or the increased baseline. Similarly, an increase of δ13C values is documented in the lower member of that formation in the Borenshult core (Bergström et al. Citation2012b), although much less pronounced. The middle member of the Jonstorp Formation, the distinct Öglunda Limestone includes a pronounced positive δ13C excursion. This excursion is designated as the Moe excursion based on its stratigraphic position. It starts slightly below the Öglunda Limestone, separating the lower and upper members of the Jonstorp Formation, and the falling limb of the excursion continues upwards in the upper member. It should be noted here that the Öglunda Limestone is a “facies-anomaly” and a good marker bed also in the southern Sweden mainland and it is likely to represent a brief environmental change of at least large regional or even global importance within the overall stable deposition during Late Katian Jonstorp time. The succeeding higher parts of the upper member of the Jonstorp Formation show the least fluctuating values of this study. In the East Baltic area, the Paroveja excursion has been identified within this stratigraphic interval (Ainsaar et al. Citation2010) but this excursion is not identified in the Stora Sutarve core, surprisingly, as the upper Jonstorp Formation appears to be a conformable succession without facies change or evidence of erosion, except at the upper boundary towards the Loka Formation. This erosion, however, is interpreted as limited due to the lack of offset in the carbon isotope data.
In the Loka Formation, the HICE has been identified ( and ). The unconformable lower contact is not obvious in the HICE as the δ13C values steadily increase across the boundary between the Jonstorp and the Loka formations. A significant jump, however, to the highest δ13C values is seen within subunit C, slightly below the quartz-rich subunit D. A cluster of high values, including the peak value of 3.54‰ within the coquina, continues to the end of subunit E. The fluctuation of δ13C values seen in the clay-rich subunit F is interpreted as diagenetic effects. Lithologies rich in clay mineral or organic-rich mud may during diagenesis have released carbon of low δ13C, which would have decreased the δ13C in the carbonate rock. As the carbonate increases upwards, the δ13C values stabilize in a funnelling pattern. The stabilized values continue in subunit G and a plateau can be interpreted from subunit E to G if the diagenetic fluctuation is disregarded. The HICE ends with a truncation corresponding to the unconformity seen in the core and the falling limb is missing. The high sample density not only made the general trends of the HICE clearer but also the diagenetic fluctuation as seen in subunit F. A tripartite morphology can be discerned if the inferred diagenetic fluctuation in subunit F is disregarded. The rising limb is confined to subunits A–C. The plateau continues from subunit D–G, with a peak in subunit E, whereas the falling limb is not preserved as the HICE is truncated at the unconformity. The falling limb of HICE is normally correlated with the M. persculptus graptolite Zone and stage slice H2 of Bergström et al. (Citation2009). It can therefore be concluded that this latest Hirnantian interval is missing in the Stora Sutarve core.
In the Motala Formation immediately above the top unconformity of the Loka Formation the δ13C values return to baseline (). Slightly below a flooding surface, which inferably marks the boundary to the Kallholn Formation, another excursion occurs (). This excursion is truncated back to baseline values slightly above the flooding surface. This excursion could correspond to the Early Aeronian CIE (Melchin & Holmden Citation2006). Biostratigraphic data, however, are necessary to assert this. The excursions of the Stora Sutarve core are presented in along with comparison to the Borenshult core (Bergström et al. Citation2012b) and the Viki core (Bauert et al. Citation2014).
Figure 12. Provisional basin-regional correlation of Upper Ordovician δ13C stratigraphy based on the Stora Sutarve, Borenshult and Viki cores (see locations in ). Data from the Borenshult core come from Bergström et al. (Citation2012b), whereas data from the Viki core derives from Hints et al. (Citation2014).
Brachiopod fauna
A key feature of the Hirnantian Stage is the Hirnantia brachiopod Fauna. This is a characteristic marker for the Hirnantian Stage as it not only survived the first extinction step but adapted and expanded to become abundant in the subsequent cool climate (Wang et al. Citation2019; Rong et al. Citation2020). This fauna was, however, overall short lived and almost extinct during the second extinction step due to anoxia and euxinia associated with the post-glacial warming (Harper et al. Citation2014; Rong et al. Citation2020). Post glaciation, the sea floors were repopulated with fauna thriving in a warming climate, among these the Edgewood-Cathay brachiopod fauna (Rong et al. Citation2020). Thus, these two brachiopod faunas appear consecutively in strata, respectively, after the first and second extinction step, during glaciations and post glaciation (Rong et al. Citation2020). This succession of the two temperature-dependent faunas corroborates previous studies that have shown Baltica to have been an unusual region as it apparently acted as a refuge for many brachiopod taxa during the Hirnantian extinctions (Rong et al., Citation2020; Rasmussen & Harper, Citation2011).
The overall benthic fauna of the Hirnantian has been further subdivided into three “TBF”, with focus on brachiopod assemblages and the presence of corals and sponges (Wang et al. Citation2019). TBF-1 is associated with the majority of species of the cool climate Hirnantia fauna, which was spread from the high-latitude to temperate regions, inhabiting a variety of water depths. TBF-2 is associated with warmer water and is characterized by brachiopods such as Hindella and Dalmanella without key members of the Hirnantian fauna present. Rugose corals are also associated with TBF-2. It is stratigraphically above the TBF-1, in the middle Hirnantian. TBF-2 occurs at most latitudes and is replaced by sponges in deeper offshore waters. TBF-3, which is characterized by elements of the Edgewood-Cathay fauna, replaces and is stratigraphically above TBF-2 later in the Hirnantian. Rugose and tabulate corals are also associated with TBF-3. This fauna is, in similarity with TBF-2, associated with warm water and occurs at most latitude and is replaced by sponges in deeper offshore waters (Wang et al. Citation2019). Based on the absence of cold-water fauna in the late Hirnantian Wang et al. (Citation2019) suggested a major glaciation in the Katian–Hirnantian transition, associated with TBF-1, followed by deglaciation associated with TBF-2 and TBF-3. Within the deglaciation two minor glaciations were inferred.
Elements of both the Hirnantia and the Edgewood-Cathay faunas co-occur in the Loka Formation (). The typical Hirnantia fauna genus, Hindella, for instance, are observed together with Brevilamnulella kjerulfi, which usually are associated with the Edgewood-Cathay fauna in the coquina of subunit E and throughout subunit G, including the second coquina. In comparison, in the Hirnantian Boda Limestone, a Hindella coquina is found associated with the peak of the HICE, whereas a Brevilamnulella coquina is associated with the falling limb of the HICE just below the upper hiatus (Kröger et al. Citation2015, fig. 4). In addition, in the Hirnantian Langøyene Formation in Norway, a Brevilamnulella coquina also occurs just below the upper unconformity of the formation (Brenchley & Cocks Citation1982; see also Calner et al. Citation2021). Notably, the lowermost identified brachiopod in the Stora Sutarve core is Parastrophina of the Edgewood-Cathay fauna. If the subdivision of TBF (Wang et al. Citation2019) is applied, the TBF do not occur consecutively. Kinnella of TBF-1 occurs both in the first coquina and in the upper part of subunit F. Hindella and Parastrophina of TBF-2 occur both in the first coquina and throughout the uppermost subunit G. Brevilamnulella of TBF-3 also occurs in the first coquina and throughout subunit G.
Hirnantian sea-level and the Loka Formation
The glacio-eustasy associated with the Hirnantian Stage has globally left a fragmented sedimentary record that challenge interpretation of the finer details of sea-level cyclicity. The very thin Hirnantian Stage in the studied core and the marked erosional unconformity at the top of the Loka Formation (= upper stage boundary) suggest that non-deposition/by-pass sedimentation and erosion was important also in the southernmost Gotland area, although it represents a distal palaeogeographic setting within the Baltoscandian basin.
The upper Jonstorp Formation (above the Öglunda Limestone) represents a highly stable depositional environment throughout southern Sweden and the carbon isotope trend of this interval is also stable without anomalies (Bergström et al. Citation2011, Citation2012b). The overlying grainstone with ooids and corals, the Loka Formation, therefore marks a highly abrupt change to depositional environment, including substantial shallowing of the depositional environment. A highly important research question to better understand environmental forcing during the end-Ordovician mass extinction is whether the Loka Formation is deposited during falling or rising eustatic sea-level, or during a lowstand of the sea-level, as this also defines how the HICE anomaly (global carbon cycling) relates to eustatic sea-level change: The reworked Jonstorp clasts in subunit A of the Loka Formation imply that the Jonstorp–Loka contact is unconformable and that erosion of already at least semi-lithified Jonstorp facies took place before the deposition of the Loka Formation. Apart from these clasts, and the obvious rapid change from deeper marine facies (Jonstorp) to shallow-marine facies (Loka), there are no evidence of regression, such as a transitional regressive facies sequence. Thus, the basal boundary of the Loka Formation could potentially be interpreted as a “regressive surface of marine erosion”, which is the sharp base of the falling stage systems tract (FSST) in more offshore settings (Catuneanu Citation2006). An important additional observation, however, is that the Jonstorp clasts are common especially in subunits A and B and continue with less abundance up to subunit C. The concentration of clasts at lower levels and its successive decrease up-section through the Loka Formation suggest they were first reworked and then redeposited during a transgression. This means that any strata belonging to the FSST thus are eroded and not preserved in the area of the coring, which then presumably was an area of by-pass sedimentation during the time of falling sea-level. Likewise, strata of the lowstand systems tract must be eroded away and/or be located further palaeo-offshore. The lack of these two systems stands in contrast with the carbon isotope trend across the Jonstorp–Loka boundary interval, which shows no offset. A plausible explanation to this contradiction may be the combination of the distal palaeogeographic position with rapidity of build-up and collapse of ice-sheets in Gondwana and as a result a rapid regressive-transgressive cycle. The basal boundary of the Loka Formation (Skultorp Member) therefore most likely represents both the sequence boundary and the transgressive surface, although formed during a time interval short enough not to result in an offset in δ13C stratigraphy. The studied area was simply not subject to erosion and non-deposition for very long.
The trend with an upwards decreasing number and size of Jonstorp clasts in the Loka Formation is associated with an upwards overall increase in the abundance of clay minerals to reach a maximum abundance of clay in the lower portions of subunit F. Here, a dark clay inferably marks the maximum flooding interval (MFI) of the transgression and the top of the clay thus marks the top of the transgressive systems tract (TST). The TST therefore is represented by subunits A, B, C, D, E and lowermost part of F. Such subdivision of the strata may explain the distinct isotopic offset associated with the subunits C–D transition as related to transgressive erosion and a development of a transgressive ravinement surface. Above the dark clay, subunit F shows a gradually increased content of carbonate upwards. This trend may mirror an increased carbonate production in the area due to progradation of the shoreline and fit with a normal regression associated with the highstand systems tract (HST), i.e., the time interval when the rate of eustatic sea-level rise slows down and is outpaced by sedimentation rate. The transition from subunits F to G is gradual and the facies change represents a shallowing upwards. The marked unconformity at the top subunit G then is interpreted as representing a second glacially induced sea-level drop through ice-expansion in Gondwana. Based on degree of facies change, the undulating character of the unconformity and the offset in δ13C stratigraphy, this sea-level drop was more pronounced than the first one. It is, for example, likely that part of the preceding HST is not fully represented below the unconformity but partly eroded away, and the unconformity is overlain by a thick shale succession. The Loka Formation in the Stora Sutarve core is thus interpreted as one transgression-maximum flooding-regression cycle bounded by two glacially induced hiatuses at the base and top, of which the second hiatus is of greatest magnitude. This interpretation can be contrasted with the recent study of Kiipli & Kiipli (Citation2020; figs 7–9). They identified four regressions (I-IVR) and three transgressions (II-IVT), all within the Hirnantian Stage. Consequently, several of their cycles are either not sufficiently pronounced or not developed in the Stora Sutarve record. Below two scenarios are introduced that may explain this difference.
Scenario 1
One possible indication of an additional period of sea-level lowstand and erosion in the Stora Sutarve record is the more than one per mille offset in the δ13C values associated with the boundary between subunits C and D. This surface is here interpreted as a local ravinement surface. Below and above this offset the δ13C values cluster in widely different ranges () and this offset thus could indicate the presence of an erosional surface, thus a regressive-transgressive cycle (). IIT of Kiipli & Kiipli (Citation2020) could then correlate with subunits A–C of the Skultorp Member. The δ13C offset would then represent a hiatus formed during IIR, possibly including the quartz-rich subunit D. Subsequently IIIT follows in the brachiopod coquina (subunit E) up to the MFI in subunit F. The following highstand in subunit F is assigned to IIIR. The unconformity at the top of subunit G represents IVT and IVR, which are both eroded due to Stora Sutarve subaerial palaeoposition during IVR. This scenario thus includes strata from the earlier cycles in the Stora Sutarve record, which would develop when the regressive coastline stands were less offset from Southern Gotland. Whereas strata deposited during the late IVT could erode to a greater extent as the regressive coastline stand was further out in the basin during IVR. Another interpretation, however, is that the isotopic offset is related to transgressive erosion as discussed above.
Figure 13. Lithology, brachiopod data and the HICE of the Loka Formation in the Stora Sutarve core (see caption to for abbreviations of brachiopods). To the left is the sea-level interpretation proposed herein based on the lithology, stratal surfaces, facies and HICE of the Stora Sutarve core. According to this interpretation, strata formed during forced regression (FSST) due to glacials in Gondwana are not preserved in the section, but lost in hiatuses (by-pass surfaces) at the base and top of the Loka formation. Hence, the FSST deposits are inferred to be situated further palaeo-offshore. To the right are two scenarios where the sea-level interpretation is compared to the Hirnantian Baltic regression-transgression cycles proposed by Kiipli and Kiipli (Citation2020). Furthest to the right is the proposed relation to the lower order LOGC cycles of Ghienne et al. (Citation2014). See the main text for a discussion. FSST = Falling stage systems tract, TST = transgressive systems tract, MFI = maximum flooding interval, HST = Highstand systems tract, SB = Sequence boundary, TS = Transgressive surface, TRS = Transgressive ravinement surface. M/W = mudstone/wackestone, P = packstone, G = grainstone. I-R = the earliest regression in the Hirnantian Baltic regression-transgression cycles proposed by Kiipli and Kiipli (Citation2020), IV-R = the latest regression, II-T = the earliest transgression, IV-T = the latest transgression. LOGC = Late Ordovician Glacial Cycle from Ghienne et al. (Citation2014). ? = the herein interpreted transgressive ravinement surface that in Scenario 1 is interpreted as an erosional surface.
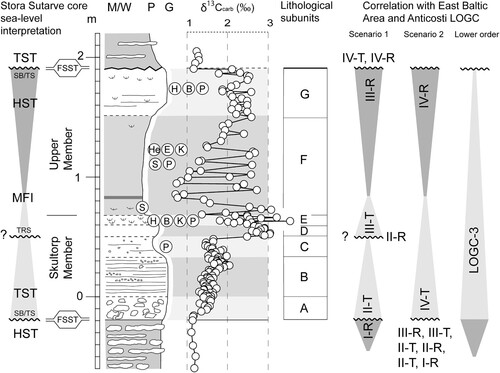
Scenario 2
Another explanation is that the time corresponding to some of the sea-level cycles proposed by Kiipli & Kiipli (Citation2020) is included in the hiatus at the base of the Loka Formation, which requires a different sea-level interpretation, here denoted scenario 2. Harper & Hints (Citation2016) correlated the Loka Formation in the Borenshult core with the Saldus Formation in the East Baltic area. The Skultorp Member of the Loka Formation would then be the equivalent of the Piltene Member of the Saldus Formation, and the upper member of the Loka Formation would correspond to the Broceni Member. Based on the similarities between the Borenshult and Stora Sutarve cores, such correlation can be assumed to apply to the Stora Sutarve core as well. The Piltene Member of the Saldus Formation belongs to the so-called Saldus transgression IVT of Kiipli & Kiipli (Citation2020), which would imply that the Skultorp Member (both in Stora Sutarve core and in the Borenshult core) formed during transgression IVT (). The Broceni Member corresponds to regression IVR (Kiipli & Kiipli, Citation2020) and inferably to the upper member or possibly only the unconformity at the top of the Loka Formation. IIIR and all the previous cycles would in this scenario be represented by the hiatus at the base of the Loka Formation. This could explain the lack of the lowermost member of the Loka Formation known from Västergötland (Stridsberg, Citation1980) and Östergötland (Bergström & Bergström Citation1996; Bergström et al. Citation2011), although a missing lower member is a bit surprising given the seemingly steady δ13C values across this boundary. The scenario fits better with the Borenshult core, which has a distinct unconformity and an associated offset in δ13C values across the base of the Loka Formation. If the regressive coastline position is taken into account, as shown in Kiipli & Kiipli (Citation2020; fig. 8), it would be more logical if the basal Loka Formation was preserved whereas the top would be eroded away, as in scenario 1, as more of the Baltoscandian basin was exposed to land.
Lower order cyclicity
Ghienne et al. (Citation2014) identified three regression-transgression cycles named Late Ordovician Glacial Cycles 1–3 (LOGC 1–3). The first cycle, LOGC-1, occurred in the latest Katian and includes a regression and a transgression due to ice-sheet growth and decline (Ghienne et al., Citation2014). LOGC-2 includes a similar cycle and corresponds to the Belonechitina gamachiana chitinozoan biozone, which Ghienne et al. (Citation2014) include in the Hirnantian Stage. The regression in the last cycle, LOGC-3, represent the most extensive ice-sheet growth, whereas the ensuing transgression reflects the post-glacial sea-level rise, which extended into the Silurian (Ghienne et al., Citation2014). It should be emphasized that this interpretation extends the Hirnantian Stage to include the B. gamachiana chitinozoan biozone (Ghienne et al., Citation2014) in opposition to the interpretation in Baltica where B. gamachiana belongs in the Katian Stage (see Calner et al. Citation2021). The lower order glacial cycles LOGC-1 and LOGC-2 from Anticosti Island (Ghienne et al. Citation2014) are older than cycles identified in the Baltoscandian basin as these include the B. gamachiana chitinozoan Zone (Ghienne et al. Citation2014; Kiipli & Kiipli Citation2020). The Hirnantian in the Baltoscandian basin starts in the slightly younger S. taugourdeuai chitinozoan Zone and matches with LOGC-3 (Kiipli & Kiipli Citation2020). The LOGC-3 also matches with the peak of HICE. The peak of the HICE is associated with the rising sea-level in the deglaciation (Ghienne et al. Citation2014). The HICE of the Stora Sutarve core starts and peaks within a TST and the plateau continues through an interval of normal regression interpreted as a HST (). This would imply that the unconformity at the top of the Loka Formation is not another glacial episode but a regional hiatus due to a regionally confined regression. A major glacial episode should occur earlier in LOGC-3 (Ghienne et al. Citation2014), which could be represented by the conglomeratic and unconformable lower boundary of the Loka Formation in the Stora Sutarve core and the corresponding basal unconformity of the Loka Formation in the Borenshult core.
The rise and peak of the HICE in the Stora Sutarve core is associated with a TST, most likely transgression IVT of Kiipli & Kiipli (Citation2020), and the plateau interval continues in a HST. Ghienne et al. (Citation2014) argue that the peak of HICE always occurs within the TST of LOGC-3 and at higher resolution in a HST, which is associated with the post-glacial warming and deglaciation. If this is the case, the weathering hypothesis of Kump et al. (Citation1999), as cause for the HICE, would be refuted as it requires the peak within a lowstand (Ghienne et al. Citation2014). The record of the Stora Sutarve core is thus not in line with the weathering hypothesis, although it should be emphasized that the Stora Sutarve record is a single core, and that global investigation of multiple cores would be necessary to further a dismissal of the weathering hypothesis.
Regional correlation of the HICE
The Loka Formation in the Borenshult core (Bergström et al. Citation2011, Citation2012b) is lithologically similar to the Stora Sutarve core as they both have oolitic laminated limestone in the lower part (Skultorp Member) and a more argillaceous upper member in which carbonate content increases upwards. In both cores, the formation has unconformable upper and lower boundaries. In the Borenshult core, the boundary between the Skultorp Member and the upper member was interpreted as unconformable and assigned the designation HA (Bergström et al. Citation2012b). In this study, which includes an inspection of the Borenshult core for comparison, an unconformable boundary at this level was not observed neither is it obvious in the δ13C values. Both cores belong in the same Central Baltoscandian Confacies Belt. The most obvious differences between the cores are observed in the rising limb of the respective HICE (). The Stora Sutarve core displays a steady increase whereas the Borenshult core displays a distinct offset associated with the basal unconformity. Furthermore, the Borenshult core displays a more stable peak and plateau than the Stora Sutarve core. Both cores have the most pronounced fluctuation in δ13C values in the upper members. This fluctuation corresponds with facies that are mixtures of terrigenous clay and organic material, which has a lower δ13C signal (Brand & Veizer Citation1981; Schobben et al. Citation2016). To aid the visual comparison of the cores, many of the δ13C values in Stora Sutarve have been excluded in were we only show sample series SU, which was a first general sample series with equal distances between samples ().
Figure 14. (Colour version online) HICE of the Stora Sutarve core compared to the HICE of the Borenshult core in south-central Swedish mainland. Because of the very large amount of data points in the Stora Sutarve core, and to simplify general correlation, we only show isotope sample series SU here (see ). This sample series is taken at regular intervals in a comparable way to the samples from the Borenshult core. The rising limb of the HICE is marked in green, the peak and plateau are marked in blue and the falling limb is marked in red.
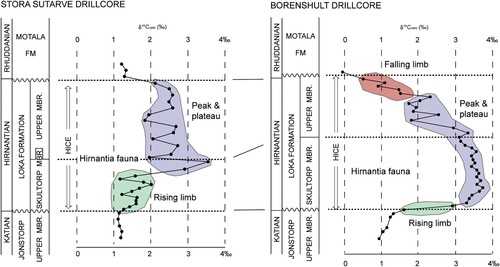
The Hirnantian Stage in the Viki core constitutes the Ärina Formation and the Saldus Formation. The lithology, compared to the Loka Formation of the Stora Sutarve core is generally different as the Viki core drill site is positioned in the margins of another confacies belt (). The peak of HICE is confined to the oolitic Piltene Member in the Viki core (Hints et al. Citation2014). This member was correlated to the Skultorp Member in the Borenshult core by Harper & Hints (Citation2016). Comparably, the peak of HICE occurs in the topmost part of the Skultorp Member in the Stora Sutarve core. A plateau and falling limb occur in the Broceni Member in the Viki core (Hints et al., Citation2014) which was correlated to the upper member in the Borenshult core (Harper & Hints Citation2016). In the Stora Sutarve core, if the fluctuation of δ13C values in the upper member is disregarded, a plateau emerges, which is subsequently truncated before a falling limb can be discerned.
Summary and conclusions
Based on lithological characterization and carbon isotope stratigraphy this study summarizes the Upper Ordovician through lowermost Silurian stratigraphy of the Stora Sutarve core from southern Gotland, and address particular focus on the sedimentology, isotope stratigraphy and brachiopod fauna of the Hirnantian Stage. The following are the key results and conclusions of the study.
The 34.50 m long core section studied herein ranges stratigraphically from the Sandbian Kahula Formation to the Aeronian Kallholn Formation.
A δ13C stratigraphy, based on 391 whole-rock carbon isotope sample, has been established for the studied interval. Several of the globally known Upper Ordovician δ13C excursions have been identified for the first time in the Gotland area, including GICE, Moe excursion, HICE and possibly the EAICE in the early Aeronian.
A high-resolution δ13C record (189 samples from the 2.09-m-thick Loka Formation) provides the first detailed assessment on the degree of stratigraphic completeness of the Hirnantian Stage in the central Baltic Sea subsurface, an area between the Scandinavian peninsula and East Baltic area with few cores available to research. The HICE record includes a rising limb, a peak and a plateau interval. Two separate offsets in the isotope curve imply two levels of erosion. The first, most likely of only local importance, occurs within the rising limb. The second is associated with an unconformity at the top of the Loka Formation where the entire or most of the falling limb of the HICE is cut out.
As the falling limb of HICE is cut out, the M. persculptus graptolite Zone and stage slice H2 are missing in the Stora Sutarve core.
Brachiopods of the Hirnantia and the Edgewood-Cathay faunas have been identified within the Loka Formation. The specific genera of the two faunas co-occur and do not appear consecutively as would be expected.
Changes in sea-level have been interpreted and compared to previously published sea-level data from the East Baltic area and from Anticosti Island. The Loka Formation corresponds to one pulse of eustatic, interglacial transgression (Skultorp Member) through normal regression as the rate of sea-level rise decelerates (upper member). Two unconformities, at the base and top of the Loka Formation, respectively, represents eustatic lowstands, although any forced regressive strata (FSST) are lacking, likely due to the combination of rapid build-up of ice in Gondwana and by-pass sedimentation in the area of the core. A ∼1‰ offset in the δ13C stratigraphy within the rising limb (between the first- and second-isotope cluster) is herein interpreted as due to transgressive erosion, rather than erosion during a sea-level lowstand. The full sea-level cycle represented by the Loka Formation likely correlates with the IV-T and IV-R cycles in the East Baltic area and belongs in the LOGC-3 lower order cycle in Anticosti.
Acknowledgements
We acknowledge the Swedish Geological Survey for access to and permission to sample the Stora Sutarve core. This paper is based on a MSc project conducted by NG and supervised by MC. Linn Valtonen and Frans Lundberg assisted with sampling and documentation of the core in the early stages of this project. CMØR thanks Jisuo Jin (London, Ontario) for helpful feedback on the brachiopod systematics. We acknowledge constructive comments from Emilia Jarochowska and one anonymous reviewer. This paper is a contribution to IGCP project 735 “Rocks and the Rise of Ordovician Life – Filling knowledge gaps in the Early Palaeozoic Biodiversification”.
Disclosure statement
No potential conflict of interest was reported by the author(s).
Additional information
Funding
References
- Achab, A., Asselin, E., Desrochers, A., Riva, J.F. & Farley, C., 2011: Chitinozoan biostratigraphy of a new Upper Ordovician stratigraphic framework for Anticosti Island, Canada. GSA Bulletin 123, 186–205. doi: 10.1130/B30131.1
- Ainsaar, L., Kaljo, D., Martma, T., Meidla, T., Männik, P., Nõlvak, J. & Tinn, O., 2010: Middle and Upper Ordovician carbon isotope chemostratigraphy in Baltoscandia: a correlation standard and clues to environmental history. Palaeogeography, Palaeoclimatology, Palaeoecology 294, 189–201. doi: 10.1016/j.palaeo.2010.01.003
- Amberg, C., Collart, T., Salenbien, W., Egger, L., Munnecke, A., Nielsen, A., Monnet, C., Hammer, O. & Vandenbroucke, T., 2016: The nature of Ordovician limestone-marl alternations in the Oslo-Asker District (Norway): witnesses of primary glacio-eustasy or diagenetic rhythms? Scientific Reports 6, 18787. doi: 10.1038/srep18787
- Bauert, H., Ainsaar, L., Põldsaar, K. & Sepp, S., 2014: Δ13c chemostratigraphy of the Middle and Upper Ordovician succession in the Tartu-453 drillcore, southern Estonia, and the significance of the HICE. Estonian Journal of Earth Sciences 63, 195–200. doi: 10.3176/earth.2014.18
- Bergström, S.M. & Bergström, J., 1996: The Ordovician-Silurian boundary successions in Östergötland and Västergötland, S. Sweden. GFF 118, 25–42. doi: 10.1080/11035899609546227
- Bergström, S.M., Calner, M., Lehnert, O. & Noor, A., 2011: A new upper Middle Ordovician–Lower Silurian drillcore standard succession from Borenshult in Östergötland, southern Sweden: 1. Stratigraphical review with regional comparisons. GFF 133, 149–171. doi: 10.1080/11035897.2011.622049
- Bergström, S.M., Chen, X., Gutiérrez-Marco, J.C. & Dronov, A., 2009: The new chronostratigraphic classification of the Ordovician system and its relations to major regional series and stages and to δ13C chemostratigraphy. Lethaia 42, 97–107. doi: 10.1111/j.1502-3931.2008.00136.x
- Bergström, S.M., Eriksson, M.E., Schmitz, B., Young, S.A. & Ahlberg, P., 2016: Upper Ordovician δ13Corg chemostratigraphy, K-bentonite stratigraphy, and biostratigraphy in southern Scandinavia: a reappraisal. Palaeogeography, Palaeoclimatology, Palaeoecology 454, 175–188. doi: 10.1016/j.palaeo.2016.04.037
- Bergström, S.M., Eriksson, M.E., Young, S.A., Ahlberg, P. & Schmitz, B., 2014: Hirnantian (latest Ordovician) δ13C chemostratigraphy in southern Sweden and globally: a refined integration with the graptolite and conodont zone successions. GFF 136, 355–386. doi: 10.1080/11035897.2013.851734
- Bergström, S.M., Eriksson, M.E., Young, S.A. & Widmark, E.-M., 2012a: Conodont biostratigraphy, and δ13C and δ34S isotope chemostratigraphy, of the uppermost Ordovician and Lower Silurian at Osmundsberget, Dalarna. Sweden. GFF 134, 251–272. doi: 10.1080/11035897.2012.758169
- Bergström, S.M., Kleffner, M. & Eriksson, M.E., 2020a: Upper Katian (Upper Ordovician) trans-Atlantic δ13C chemostratigraphy: the geochronological equivalence of the ELKHORN and PAROVEJA excursions and its implications. Lethaia 53, 199–216. doi: 10.1111/let.12351
- Bergström, S.M., Lehnert, O., Calner, M. & Joachimski, M.M., 2012b: A new upper Middle Ordovician–Lower Silurian drillcore standard succession from Borenshult in Östergötland, southern Sweden: 2. Significance of δ13C chemostratigraphy. GFF 134, 39–63. doi: 10.1080/11035897.2012.657231
- Bergström, S.M., Saltzman, M.M. & Schmitz, B., 2006: First record of the Hirnantian (Upper Ordovician) δ13C excursion in the North American Midcontinent and its regional implications. Geological Magazine 143, 657–678. doi: 10.1017/S0016756806002469
- Bergström, S.M., Schmitz, B., Terfelt, F., Eriksson, M.E. & Ahlberg, P., 2020b: The δ13C chemostratigraphy of Ordovician global stage stratotypes: geochemical data from the Floian and Sandbian GSSPs in Sweden. GFF 142, 23–32. doi: 10.1080/11035897.2019.1631883
- Brand, U. & Veizer, J., 1981: Chemical diagenesis of a multicomponent carbonate system – 2: stable isotopes. Journal of Sedimentary Petrology 51, 987–997.
- Brenchley, P.J., Carden, G.A., Hints, L., Kaljo, D., Marshall, J.D., Martma, T., Meidla, T. & Nõlvak, J., 2003: High-resolution stable isotope stratigraphy of Upper Ordovician sequences: constraints on the timing of bioevents and environmental changes associated with mass extinction and glaciation. Geological Society of America Bulletin 115, 89–104. doi: 10.1130/0016-7606(2003)115<0089:HRSISO>2.0.CO;2
- Brenchley, P.J. & Cocks, L., 1982: Ecological associations in a regressive sequence: the latest Ordovician of the Oslo-Asker district, Norway. Palaeontology 25, 783–815.
- Calner, M., Bockelie, J.F., Rasmussen, CMØ, Calner, H., Lehnert, O. & Joachimski, M.M., 2021: Carbon isotope chemostratigraphy and sea-level history of the Hirnantian Stage (uppermost Ordovician) in the Oslo-Asker district, Norway. Geological Magazine 158, 1977–2008. doi: 10.1017/S0016756821000546
- Calner, M., Lehnert, O. & Nõlvak, J., 2010: Palaeokarst evidence for widespread regression and subaerial exposure in the middle Katian (Upper Ordovician) of Baltoscandia: significance for global climate. Palaeogeography, Palaeoclimatology, Palaeoecology 296, 235–247. doi: 10.1016/j.palaeo.2009.11.028
- Catuneanu, O., 2006: Principles of Sequence Stratigraphy. Elsevier, Amsterdam. 386 pp.
- Chen, X., Rong, J., Fan, J., Zhan, R., Mitchell, C., Harper, D., Melchin, M., Ping’an, P., Finney, S. & Wang, X., 2006: The Global Boundary Stratotype Section and Point (GSSP) for the base of the Hirnantian Stage (the uppermost of the Ordovician System). Episodes 29, 183–195. doi: 10.18814/epiiugs/2006/v29i3/004
- Ebbestad, J.O.R., Högström, A.E.S., Frisk, ÅM, Martma, T., Kaljo, D., Kröger, B. & Pärnaste, H., 2014: Terminal Ordovician stratigraphy of the Siljan district, Sweden. GFF 137, 36–56. doi: 10.1080/11035897.2014.945620
- Fan, J., Peng, P. & Melchin, M.J., 2009: Carbon isotopes and event stratigraphy near the Ordovician–Silurian boundary, Yichang, South China. Palaeogeography, Palaeoclimatology, Palaeoecology 276, 160–169. doi: 10.1016/j.palaeo.2009.03.007
- Finney, S.C., Berry, W.B.N., Cooper, J.D., Ripperdan, R.L., Sweet, W.C., Jacobson, S.R., Soufiane, A., Achab, A. & Noble, P.J., 1999:Late Ordovician mass extinction: a new perspective from stratigraphic sections in central Nevada. Geology 27, 215–218. doi: 10.1130/0091-7613(1999)027<0215:LOMEAN>2.3.CO;2
- Ghienne, J.-F., Desrochers, A., Vandenbroucke, T.R.A., Achab, A., Asselin, E., Dabard, M.-P., Farley, C., Loi, A., Paris, F., Wickson, S. & Veizer, J., 2014: A Cenozoic-style scenario for the end-Ordovician glaciation. Nature Communications 5, 1–9. doi: 10.1038/ncomms5485
- Goldman, D., Sadler, P.M. & Leslie, S.A., 2020: The ordovician period. In F.M. Gradstein, J.G. Ogg, M.D Schmitz & G.M. Ogg (eds.): Geologic Time Scale 2020, 631–694. Elsevier, Amsterdam.
- Harper, D.A.T., Hammarlund, E.U. & Rasmussen, CMØ, 2014: End Ordovician extinctions: a coincidence of causes. Gondwana Research 25, 1294–1307. doi: 10.1016/j.gr.2012.12.021
- Harper, D.A.T. & Hints, L., 2016: Hirnantian (Late Ordovician) brachiopod faunas across Baltoscandia: a global and regional context. Palaeogeography, Palaeoclimatology, Palaeoecology 444, 71–83. doi: 10.1016/j.palaeo.2015.11.044
- Harris, M.T., Sheehan, P.M., Ainsaar, L., Hints, L., Männik, P., Nõlvak, J. & Rubel, M., 2004: Upper Ordovician sequences of western Estonia. Palaeogeography, Palaeoclimatology, Palaeoecology 210, 135–148. doi: 10.1016/j.palaeo.2004.02.045
- Hints, L., Oraspõld, A. & Nõlvak, J., 2005: The Pirgu Regional Stage (Upper Ordovician) in the East Baltic; lithostratigraphy, biozonation, and correlation. Proceedings of the Estonian Academy of Sciences, Geology = Eesti Teaduste Akadeemia Toimetised, Geoloogia 54, 225–259.
- Hints, O., Martma, T., Männik, P., Nõlvak, J., Põldvere, A., Shen, Y. & Viira, V., 2014: New data on Ordovician stable isotope record and conodont biostratigraphy from the Viki reference drill core, Saaremaa Island, western Estonia. GFF 136, 100–104. doi: 10.1080/11035897.2013.873989
- Jaanusson, V., 1973: Aspects of carbonate sedimentation in the Ordovician of Baltoscandia. Lethaia 6, 11–34. doi: 10.1111/j.1502-3931.1973.tb00871.x
- Jaanusson, V., 1982: The Siljan district. In D.L. Bruton & S.H. Williams (eds.): IV. International Symposium on the Ordovician System. Field Excursion Guide, 15–42. Palaeontological Contributions from the University of Oslo, Oslo.
- Jaanusson, V., 1995: Confacies differentiation and Upper Midde Ordovician correlation in the Baltoscandian. Proceedings of the Estonian Academy of Sciences. Geology 44, 73–86. doi: 10.3176/geol.1995.2.01
- Jones, D.S., Fike, D.A., Finnegan, S., Fischer, W.W., Schrag, D.P. & McCay, D., 2011: Terminal Ordovician carbon isotope stratigraphy and glacioeustatic sea-level change across Anticosti Island (Québec, Canada). GSA Bulletin 123, 1645–1664. doi: 10.1130/B30323.1
- Kaljo, D., Martma, T. & Saadre, T., 2007: Post-Hunnebergian Ordovician carbon isotope trend in Baltoscandia, its environmental implications and some similarities with that of Nevada. Palaeogeography, Palaeoclimatology, Palaeoecology 245, 138–155. doi: 10.1016/j.palaeo.2006.02.020
- Kiipli, E. & Kiipli, T., 2020: Hirnantian sea-level changes in the Baltoscandian Basin, a review. Palaeogeography, Palaeoclimatology, Palaeoecology 540, 109524. doi: 10.1016/j.palaeo.2019.109524
- Kröger, B., Ebbestad, J.O.R., Lehnert, O., Ullmann, C.V., Korte, C., Frei, R. & Rasmussen, CMØ, 2015: Subaerial speleothems and deep karst in central Sweden linked to Hirnantian glaciations. Journal of the Geological Society 172, 349–356. doi: 10.1144/jgs2014-071
- Kröger, B., Penny, A., Shen, Y. & Munnecke, A., 2019: Algae, calcitarchs and the Late Ordovician Baltic limestone facies of the Baltic Basin. Facies 66, 1. doi: 10.1007/s10347-019-0585-0
- Kump, L.R., Arthur, M.A., Patzkowsky, M.E., Gibbs, M.T., Pinkus, D.S. & Sheehan, P.M., 1999: A weathering hypothesis for glaciation at high atmospheric pCO2 during the Late Ordovician. Palaeogeography, Palaeoclimatology, Palaeoecology 152, 173–187. doi: 10.1016/S0031-0182(99)00046-2
- Ling, M.-X., Zhan, R.-B., Wang, G.-X., Wang, Y., Amelin, Y., Tang, P., Liu, J.-B., Jin, J., Huang, B., Wu, R.-C., Xue, S., Fu, B., Bennett, V.C., Wei, X., Luan, X.-C., Finnegan, S., Harper, D.A.T. & Rong, J.-Y., 2019: An extremely brief end Ordovician mass extinction linked to abrupt onset of glaciation. Solid Earth Sciences 4, 190–198. doi: 10.1016/j.sesci.2019.11.001
- Männil, R., 1966: Evolution of the Baltic Basin during the Ordovician. Valgus, Tallinn. 200 pp. [in Russian with English summary].
- Melchin, M.J. & Holmden, C., 2006: Carbon isotope chemostratigraphy of the Llandovery in Arctic Canada: implications for global correlation and sea-level change. GFF 128, 173–180. doi: 10.1080/11035890601282173
- Nielsen, A.T., Ahlberg, P., Ebbestad, J.O.R., Hammer, Ø., Harper, D.A.T., Lindskog, A., Rasmussen, C.M.Ø. & Stouge, S., 2023: The Ordovician of Scandinavia: a revised regional stage classification. Geological Society, London, Special Publications 532, 267–315. doi: 10.1144/SP532-2022-157
- Põldvere, A., 2010: Estonian geological sections. Viki drill core. Geological Survey of Estonia Bulletin 10, 1–56.
- Rasmussen, CMØ, Ebbestad, J.O.R. & Harper, D.A.T., 2010: Unravelling a Late Ordovician pentameride (Brachiopoda) hotspot from the Boda Limestone, Siljan district, central Sweden. GFF 132, 133–152. doi: 10.1080/11035897.2010.506008
- Rasmussen, CMØ & Harper, D.A.T., 2011: Interrogation of distributional data for the end-Ordovician crisis interval: where did disaster strike? Geological Journal 46, 478–500. doi: 10.1002/gj.1310
- Rasmussen, CMØ, Vandenbroucke, T.R.A., Nogues-Bravo, D. & Finnegan, S., 2023: Was the Late Ordovician mass extinction truly exceptional? Trends in Ecology and Evolution 38, 812–821. doi: 10.1016/j.tree.2023.04.009
- Ripperdan, R.L., Cooper, J.D. & Firmey, S.R., 1998: High-resolution 813C and lithostratigraphic profiles from Copenhagen Canyon, Nevada: Clues to the behaviour of ocean carbon during the Late Ordovician global crisis. Mineralogical Magazine 62A, 1279–1280. doi: 10.1180/minmag.1998.62A.3.03
- Rong, J., Harper, D.A.T., Huang, B., Li, R., Zhang, X. & Chen, D., 2020:: The latest Ordovician Hirnantian brachiopod faunas: New global insights. Earth-Science Reviews 208, 103280. doi: 10.1016/j.earscirev.2020.103280
- Schmitz, B. & Bergström, S.M., 2007: Chemostratigraphy in the Swedish Upper Ordovician: regional significance of the Hirnantian δ13C excursion (HICE) in the Boda Limestone of the Siljan region. GFF 129, 133–140. doi: 10.1080/11035890701292133
- Schobben, M., Ullmann, C.V., Leda, L., Korn, D., Struck, U., Reimold, W.U., Ghaderi, A., Algeo, T.J. & Korte, C., 2016: Discerning primary versus diagenetic signals in carbonate carbon and oxygen isotope records: an example from the Permian–Triassic boundary of Iran. Chemical Geology 422, 94–107. doi:10.1016/j.chemgeo.2015.12.013.
- Stridsberg, S., 1975: Sedimentology of upper Ordovician regressive strata in Västergötland. Publications from the Institutes of Mineralogy, Paleontology, and Quaternary Geology, University of Lund 230, 214–221.
- Stridsberg, S., 1980: Sedimentology of upper ordovician regressive strata in Västergötland. GFF 102, 213–221.
- Sutcliffe, O.E., Dowdeswell, J.A., Whittington, R.J., Theron, J.N. & Craig, J., 2000: Calibrating the Late Ordovician glaciation and mass extinction by the eccentricity cycles of Earth’s orbit. Geology 28, 967–970. doi: 10.1130/0091-7613(2000)28<967:CTLOGA>2.0.CO;2
- Suzuki, Y., Shiino, Y. & Bergström, J., 2009: Stratigraphy, carbonate facies and trilobite associations in the Hirnantian part of the Boda Limestone, Sweden. GFF 131, 299–310. doi: 10.1080/11035890903452670
- Wang, G., Zhan, R. & Percival, I.G., 2019: The end-Ordovician mass extinction: a single-pulse event? Earth-Science Reviews 192, 15–33. doi: 10.1016/j.earscirev.2019.01.023
Appendix
Figure A1. Photographs of the studied 34.5 m of the core, from core boxes no. 81–86. This corresponds to the interval 460.55–494.90 m below ground level, as marked by drillers. We used the base of the conspicuously laminated limestone in the lowermost metre-length of box 82 as reference level for our metric data and samples. This corresponds to the base of our subunit B in the Skultorp Member and to ca 471.58 m below ground level in the core. The core is stored at the Geological Survey of Sweden.
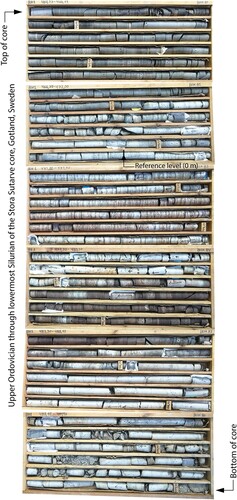
Figure A2. Core scans of the Loka Formation with exact positions of δ13C samples. White circles indicate samples taken directly from the cut and polished core surface, where carbonate microfacies were easily identified, whereas the few grey circles indicate samples taken from the uncut, raw surface of the core. Grey lines next to the core scans represent the studied thin sections.