
 ?Mathematical formulae have been encoded as MathML and are displayed in this HTML version using MathJax in order to improve their display. Uncheck the box to turn MathJax off. This feature requires Javascript. Click on a formula to zoom.
Abstract
Varietal identification has attained prime importance at a global level particularly in the context of plant variety protection. In this study, forty-six traits were characterized for the establishment of the sheer distinctness among eighteen rice varieties. Morphologically, out of forty-six traits, twenty-five traits did not display any variation among the varieties studied. Significant variations were observed for 21 traits which are relatively more informative in the identification/characterization. Distinctness, uniformity and stability-based fingerprints specific to the studied varieties were developed based on the variations. A total of 175 simple sequence repeat (SSR) markers were screened for polymorphism; 53 hypervariable polymorphic SSR markers were utilized for fingerprinting of rice varieties. A total of 151 alleles were detected in these 53 SSR markers with an amplification size ranging from 120 to 750 bp and the allelic range of 2–4. The average number of alleles observed was 2.84 per locus. The PIC values of 53 SSRs ranged from 0.03 (RM 12983) to 0.64 (RM 11449) with an average of 0.40. The generated allelic variations of 53 SSR markers for the varieties were translated into DNA barcode profiles by separating the allele size from each SSR locus. Multiplex polymerase chain reaction (PCR) with five markers (RM 21392, RM 1388, RM 6699, RM 25754 and RM 16913) was used to identify rice varieties based on the band positions. This study classifies and identifies rice varieties and is an important reference to test the authenticity and varietal purity of other rice varieties in the future.
Supplemental data for this article is available online at https://doi.org/10.1080/13102818.2021.1987324 .
Introduction
Seeds are the primarily most significant agricultural tool that assists in the enhancement of productivity, production and income of the farmer and facilitates the determination of the performance and efficacy of other inputs. The quality seed alone contributes about 15–20% to the total production contingent to the crop and it can further rise to 45% with efficient management of other inputs [Citation1]. The authenticity of the variety, quality and purity of seeds is extremely significant for production of crops and vegetables [Citation2]. Felicitously timed production of optimum quantities of quality seeds in accordance with a good genetic potential appropriate to the agro-climatic conditions at a nominal price is largely crucial and should be made accessible to the farmers for reaching the pinnacle of agricultural production, or at the very least, to its full potential [Citation3]. In India, the private sector concedes to large-scale rice seed production and marketing of publicly bred cultivars. The PPV & FR Act with respect to protection and registration of crop varieties, a regulatory mechanism that is in force in India, uses the protocols similar to those of UPOV rice, but with relevant modifications in the morphological descriptors of indica rice [Citation4].
The constant and ever increasing number of improved varieties leads to a narrow genetic base and creates a hiccup in varietal identification since morphological descriptors are limited in their utility when too closely related cultivars are to be distinguished from one other. Unambiguous identification of varieties is exceedingly important for registration and certification of newly released and notified varieties to curb the supply of spurious seed and to avoid the retail of the same variety under different entitlements by private companies and seed production agencies [Citation5]. The rise of systems for the purpose of protection of plant breeder’s rights across the globe is an immediate need for generation of data that can distinguish one variety from the other [Citation3]. In the process of seed production and multiplication, plant breeders, farmers, certification agencies, seed testing laboratories and seed industry should know the specific morphological traits of the variety for identification at different growth stages of the crop. The distinctness, uniformity and stability (DUS) testing done based on essential morphological traits and employment of biochemical markers for varietal identification is selective to environmental influence [Citation6]. Polymerase chain reaction (PCR)-based molecular markers, especially simple sequence repeats (SSRs), are very quick, reliable, environmentally neutral in varietal profiling and purity analysis of crop varieties [Citation7] and are accommodating in the development of unambiguous DNA fingerprints of cultivars [Citation8,Citation9]. SSR fingerprints are inherent in genomes and are not affected by internal and external environmental factors, including growth and development time [Citation10]. Both SSR and DUS based fingerprinting of the rice varieties gives the information about phylogenetic relationships and aids rice breeders in varietal registration and protection of intellectual property rights. Very limited data are available for varieties which are in the seed multiplication chain. Combination of morphological traits and DNA fingerprinting of cultivars are very important for identification of adultrated seeds at field and lab level. Against the backdrop of the aforementioned scenario, the present study was planned and conducted to assess the morphological traits for varietal identification at the field conditions by using DUS traits and development of SSR based DNA barcodes/molecular fingerprints for varietal identification of elite rice varieties (that are in the seed chain) of Telangana and Andhra Pradesh states in India.
Materials and methods
Plant material
The experimental material for the present study comprised a total of 18 rice varieties which are grown commercially in the Telangana and Andhra Pradesh states in India, enjoying high market demand and presence in the regular seed chain. Details of the varieties along with the names of the centers where the selected varieties were developed are provided in . The seeds of the selected varieties were obtained from the respective research stations and were raised at the Seed Research and Technology Center (SRTC), Professor Jayashankar Telangana State Agricultural University, Hyderabad, India, during kharif, 2018.
Table 1. List of rice varieties used for developing DNA fingerprints.
Experiment layout and morphological DUS characters
Thirty-day-old seedlings of each variety were transplanted in 4 rows of 4 meters length with a spacing of 30 cm between each row and 20 cm between each plant (as per DUS guidelines given by PPV and FR Act [Citation11] in a randomized block design with three replications. All the necessary precautions and management practices were adopted to maintain uniform plant population. Observations on 46 morphological traits were recorded at the appropriate crop stage (Table S1, supplemental material) according to the National Test Guidelines of DUS testing for rice variety developed by PPV & FR Act [Citation11] on ten arbitrarily chosen and tagged plants of each genotype per replication. Data on the forty-six morphological traits used in the study are detailed in Table S2, supplemental material.
Genomic DNA isolation and quantification
Genomic DNA was extracted using a cetyl-trimethyl-ammonium bromide (CTAB) method as described by Murray and Thompson [Citation12]. Five grams of leaf tissue were crushed to a very fine powder in DNA extraction buffer (100 mmol/L Tris-HCl, 20 mmol/L ethylenediaminetetraacetic acid (EDTA), 1.4 mol/L NaCl, 2% CTAB, 1% polyvinyl pyrrolidone and 0.1% β-mercaptoethanol, pH 8.0) and incubated at 60 °C for 1 h. Phenol: Chloroform: isoamyl alcohol (25:24:1) was added to the mixture and centrifuged (Sigma Aldrich 1-15) at 11,000 rpm for 15 min at 4 °C. The upper aqueous phase was transferred to a fresh centrifuge tube and the Phenol: chloroform: isoamyl alcohol step was repeated. The DNA pellet was washed with 70% cold ethanol twice and air dried. The DNA pellet was dissolved in 100 μl Tris-EDTA buffer. The quality of the DNA was checked by running in a 1.5% agarose gel stained with ethidium bromide (EDBr) and quantified by a NanoDrop spectrophotometer. DNA was diluted with autoclaved Milli-Q water to a working concentration of 20 ng/μl and was eventually used for SSR analysis.
PCR conditions and allele size determination
Polymerase chain reaction (PCR) was carried out in 10 μl volume containing 10 ng of 2 μL template DNA, 5 μL of 10xPCR master mix (Takara PCR mix), 2 μL of sterile (deionized) water, 0.5 μL of forward and reverse primers. All PCR reactions were performed in Agilent Thermal cycler with temperature cycling profile of an initial denaturation at 94 °C for 5 min followed by 35 cycles of denaturation at 94 °C for 45 s, primer annealing step between 53 °C and 60 °C (according to the optimal temperature of the primers) for 45 s, and extension at 72 °C for 45 s with a final extension step at 72 °C for 10 min. Electrophoresis was carried out with a 1.5% agarose gel along with the 100 base pair DNA ladder (New England Bio laboratories (NEB)) for 2 to 2.30 h in 0.5 Tris-boric acid-EDTA (TBE) buffers. The sizes of the amplified fragments were then surveyed under a UV transilluminator and were estimated with the help of a Bio-Rad Molecular Imager Gel Doc XR System using a 100 bp DNA ladder (NEB) as a size standard.
Microsatellite markers and DNA barcoding/fingerprinting
Molecular characterization of the 18 rice varieties was done by using 175 hyper variable microsatellite markers selected from the microsatellite database, (http://www.gramene.org/markers/microsat/) distributed across all the 12 chromosomes of rice. The sequence and the details of the primers used are listed in Table S3. Out of these 175 SSR markers, 53 SSR markers (30.28%) were polymorphic among the varieties studied and were used to generate DNA fingerprints. The position and distribution of the total markers and polymorphic markers used in the study are presented in Figures S1 and S2. The DNA barcode for each variety was developed from the allelic variation data by aligning the allele size data of all the primers from the lowest to the highest [Citation13–Citation16].
Data scoring and analysis
To evaluate the polymorphism status of the markers, the polymorphism information content (PIC) for each SSR marker was calculated according to the formula [Citation17].
where i is ‘i’th allele of the ‘j’th marker, n is the number of the ‘j’th marker’s alleles and Рi is the frequency of the ‘i’th allele. This formula gives us an indicator of how many alleles a certain marker has and to what extent these alleles divide evenly. The frequency is the number of times a particular allele appeared in 18 varieties divided by the total number of DNA bands generated in the whole population.
Results and discussion
Morphological/DUS characterization of rice varieties
The 18 rice varieties were characterized for 46 DUS characters at different growth stages of the crop. Out of these 46 visually assessed DUS characters studied, 25 characters were found to be monomorphic (Basal leaf sheath colour, Leaf Intensity of green colour, Leaf Anthocyanin colouration, Leaf distribution of anthocyanin colouration, Leaf sheath anthocyanin colouration, Leaf sheath Intensity of anthocyanin colouration, Leaf auricles, Leaf collar, Leaf anthocyanin colouration of collar, Leaf ligule, Leaf colour of ligule, Leaf width of blade, Lemma anthocyanin colouration of keel, Lemma anthocyanin colouration of area below apex, Lemma anthocyanin colouration of apex, Spikelet colour of stigma, Stem anthocyanin coloration of nodes, Stem intensity of anthocyanin coloration of nodes, Stem anthocyanin colouration of internodes, Panicle awns, Presence of secondary branching in panicles, Panicle colour of awns, Length of longest awn in panicle, Panicle distribution of awns and sterile lemma colour) and showed no variation among the varieties studied. Eighteen traits were found to be dimorphic (Leaf pubescence of blade surface, Leaf anthocyanin colouration of auricles, Shape of ligule in leaf, Length of leaf blade, Culm attitude, Flag leaf attitude of blade, Spikelet density of pubescence of lemma, Stem thickness, Stem length, Panicle length of main axis, Flag leaf attitude of blade, Panicle number per plant, Spikelet colour of tip of Lemma, Lemma and Palea colour, Panicle secondary Branching, Panicle attitude of Branches, Panicle exertion, Leaf senescence) and the remaining three characters exhibited polymorphism (Time of heading, Panicle curvature of main axis, Time of maturity (days)) among the varieties. The significant variations observed for these 21 traits are more functional in the identification/characterization of the varieties. Chakrabarty et al. [Citation18] observed that eight traits were monomorphic, eight were dimorphic, 13 trimorphic and the remaining 15 were polymorphic among 44 plants and grain qualitative characters studied in 91 farmers’ varieties. Previously, a few studies reported the different polymorphic status of the traits among the genotypes studied [Citation4,Citation19,Citation20]. The frequency distributions observed among the 21 differentiating traits are shown in . These traits were found to be more advantageous in the characterization of the studied varieties. Seed and plant characters are major components of cultivar identification because they provide dependable data. A set of morphological traits/DUS descriptors are essential to distinguish the varieties from one another [Citation21–23]. Several earlier workers also used DUS descriptors/traits for characterization of genotypes in the studied crop [Citation17,Citation24–26].
Table 2. Frequency distribution of 21 differentiating traits.
During the vegetative stage, variation was observed for six traits among the varieties. Based on the absence of anthocyanin coloration of the collar and the shape of ligule of the varieties, JGL 18047 (acute) and JGL 24423 (split) can be differentiated from the similar grain type varieties KNM 118 and Tellahamsa (Present and acute). Sinha et al. [Citation27] and Parthiban et al. [Citation25] observed that these traits are useful in the characterization of the varieties during vegetative stages. The Lemma and Palea colour was found to be a useful trait for characterization at the initial stages of the crop growth of rice varieties, germplasm lines and parental lines of hybrids [Citation20,Citation28,Citation29]. Tellahamsa having a short leaf blade, acute and anthocyanin in ligule, can be discerned from the fine-grain variety KNM 118 with long leaf blade, acute and anthocyanin in ligule. The character Culm attitude, can discriminate the varieties like JGL 1798, JGL 3855, JGL 11470 (Erect to semi erect) from the varieties JGL 18047, JGL 11118, JGL 17004 (Open type). The traits Leaf pubescence on blade surface and Anthocyanin colouration of auricle can differentiate varieties JGL-3855, KNM-118, RNR-2458, Ramappa and KPS-2874 (Medium pubescence and light purple colour) from the varieties RNR-15048, JGL-1798, BPT-5204 and WGL-44 (weak pubescence and colour less). During flowering and grain filling stage, eight traits showed variation among the varieties. Time of heading and Flag leaf attitude of blade can succor to distinguish the varieties RNR 2458 and BPT 5204 (medium and semi erect), and varieties like RNR 15048, RNR 2465, Ramappa and KPS 2874 (very early and semierect). Sarawgi et al. [Citation30] and Shrivastava et al. [Citation26] observed that these characters are critical for characterization of the varieties during the flowering and grain filling stage. Seven traits during grain maturity stage could differentiate the varieties. Panicle curvature of main axis, Panicle exertion and Time of maturity were found to be more useful in the characterization of the varieties Tellahamsa (drooping, well exerted and very early), MTU-1010, WGL-32100, RNR-2458 (deflected, mostly exerted and medium) and WGL 44, BPT 5204 (semi-straight to deflected, mostly exerted and late). Gour et al. [Citation24] and Sharma et al. [Citation22] emphasized the importance of this character during the grain maturity and reproductive stages for characterization of the varieties.
Fingerprinting using DUS traits
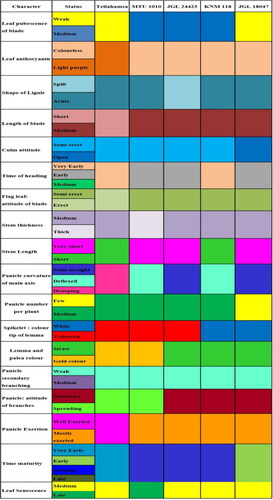
Based on the variation observed in DUS/Morphological traits among the varieties studied, DUS fingerprints were developed using 21 informative traits (). DUS fingerprint was more useful in the identification of the varieties at the field level at specific crop growth stages. For further differentiating the other similar grain type, medium slender varieties from popular consumer preferred variety BPT 5204 (Popularly Sambha Mahsuri) () and also to differentiate the long slender varieties from popular varieties Tellahamsa and MTU 1010 (), DUS fingerprints were developed using 20 differentiating traits among varieties. However, the trait density of pubescence of lemma was not useful for differentiating the medium and long slender varieties; this can be used in differentiating RNR 15048 and RNR 2465 (medium) from the other varieties. The developed DUS fingerprints can serve as a reference database for comparing the varieties. DUS fingerprints resembling barcodes are unique and these data can be integrated into a national coordinated database to increase the precision for identification of individual varieties with absolute certainty.
Figure 1. DUS Fingerprints of 18 rice varieties using 21 informative traits. (1) JGL1798, (2) JGL 3855, (3) JGL 11470, (4) JGL 18047, (5) JGL 11118, (6) JGL 17004, (7) JGL 24423, (8) KNM 118, (9) RNR 15048, (10) Tellahamsa, (11) RNR 2458, (12) RNR 2465, (13) WGL 44, (14) RAMAPPA, (15) WGL 32100, (16) BPT 5204, (17) MTU 1010, (18) KPS 2874.
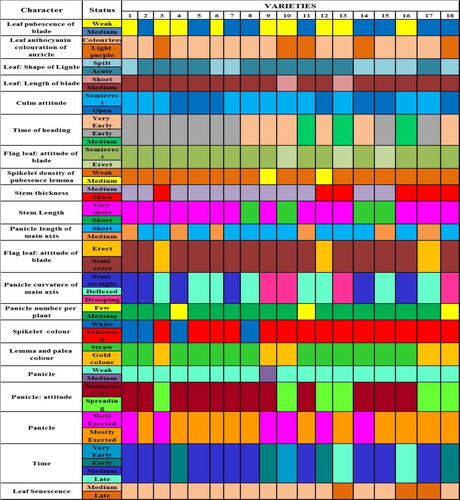
Figure 2. DUS Fingerprints of Medium slender varieties differentiating BPT 5204 with other similar looking varieties using 20 differentiating traits.
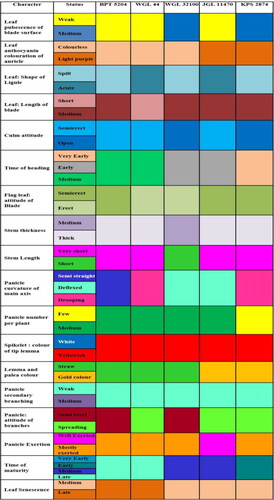
Figure 3. DUS Fingerprints of long slender varieties differentiating Tellahamsa and MTU 1010 with other similar looking varieties using 20 differentiating traits.
Allelic variations and polymorphism information content (PIC) of SSR markers
A total of 175 SSR markers located across the 12 chromosomes (the marker distribution across chromosomes are shown in Figure S1) were employed for fingerprinting the chosen varieties. Based on the polymorphic status, 53 hypervariable polymorphic SSR markers (markers distribution across chromosomes is shown in Figure S2) were found to be informative for discriminating the varieties and these markers were used for fingerprinting of the varieties. The 53 polymorphic SSR markers produced a total of 151 alleles ranging from 2 to 4 alleles per marker with an average of 2.84 alleles per marker. The number of alleles per marker was 2 in RM 16816, RM 16760, RM RM16769, RM RM3524, RM RM18600, RM RM18983, RM RM18516, RM20043, RM21521, RM21069, RM21392, RM6699, RM22703, RM23959, RM26438, RM28067, and RM27601; 3 alleles per marker in RM10009, RM10695, RM10255, RM13131, RM15151, RM15203, RM14698, RM15379, RM16913, RM6909, RM19346, RM19697, RM19417, RM20913, RM22171, RM22372, RM22585, RM22772, RM23791, RM23966, RM25661, RM25181, RM25754, RM26558, RM27689 and RM28481 markers, while 4 alleles in RM11449, RM12398, RM12983, RM13209, RM15337, RM1388, RM18704, RM23819 and RM26784. The polymorphism information content (PIC) of these 53 SSR markers ranged from 0.03 (RM12983) to 0.64 (RM11449), with an average of 0.40. The numbers of alleles amplified by each of the polymorphic SSR markers along with the PIC values are given in . A total of twenty-two SSR markers produced PIC values of over 0.5 and these markers were more useful for fingerprinting. However, a few markers had a low range of PIC and discriminating power (RM12983, RM13209. RM14698, RM16816, RM18600, RM18516, RM27689). The PIC value is the reflection of allele diversity and their frequency among genotypes. Markers with higher PIC value will be useful in gene mapping, molecular breeding and germplasm evaluation [Citation31] and the markers with PIC value of more than 0.5 are considered to be informative markers for genetic studies to measure the polymorphism for a marker locus [Citation32]. Vanisri et al. [Citation15] reported that the PIC values ranged from 0.14 to 0.99 for medium slender varieties and from 0.23 to 0.98 for long slender varieties of rice. Samal et al. [Citation33] reported that the PIC value for the 36 SSRs varied from 0.428 (RM261) to 0.982 (RM16649). Similar results of alleles per marker and PIC values were observed by Gunasena et al. [Citation34], Bhave [Citation35] and Ishaq et al. [Citation36] among the different crops studied.
Table 3. Polymorphism information content and number of alleles per 53 SSR markers.
Unique markers/alleles for varieties
A set of seventeen markers among the 53 polymorphic markers, exhibited unique/specific alleles for nine varieties (, and Figure S3) and can distinguish those varieties from the others, hence they can serve as molecular IDs for those 9 varieties.
Figure 4. Amplification pattern of the rice varieties obtained using the SSR marker. RM 23819, RM 3524, RM 19346, RM25754 and 20913. Lane 1—JGL1798, Lane 2—JGL3855, Lane 3—JGL11470, Lane 4—JGL18047, Lane 5—JGL11118, Lane 6—JGL17004, Lane 7—JGL24423, Lane 8—KNM118, Lane 9—RNR15048, Lane 10—Tellahamsa, Lane 11—RNR2458, Lane 12—RNR2465, Lane 13—WGL44, Lane 14-Ramapa, Lane 15—WGL32100, Lane 16—BPT5204, Lane 17—MTU1010, Lane 18—KPS2874.The unique alleles amplified by the varieties are indicated by arrow.
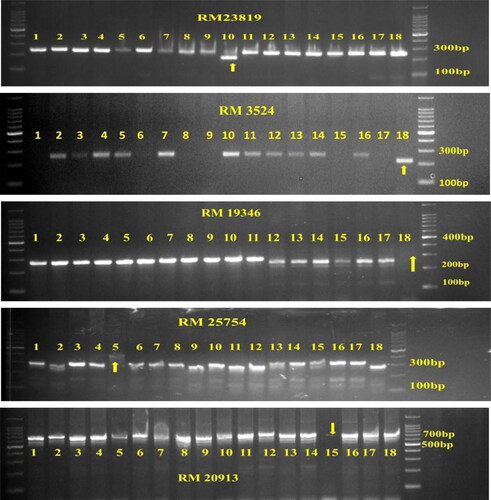
Table 4. Seventeen Unique markers for the nine varieties.
DNA/molecular barcodes/fingerprinting
The resulting allelic variations of 53 SSR markers for the varieties were converted to DNA barcode profiles by separating the allele size from each SSR locus by sorting the allele size data from the lowest to the highest. These allele size bars were then drawn to a linear scale for all of the analyzed varieties (). Vanisri et al. [Citation15] developed DNA barcodes, for 14 visually similar varieties of medium grained rice and eight long grained slender varieties, from the unique pattern of SSR polymorphism from the allelic variation data. The DNA barcodes using SSR marker data were developed successfully for eggplant by Lakshmana Reddy et al. [Citation14] and guava by Kanupriya et al. [Citation13] and Chaitanya et al. [Citation37]. These barcode profiles allow easy detection of genotypic differences, thereby helping in the identification of the individual with absolute certainty by acting as a reference or standard DNA barcode library [Citation13] and useful tool for intellectual property rights protection or the resolution of commercial disputes. SSR fingerprints were constructed by the different primers combination, which provides useful methodological guidance for the construction of a standard DNA fingerprint database and performing rice varieties mapping analysis in the future. Molecular characterization done by using polyacrylamide gel electrophoresis (PAGE) in near future will be more accurate and reliable for identification of rice varieties. Application of microsatellite markers as descriptors for varietal protection and fingerprinting has been more prominent post the acceptance by the USDA Plant Variety Protection Office [38].
Figure 5. Microsatellites-based DNA barcodes for 18 varieties of rice.
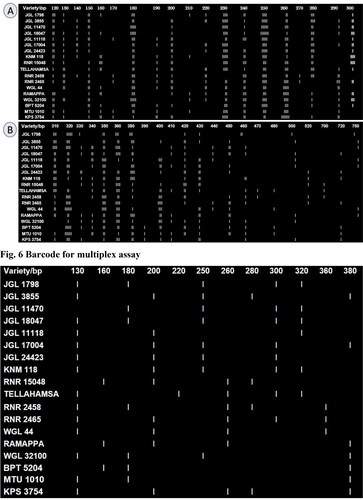
Development of variety-specific multiplex assays
A rapid DNA fingerprinting protocol for rice crop has been designed and verified in Tamil Nadu Agricultural University (TNAU), Coimbatore, in which commercial seed lots are analysed through multiplex PCR involving two markers. Multiplex PCR is a technique to amplify multiple target primers in a single PCR simultaneously to save time and efforts. One set of multiplex assays with five markers (RM 21392, RM 1388, RM 6699, RM 25754 and RM 16913) was developed which can differentiate all the 18 varieties. Earlier, similar kind of multiplex assays were developed by Vanisri et al. [Citation15] to identify 14 medium slender and 8 long slender grain rice varieties. The identity code, code key and DNA barcode for the identified multiplex assay are provided in , Tables S4 and S5.
Figure 6. Barcode for multiplex assay.
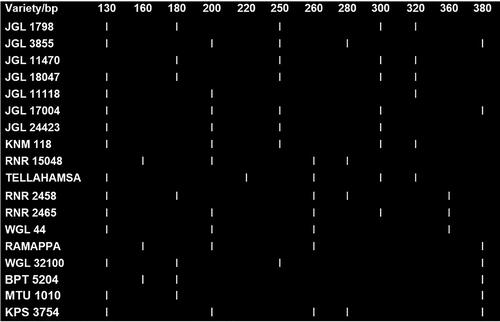
With this multiplex PCR assay, it is possible to identify each of the varieties based on the band positions on the gel. The most frequent seed complaints are on mixing of BPT 5204 with other similar grain type varieties and mixing of long slender varieties Tellahamsa, MTU 1010, KNM 118, JGL 18047 and JGL 24423. BPT 5204 can be differentiated from other similar-looking varieties, WGL 44, JGL 11470 and KPS 2874, by this set of multiplex markers if the bands are only at 160 and 380 base pairs. None of the similar grain types developed bands at the same positions. Similarly, RNR 15048 can be differentiated from other similar looking varieties by its unique banding pattern at positions 160, 200, 260 and 280.Among the long slender rice varieties, MTU 1010 can be differentiated by its only 2 band positions at 130 and 380 base pairs. All the other long grain varieties show more than two bands. Most similar looking varieties (JGL 18047, KNM 118) show 5 bands each and can be differentiated by a single band at 180 and 200 base pair lengths respectively. The variety JGL 24423 was differentiated from these two varieties as it shows 4 bands instead of 5 bands. Tellahamsa, MTU 1010 has a completely different banding pattern compared to KNM 118, JGL 18047 and JGL 24423. This study can serve as a significant reference for the authenticity and purity detection of different rice cultivars.
According to our knowledge, this is the first attempt to develop both DUS and SSR based barcode/fingerprints for the rice varieties which are commercially grown (that are in the continuous seed chain) in Telangana and Andhra Pradesh states of India.
Conclusions
Among the 46 morphological traits studied, 21 characters showed variation among the 18 varieties and these characters were more useful in characterizing the varieties. DUS based barcodes/fingerprints specific to the varieties were developed based on variations observed. We used 53 polymorphic microsatellite markers to generate a unique fingerprinting profile for each variety that may act as a reference molecular barcode/ID for accurate identification with a visual representation of the number and size of alleles, allowing a facile detection of genotypic differences between analyzed cultivars. The multiplex assay with a set of 5 markers (RM 21392, RM 1388, RM 6699, RM 25754 and RM 16913) can help in identifying all the varieties in a single PCR reaction. Further validation of the identified DUS/DNA barcodes in single plants/population of the varieties will be immensely useful in future variety identification and solving the adulteration disputes in seed lots.
Authors’ contribution
R.H., D.B., S.V. V.G. designed and conceived the experiment; R.H., D.B., S.V., V.G. performed the experiments; R.H., S.V., L.S. analyzed the data; R.H., S.V. wrote the manuscript; L.S., S.V. critically revised the manuscript.
Supplemental Material
Download MS Word (1.1 MB)Supplemental Material
Download MS Excel (50 KB)Supplemental Material
Download MS Word (33.5 KB)Acknowledgements
The first author is thankful to the Indian Council of Agricultural Research (ICAR), New Delhi for the kind grant of Junior Research Fellowship (JRF) for the master’s degree programme. The authors are thankful to Professor Jayashankar Telangana State Agriculture University, Hyderabad, for providing financial support and other facilities to carry out the essential research work.
Data availability statement
The authors confirm that the data supporting the findings of this study are available within the article (and/or) its supplementary materials.
Disclosure statement
The authors don’t have any potential conflicts of interests to declare.
Funding
The author(s) reported there is no funding associated with the work featured in this article.
References
- Ali AA. Role of seed and its technological innovations in Indian agricultural sector. Biosci Biotech Res Comm. 2016;9(4):621–624.
- George RAT. Vegetable seed production. Rome (Italy): CABI; 2009.
- Faccioli P, Terzi V, Monetti A, et al. B-hordein STS markers for barley genotype identification: comparison with RFLPs, hordein A-PAGE and morph physiological traits. Seed Sci Technol. 1995; 23(2):4415–4427.
- Mondal B, Singh SP, Joshi DC. DUS characterization of rice (Oryza sativa L.) using morphological descriptors and quality parameters. Outlook Agric. 2014;43(2):131–137.
- Korir NK, Han J, Shangguan L, et al. Plant variety and cultivar identification: advances and prospects. Crit Rev Biotechnol. 2013;33(2):111–125.
- Ainsworth CC, Sharp PJ. The potential role of DNA probes in plant variety identification. Plant Var Seed. 1989;2:27–34.
- Kuleung C, Baenziger PS, Dweikat I. Transferability of SSR markers among wheat, rye, and triticale. Theor Appl Genet. 2004;108(6):1147–1150.
- Chakravarthi BK, Naravaneni R. SSR marker based DNA fingerprinting and diversity study in rice (Oryza sativa. L). Afr J Biotechnol. 2006;5:684–688.
- Zhu YF, Hu J, Han R, et al. Fingerprinting and identification of closely related wheat (Triticum aestivum L.) cultivars using ISSR and fluorescence-labelled TP-M13-SSR markers. Aus J Crop Sci. 2012;5:846–850.,
- Zheng X, Cheng T, Yang L, et al. Genetic diversity and DNA fingerprints of three important aquatic vegetables by Est-SSR markers. Sci Rep. 2019;9(1):14074.
- Protection of Plant Varieties and Farmer’s Rights Authority (PPV&FRA). Specific DUS test guidelines for twelve notified crops – rice (Oryza sativa L.). Plant Variety J India. 2007;1:151–169.
- Murray MG, Thompson WF. Rapid isolation of high molecular weight plant DNA. Nucl Acids Res. 1980;8(19):4321–4325.
- Kanupriya, Latha PM, Aswath C, Reddy L, et al. Cultivar identification and genetic fingerprinting of guava (Psidium guajava) using microsatellite markers. Int J Fruit Sci. 2011;11:184–196.
- Lakshmana Reddy DC, Srikanth HS, Aswath C, et al. SSR based DNA fingerprinting bar codes for eggplant varieties and hybrids. Int J Vegetable Sci. 2012;18:1–12.
- Vanisri S, Durga Rani CHV, Mohammed Jamaloddin, et al. Cultivar identification and DNA finger printing of rice varieties and their utilization in seed genetic purity assessment. Agriculture Research. 2018;
- PPV & FRA, Guidelines for the conduct of test for distinctiveness, uniformity and stability on rice (Oryza sativa L.). Plant Variety J India. 2007;1(1):1–25.
- Chesnokov YV, Artemyeva AM. Evaluation of the measure of polymorphism information of genetic diversity. Sel’skokhozyaistvennaya Biol. 2015;50(5):571–578.
- Chakrabarty SK, Joshi MA, Singh Y, et al. Characterization and evaluation of variability in farmers’ varieties of rice from West Bengal. Ind J Genet Plant Breed. 2012;72:136.
- Aravind K, Banumathy S, Vanniarajan C, et al. DUS characterization and genetic variability studies of rice mutants. Electron J Plan Breed. 2019;10(2):451–461.
- Manjunath GA, Elsy CR, Rajendran P, et al. DUS characterization of rice (Oryza sativa L.) landraces of wayanad. Electron J Plan Breed. 2018;9(2):617–630.
- Islam MZ, Akter N, Chakrabarty T, et al. Agro-morphological characterization and genetic diversity of similar named aromatic rice (Oryza sativa L.) landraces of Bangladesh. Bangladesh Rice J. 2019;22(1):45–56.
- Sharma S, Pokhrel A, Dhakal A, et al. Agro-morphological characterization of rice (Oryza sativa L.) landraces of lamjung and tanahun district. Nepal Ann Plant Sci. 2020;2020:1–3741.
- Singhal NC, Prakash S. The characterization and identification of wheat cultivars – an integrated approach. In: Proceedings of the Indo-British workshop on plant breeders rights. Seed certification and storage, division of seed science and technology. New Delhi: IARI; 1992. p. 140–146.
- Gour L, Koutu GK, Singh Y, et al. Characterization and grouping of indigenous rice lines based on DUS test for different qualitative differentials. Pharm Inn J. 2019;8:1162–1168.
- Parthiban KT, Kanagaraj N, Palanikumaran B, et al. Development of DUS descriptor for casuarina genetic resources. Int J Genet. 2018;10(1):333–338.
- Shrivastava A, Koutu GK, Mishra DK, et al. Characterization of JNPT lines of rice (Oryza sativa L.). Plant Arc. 2015;15:397–403.
- Sinha AK, Mallick GK, Mishra PK. Grain morphological diversity of traditional rice varieties (Oryza sativa l.), in the lateritic region of West Bengal. Int J Conserv Sci. 2015;6:419–426.
- Kujur N, Sandeep B, Yogita S, et al. Assessment of variability of aromatic rice using agro-morphological characterization. Int J Curr Microbiol App Sci. 2017;6(11):1835–1846.
- Rao LS, Prasad GS, Chiranjivi M, et al. DUS characterization for farmer varieties of rice. IOSR-JAVS. 2013;4(5):35–43.
- Sarawgi AK, Rao SLV, Parikh M, et al. Assessment of variability of rice (Oryza sativa L.) germplasm using characterization. J Rice Res. 2013;6:15–28.
- Min H, Yuan T, Jun A. Yield potential and stability in super hybrid rice and its production strategies. J Integr Agric. 2018;16:60345–60347.
- De Woody JA, Honeycutt RL, Skow LC . Microsatellite markers in white-tailed deer. J Hered. 1995;86(4):317–319.
- Samal R, Roy PS, Sahoo A, et al. Morphological and molecular dissection of wild rices from Eastern India suggests distinct speciation between O. rufipogon and O. nivara populations. Sci Rep. 2018;8(1):2773.
- Gunasena PGSD, Wasala SK, Sumanasingha VA. Molecular characterization of accessions from a traditional rice cultivar. Trop Agric Res. 2016;27(1):103–109.
- Bhave SG. DNA fingerprinting of rice varieties using SSR markers. J Agric Res Technol. 2016;41:142–147.
- Ishaq MN, Ehirim BO, Nwanyanwu GC, et al. SSR based DNA fingerprinting of some varieties of rice released in Nigeria. Afr J Biotechnol. 2019;18(11):242–248.
- Chaithanya MN, Sailaja D, Dinesh MR, et al. Microsatellite-based DNA fingerprinting of guava (Psidium guajava) genotypes. Proc Natl Acad Sci India B. 2017;87(3):859–867.
- Diwan N, Cregan PB. Automated sizing of fluorescent-labelled simple sequence repeat (SSR) markers to assay genetic variation in soybean. Theor Appl Genet. 1997;95:723–733.