
Abstract
Several correlations have been reported between men’s testosterone (T) and other characteristics. Stalwart findings are a decline in T during the day, decline with obesity, and decline with advancing age. Here seven previously reported correlations are tested among older American men in the National Social Life, Health and Aging Project (NSHAP), their salivary T measured by enzyme immunoassays (EIA). Few significant correlations are found, with most tests producing weak or null results. These findings, overall, suggest that T does not “work” much among older men. However, a threat to this conclusion is raised by Welker et al. namely that EIA of salivary T may contain large errors, invalidating the tests. To check this possibility, these correlations from the literature were tested among older British men whose salivary T was measured by liquid chromatography-tandem mass spectroscopy (LC-MS/MS), a technique noted for its specificity. Not all could be tested, but the relationships of T with age, obesity, and health are significant among British men, indicating that T remains active in older men, and throwing doubt on the adequacy of EIA for measuring salivary T.
Introduction
Well documented correlates of men’s testosterone (T) include its mean level peaking in the teens to twenties and thereafter declining with age; a decrease in T with obesity; and diurnal decline in T from a high level in the morning. But these (and other) relationships, typically observed among samples including young and middle-aged men, may not hold among older men. “Endocrine function undergoes major changes during aging… Specifically, alterations in hormonal networks and concomitant hormonal deficits/excess, augmented by poor sensitivity of tissues to their action, take place. As the hypothalamic–pituitary unit is the central regulator of crucial body functions, these alterations can be translated in significant clinical sequelae” [Citation1].
This study began by asking if seven previously-reported correlates of T, usually measured from serum, are still seen in older men when T is assayed from saliva. The initial analysis was of a large two-wave (years 2006 and 2011) sample of older American men in the National Social Life, Health and Aging Project (NSHAP), ranging in age from 57 to 85 at Wave 1. NSHAP contains several variables previously reported as correlated with male T. The hormone itself was measured in each wave by enzyme immunoassay (EIA) of saliva samples collected at the time of interview.
Several validation studies show salivary T to be correlated with “free” T in serum, i.e. with that small portion of total T not bound to protein and thus physiologically active. Researchers increasingly collect saliva rather than blood since saliva is cheaper and easier. Among several assay techniques, EIA has become a workhorse of behavioral studies because it is quick, convenient, and does not require radioactive material.
As will be reported under Results, this initial NSHAP analysis produced weak or null correlates, suggesting that T does not “work” as well in older men as had been reported for the full range of ages. However, a threat to this conclusion may be the inaccuracy of EIA for measuring salivary T, a possibility recently raised by [Citation2]. This alternative was evaluated by turning to a large British dataset, the National Survey of Sexual Attitudes and Lifestyles: 2010–2012 (Natsal-3), which assayed salivary T by a different method, liquid chromatography-tandem mass spectroscopy (LC-MS/MS), a technique noted for its specificity. This dataset allowed a retest of some correlations not replicated in NSHAP.
Previously reported correlates of male T
By now it is well established that in men, T has a diurnal rhythm, that low T is associated with obesity, and that T usually declines as men age. These head the list of propositions tested here in older men, which also contains other T correlations reported less frequently or consistently:
Diurnal: Male T has a diurnal rhythm, high in the morning, lower as the day goes on [Citation3,Citation4] though middle-age men secrete less T at night than younger men [Citation5].
Obesity: Low T is associated with obesity [6–18].
Age: At least in industrial societies, men past the age of thirty tend to show declining T [Citation8,Citation7,Citation13,Citation15,Citation18–22].
Consistency across waves: Basal T is consistent from year to year, despite fluctuations during the day. For example, among Australian men, r = .73 for serum T measured five years apart [Citation12], (Supplemental Figure 1).
Sexuality: Lower T is associated with lower sexuality, variously measured [Citation23–27], but there are some null results [Citation28].
With the rising popularity of testosterone replacement therapy (TRT), there has been much attention to associations between T level and male mortality or morbidity [Citation29–37]. Some observers doubt TRT’s efficacy as a rejuvenator and others warn of health risks [Citation37–39]. Most prominent has been the issue of whether high T improves longevity or shortens it by promoting cardiovascular risks [Citation23,Citation40–44]. Therefore, two additions propositions for the test are:
Diabetes: High T is associated with low Ha1c and low incidence of Type 2 diabetes in men [Citation45–47], though finer grain analysis casts some doubt on the validity of earlier reports [Citation48]. Possibly TRT is beneficial for hypogonadal men with Type 1 diabetes [Citation49].
Mortality and morbidity: Knowing which men in Wave 1 of NSHAP died before Wave 2 provides an opportunity to test if T in Wave 1 predicted death. Several measures of health in both waves, apart from diabetes, allow tests for their relationships to T.
These propositions were initially tested with the NSHAP data on older American men. This was followed by a second test of some propositions in older British men in Natsal-3.
Methods
Two surveys: American NSHAP and British Natsal-3
The Institutional Review Board of Syracuse University has determined that this research meets the organization’s ethical standards and qualifies for exemption from human subject regulation.
The National Social Life, Health, and Aging Project (NSHAP) is a longitudinal, population-based study of health and social factors, aiming to understand the well-being of older, community-dwelling Americans by examining the interactions among physical health and illness, medication use, cognitive function, emotional health, sensory function, health behaviors, social connectedness, sexuality, and relationship quality (https://www.nia.nih.gov/research/resource/national-social-life-health-and-aging-project-nshap). Wave 1 (in 2005) included over 3000 interviews of men and women drawn to be nationally representative of older Americans born between 1920 and 1947 (aged 57 to 85 at Wave 1). Wave 2 (in 2010) had nearly 3400 interviews including Wave 1 respondents, plus people drawn for Wave 1 who were not interviewed at that time, plus spouses or cohabiting romantic partners.
The National Survey of Sexual Attitudes and Lifestyles (Natsal-3) is a multi-wave probability-sample study of British men and women to investigate associations among demographic characteristics, lifestyle, general health, and reported health conditions [Citation50,Citation51]. Only the 2010–12 wave is relevant here because it was the first to collect saliva and assay for T. This wave included 15,162 men and women, ages 16–74 years. Thus, NSHAP has two waves with T measured in older Americans, while Natsal-3 has one wave with T measured in a wide age range of adult Britons.
The present analysis is limited to male respondents because most propositions listed above apply to or are mostly reported for men and because men’s higher levels of T are easier to measure accurately. To nearly equate age ranges in the US and UK studies, the analysis is limited to British respondents age 57 years or older. Cultural US-UK differences in the early 21st century are ignored. For present purposes, the critical distinction between studies is their different methods of assaying salivary T: EIA in the American sample, LC-MS/MS in the British sample.
The American NSHAP used EIA to measure salivary testosterone
Salivary measures offer a relatively convenient and minimally-invasive approach for obtaining sex hormone data. Salivary T in men, whether measured by EIA, radioimmunoassay, or LC-MS/MS, is significantly correlated with free T and total T in serum [Citation52–54]. Saliva samples for NSHAP were collected at the time of interview, which was variable through the day. Respondents were asked to provide saliva by passive drool into a code-labeled polypropylene vial through a household plastic straw, following procedures recommended by Salimetrics, LLC (Carlsbad, CA 92008). Wave 1 specimens were transported from the interview to a freezer using cold packs, then stored in a freezer until shipped on dry ice to Salimetrics, which upon receipt stored them at −80 °C. On the day of assay, specimens were thawed completely, vortexed, and centrifuged. Clear samples were pipetted into wells. Salimetrics kits were used for enzyme immunoassay. Assay range ≥1.0 pg/ml. Intra-assay precision was determined from the mean of eight replicates at high and low T levels. The average intra-assay coefficient of variation was 3.3% and 6.7% for high and low levels. Inter-assay precision was determined from the mean of averaged duplicates for 10 separate runs at high and low testosterone levels. The average inter-assay coefficient of variation was 5.1% for high and 9.6% for low testosterone levels. Saliva samples were run in duplicate. Results for each subject were acceptable when the coefficient of variation (%CV) between the duplicates was <15%. In instances where the %CV between duplicates was >15%, results were accepted if the absolute value between result one and result two was <8 pg/ml. If these criteria were not met, saliva was assayed again. Values greater than the upper assay limit of 600 pg/ml were run on dilution to bring the readings within the accepted range. Procedures for Wave 2 were similar, including the use of Salimetrics EIA kits, however, these samples were shipped to Germany for assay by C. Kirschbaum at the University of Dusseldorf [Citation55–57].
For men, the correlation between the first two (i.e. duplicate) T values is r = 0.99 in Wave 1 and r = 0.97 in Wave 2 (both p < .001). Duplicates are averaged to establish each respondent’s mean T except when a duplicate is not recorded, in which case the one recorded value is taken as mean T. In Wave 1, six men are excluded because of implausibly high mean T (>1000 pg/ml).
The British Natsal-3 used LC-MS/MS to measure salivary testosterone
Natsal-3 obtained a usable saliva sample from 4128 British respondents (1675 men, 2453 women), who were instructed to provide a saliva sample before 10:00 am on the morning after their interview. They were asked not to brush their teeth, eat or chew before giving the sample, then drool into a polystyrene vial, and post the sample on the day of collection to the Department of Clinical Biochemistry, Glasgow Royal Infirmary (GRI), where they were prepared and frozen at −80 °C until analysis. Assays were performed at the Biochemistry Department at University Hospital South Manchester, using a newly developed and validated liquid chromatography-tandem mass spectrometry technique [Citation58].
NSHAP reports T levels in metric units, Natsal-3 in molar units. The conversion is 1 pmol/l = 0.3 pg/ml (https://www.menshormonalhealth.com/hormone-unit-conversion-calculator.html).
Variables
Beside T, the following variables available in NSHAP are listed in order of the propositions to be tested.
Diurnal: Time of day (24-hour clock) when saliva was collected is used to check diurnal rhythm of T.
Obesity: Three measures of obesity are used: body mass index (BMI), waist circumference, and interviewer’s rating of respondent’s body shape on a 4-point scale from thin to obese.
Age: Age at each wave is given in years.
Consistency across waves: Among men who provided usable T values for both waves, these allow between-wave correlation.
Sexuality: NSHAP contains several variables on sexuality, from which a subset was chosen with relatively high response rate and variability: How important is sex in your life? How often do you think about sex? How often do you masturbate? During the last 12 months, was there a period of several months…when you lacked interest in having sex? … when you were unable to climax? … when you had trouble getting or maintaining an erection? Married men only: In the past 12 months, how often did you have sex?
Diabetes: Hba1c and self-report of diabetes are recorded in each wave.
Mortality and morbidity: NSHAP records those respondents in Wave 1 who died before Wave 2. These may be compared to survivors, controlling on other risk factors. (Of 1454 men with T measured in the first wave, 231 died before Wave 2.) Also, each wave contains several measures of morbidity, in addition to Hba1c and diabetes, from which these offered good response, variability, and pertinence: Would you say your health is excellent, very good, good, fair, or poor? Has a medical doctor ever told you that you had a heart attack? Have you ever been treated for heart failure? Has a medical doctor ever told you that you have high blood pressure?
Statistics
Most results reported here for NSHAP come from regression models, including logistic regression when the dependent variable is dichotomous, with control variables where appropriate. Scatterplots are employed for some visual displays. Results are either cross-sectional, for each wave, or longitudinal.
Most propositions were first tested on 841 men who gave usable T in both waves. This produced unexpectedly few significant relationships by the common criterion of p = .05. As a cautionary step, propositions were tested again with samples enlarged by also including those men who gave usable T only on one wave. This increased sample sizes to 1454 men for Wave 1 and 1369 men for Wave 2. Of course, relationships were more likely to reach significance with these larger samples. It is worth emphasizing that correlations reaching significance with so many respondents may be slight in magnitude, having little substantive importance.
The distribution of T values is slightly skewed in Wave 1 (skew = 1.4) and considerably skewed in Wave 2 (skew = 6.3). A transformation to lnT corrected this for Wave 2 (skew = −0.1) while having little effect on Wave 1. Analyses were run with both T and lnT, usually with similar results. Occasionally a correlation reached significance with one but not the other, in which case it was treated as significant. The reason for these conservative judgements is to avoid dismissing previously-reported propositions as insignificant in NSHAP’s older men.
Statistical analyses for Natsal-3 were carried out using STATA (version 13.1) accounting for the complex survey design (stratification, clustering, and weighting of the sample). Two weights were applied: a survey weight correcting for unequal probability of selection and differential response (by age, sex, and region) to the survey itself, and an additional saliva weight correcting for unequal probability of selection and differential response to the saliva sample [Citation15]. Multivariable linear regression was used to assess associations with mean salivary T.
Results from NSHAP
compares basic characteristics for NSHAP (both waves) and Natsal-3 (all ages, and age 57+ years). Since the maximum age for Natsal-3 is 74 years, even restricting to men 57+ leaves the NSHAP men older. Of note is NSHAP’s relatively low sex ratio of T, one of the issues raised by critics of EIA assays [Citation2].
Table 1. Characteristics of respondents with usable salivary testosterone values in NSHAP (both waves) and Natsal-3 (all ages and 57+ years).
Results are reported in order of the seven propositions, beginning with the expectation that male T will show a diurnal rhythm, high in the morning, then declining through the day.
Diurnal: shows, for each wave, a scatterplot of T as a function of time of day when saliva was collected. The figure is based on 841 men with usable T on both waves. Visual inspection fails to show the expected diurnal variation, however, the correlation between lnT and time of sampling is significant in Wave 1: r = −0.21 (p < .001). Using the enlarged sample (including men with T in only a signal wave) produced consistently significant but very small correlations: r = −0.10 (p < .001) in Wave 1; r = −0.06 (p = .03) in Wave 2.
Obesity: Whether T declines with obesity was tested on three measures: BMI, waist circumference, and interview’s evaluation of the respondent’s body shape as thin to obese. Nearly all correlations were insignificant, except that lnT is significant if weakly correlated (inversely) to waist circumference, using the enlarged sample for Wave 1 (r = −0.06, p = .04).
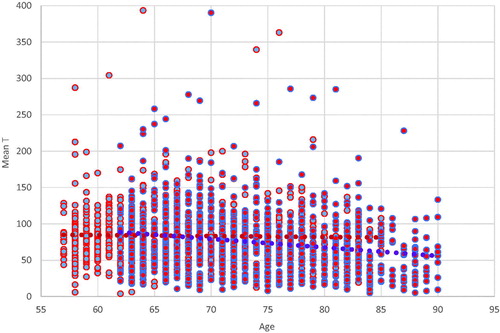
Age: shows, for each wave, a scatterplot of T as a function of age, for 841 men with T in both waves. Visually, there is no apparent decline with age in Wave 1 and a slight decline in Wave 2. This wave difference is corroborated by calculated correlations of T and age: insignificant in Wave 1; r = −0.20 (p < .001) in Wave 2. Using the enlarged samples, correlations are significant if weak in both waves: r = −0.08 (p = .01) for Wave 1; r = −0.15 (p < .001) for Wave 2.
Consistency across waves: Among the 841 men with T values measured in both waves, five years apart, the correlation between waves is r = 0.23 (p < .001) for lnT; and slightly weaker for untransformed T: r = 0.17 (p < .001).
Sexuality: Using enlarged samples, correlations in Wave 1 between T or lnT and all seven indicators of sexuality are insignificant, with or without controlling on age. In Wave 2, zero-order correlations are significant if small for importance of sex (r = 0.16, p < .001), thinks about sex (r = 0.10, p = .003), frequency of masturbation (r = 0.10, p < .001), and difficulty getting an erection (p = .01). Controlling on age lessens the strength and significance of these relationships. The remaining indicators of sexuality (frequency of sex, lack of interest in sex, difficulty reaching climax) are never significantly related to T. In sum, Wave 1 shows no relation between T and sexuality. Wave 2 shows significant but slight correlations with T and four of seven indicators of sexuality, which are diminished after controlling on age.
Diabetes: Even for the enlarged samples, correlations between T or lnT, on the one hand, and Hba1c or type 2 diabetes, on the other, do not approach significance in either wave. Controlling on age gives no improvement.
Mortality and morbidity: The relationship between T in Wave 1, and living or dying by Wave 2, was explored by controlling on several known risk factors: age, BMI, diagnosed diabetes, diagnosed hypertension, cigarette smoking, respondent’s self-rating of his physical health, and if respondent was aware of having heart failure. Neither T nor lnT approached significance in any of these logistic models. Unsurprisingly, when combined into a single model (n = 1139), those factors most significantly related to death were age, heart failure, self-rating of physical health (all p ≤ .001), and smoking (p = .02). BMI and diagnosis of either diabetes or hypertension approached significance (p < .1).
Figure 1. Mean T by Time of Day, for Waves 1 (Red) and 2 (Blue).
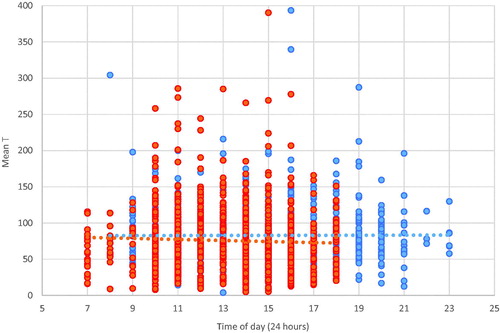
Figure 2. Mean T by Age, for Waves 1 (Red) and 2 (Blue).
Are NSHAP’s weak or null correlations due to inaccurate EIA values?
Welker et al. found measures of salivary T differed considerably across EIAs of three commonly used kit manufacturers [Citation2]. They also found notable differences between EIA values and those assayed by LC-MS/MS, an analytical technique noted for its specificity. EIA tends to inflate estimates of lower T concentrations in women; and EIA values for salivary T, while modestly correlated with serum levels for males, are less so for females [Citation52]. In women, circulating concentrations of T are typically around 5–10% of those in men [Citation59,Citation60]. However, EIA often gives sex ratios far lower. For example, the three EIA manufacturers used by [Citation2], Supplementary Table S3 gave sex ratios for salivary T at 2.4, 2.3, and 2.0, whereas the sex ratio given by their LC-MS/MS was 5.5.
Turning to the data used in this paper, in NSHAP, the male-to-female ratio as measured by EIA = 1.8 in both waves. In the Natsal-3 survey of Britons, the male-to-female ratio as measured by LC-MS/MS is about 6 for the full age range and nearly the same for respondents age 57 + [Citation61]. Comparing T in NSHAP with T in Natal-3 respondents age 57+ suggests that for men, EIA estimated mean T nearly two times higher than LC-MS/MS did. For women, EIA estimated mean T nearly six times higher than LC-MS/MS did. Calculations from Supplementary Table S3 of Welker et al. show the same pattern, though less extreme [Citation2]. That is, using LC-MS/MS as a standard, EIA estimates of mean T are over twice as high for women as for men. These results suggest that EIA has unrecognized cross-reactivity that may swamp the low T concentrations typical of females. Any such cross-reactivity would be less problematic for men with their higher T levels, but it may introduce sufficient error to obscure real correlations, disguising them as nulls. To evaluate this possibility, we test the above propositions, so far as possible, on British men aged 57+ years in the Natsal-3 data.
Results from NATSAL-3
Natsal-3 results are taken from published reports or from a special analysis of men aged 57 or older by one of us (SC). Values for salivary T were censored for very high levels so that, for each 10-year age group stratified by sex, values above the 99th percentile were assigned a value equal to that of the 99th percentile. T data for men were normally distributed.
Not all propositions can be tested with Natsal-3 data for lack of suitable variables, but results that can be tested are given here in order.
Diurnal: No opportunity to test this among older men.
Obesity: T was inversely related to obesity in men of all ages, including those age 55–74 years, though the difference between obese and normal men lessened with increasing age ( [Citation15].
Age: British men aged 55–64 years had mean T of 52.4 pg/ml, while those aged 65–74 had mean T = 45.5 pg/ml. This decadal decline of 6.9 pg/ml is significant (p < .001), and in magnitude is about three-fourths the decadal decline found through most of the adult age range ( and ) [Citation15].
Consistency across waves: No opportunity to test.
Sexuality: Results currently held confidential by the Natsal-3 team and therefore not available.
Diabetes: An age-adjusted association of T with self-reported diabetes for men approached significance (p = .09) but this did not persist after adjusting for other confounding factors including BMI.
Morbidity: No opportunity to test mortality against T. Salivary T was associated, independently of age, with a range of measures of general health in men. Cardiovascular disease (including hypertension) was significantly associated with lower mean T in men, independently of age. There was weak evidence of an association between lower T and having a long-standing illness or disability (p = .07) and strong evidence of an association between lower salivary T and having 2 or more comorbid health conditions (p = .01), though no association between mean sal-T and self-reported general health.
Discussion
At its outset, the sole concern of this project was to test if previously reported correlations between male T and other variables held true among older men. Only NSHAP data were to be used. Surprisingly, expected correlations were found to be null or, if significant, weak in strength. Even solidly established declines in T – with weight, with age, with time of day – barely appear in NSHAP data. At first, these null or meager correlations seemed to support the important conclusion that in older men, T no longer works as it does in younger men.
But a methodological objection to this interpretation was that EIA measurement of salivary T is insufficiently accurate to detect relationships that really do exist [Citation2]. This possibility seemed increasingly plausible after we compared the sex ratio of salivary T in NSHAP (less than 2) with the sex ratio of salivary T for older Britons in Natsal-3 (about 6). The NSHAP ratio is too low, the Natsal-3 ratio about right. It seemed advisable to extend our original project, testing those correlations we took from the literature among older British men in Natsal-3 whose salivary T was measured by mass spectrometry, noted for its specificity. Not all seven correlations could be tested, either because relevant variables were not measured among the British men, or indicators of sexuality that were measured are still being analyzed by the British team and therefore unavailable to us.
We do replicate relationships of T with age, obesity, and health among older British men, as previously reported in the literature. This difference in results, successful replication with Natsal-3 but not with NSHAP, throws doubt on the adequacy of EIA for measuring salivary T in NSHAP. The lack of a diurnal decline in T among NSHAP men was especially surprising because it has been reported so often. The timing of saliva sampling was dictated by the times of interviews, which varied throughout the day. Possibly there were extraneous but unknown differences between men interviewed in the morning and those interviewed later in the day.
The major shortcoming of our criticism of EIA is that the two assay methods were used on different samples. Obviously, a stronger test would have used both assays on the same sample, but we had to use such surveys as were available. We believe that corroborating important correlations in a sample using LC-MS/MS, but not finding them in a sample using EIA, is important circumstantial evidence of the inaccuracy of EIA for salivary testosterone. In 2013, the Journal of Clinical Endocrinology and Metabolism considered a requirement for mass spectrometry sex steroid assays [62], although an explicit ban on enzyme immunoassay of sex steroids is not presently in place. Nonetheless, this indicated the disquiet among researchers about EIA measurements of sex steroids and their unreliable findings.
The existing literature on social neuroendocrinology in humans is rife with inconsistent findings regarding testosterone [63]. In recent decades these reports have depended increasingly on EIA. In view of evidence for the inadequacy of these assays, it is time for a review of past work, flagging results dependent on EIA for possible distortions they may have introduced into the literature. We may need to go back to square one.
Disclosure statement
No potential conflict of interest was reported by the authors.
References
- Diamanti-Kandarakis E, Dattilo M, Macut D, et al. Aging and anti-aging: a comboendocrinology overview. Eur J Endocrinol. 2017;176:R283–R308.
- Welker K, Lassetter B, Brandes C, et al. A comparison of salivary testosterone measurement using immunoassays and tandem mass spectrometry. Psychoneuroendocrinology. 2016;71:180–188.
- Dabbs J. Jr. Salivary testosterone measurements: reliability across hours, days, and weeks. Physiology & Behavior. 1990;48:83–86.
- Wittert G. The relationship between sleep disorders and testosterone. Curr Opin Endocrinol Diabetes Obes. 2014;21:239–243.
- Luboshitzky R, Shen-Orr Z, Herer P. Middle-aged men secrete less testosterone at night than young healthy men. J Clin Endocrinol Metab. 2003;88:3160–3166.
- Derby CA, Zilber S, Brambilla D, et al. Body mass index, waist circumference and waist to hip ratio and change in sex steroid hormones: the Massachusetts Male Ageing Study. Clin Endocrinol. 2006;65:125–131.
- Haring R, Ittermann T, Völzke H, et al. Prevalence, incidence and risk factors of testosterone deficiency in a population-based cohort of men: results from the study of health in Pomerania. Aging Male. 2010;13:247–257.
- Wu F, Tajar A, Pye S, et al. Hypothalamic-pituitarytesticular axis disruptions in older men are differentially linked to age and modifiable risk factors: The European male aging study. J Clin Endocrin Metab. 2008;93:2737–2745.
- Kim Y, Hong D, Lee D, et al. Total testosterone may not decline with ageing in Korean men aged 40 years or older. Oxf Bull Econ Stat. 2012;77:296–301.
- Camacho E, Huhtaniemi I, O’Neil T, et al. Age-associated changes in hypothalamic–pituitary–testicular function in middle-aged and older men are modified by weight change and lifestyle factors: longitudinal results from the European Male Ageing Study. Eur J Endocrinol. 2013;168:445–455.
- Kaplan SA, Lee JY, O’Neill EA, et al. Prevalence of low testosterone and its relationship to body mass index in older men with lower urinary tract symptoms associated with benign prostatic hyperplasia. Aging Male. 2013;16:169–172.
- Shi Z, Araujo A, Martin S, et al. Longitudinal changes in testosterone over five years in community-dwelling men. J Clin Endocrinol Metab. 2013;98:3289–3297.
- Bann D, Wu F, Keevil B, et al. Changes in testosterone related to body composition in late midlife: findings from the 1946 British birth cohort study. Obesity. 2015;23:1486–1492.
- Saad F, Yassin A, Doros G, et al. Effects of long-term treatment with testosterone on weight and waist size in 411 hypogonadal men with obesity classes I-III: observational data from two registry studies. Int J Obes. 2016;40:162–170.
- Clifton S, Macdowall W, Copas A, et al. Salivary testosterone levels and health status in men and women in the British general population: findings from the Third National Survey of Sexual Attitudes and Lifestyles (Natsal-3). J Clin Endocrinol Metab. 2016;101:3939–3951.
- Yassin A, Nettleship JE, Talib RA, et al. Effects of testosterone replacement therapy withdrawal and re-treatment in hypogonadal elderly men upon obesity, voiding function and prostate safety parameters. Aging Male. 2016;19:64–69.
- Salman M, Yassin DJ, Shoukfeh H, et al. Early weight loss predicts the reduction of obesity in men with erectile dysfunction and hypogonadism undergoing long-term testosterone replacement therapy. Aging Male. 2017;20:45–48.
- Vermeulen A, Goemaere S, Kaufman J. Testosterone, body compositionand aging. J Endocrinol Invest. 1999;22(Suppl):110–116.
- Travison T, Araujo A, O’Donnell A, et al. A population-level decline in serum testosterone levels in American men. J Clin Endocrinol Metab. 2006;92:196–202.
- Andersson A, Jensen T, Juul A, et al. Secular decline in male testosterone and sex hormone binding globulin serum levels in Danish population surveys. J Clin Endoc Metab. 2007;92:4696–4705.
- Liu PY, Beilin J, Meier C, et al. Age-related changes in serum testosterone and sex hormone binding globulin in Australian men: longitudinal analyses of two geographically separate regional cohorts. J Clin Endocrinol Metab. 2007;92:3599–3603.
- Mazur A. The age-testosterone relationship in Black, White and Mexican-American men, and reasons for ethnic differences. Aging Male. 2009;12:66–76.
- Yeap B, Araujo AB, Wittert GA. Do low testosterone levels contribute to ill-health during male ageing? Cri Rev Clin Lab Sci. 2012;49:168–182.
- Corona G, Rastrelli G, Morgentaler A, et al. Meta-analysis of results of testosterone therapy on sexual function based on international index of erectile function scores. Eur Urol. 2017;72:1000–1011.
- Rizk PJ, Kohn TP, Pastuszak AW, et al. Testosterone therapy improves erectile function and libido in hypogonadal men. Curr Opin Urol. 2017;27:511–515.
- Rosen RC, Wu F, Behre HM, et al. Quality of life and sexual function benefits of long-term testosterone treatment: longitudinal results from the registry of hypogonadism in men (rhyme. J Sex Med. 2017;14:1104–1115.
- Ajo R, Segura A, Mira L. The relationship of salivary testosterone and male sexual dysfunction in opioid-associated androgen deficiency (OPIAD). Aging Male. 2017;20:1–8.
- Almehmadi Y, Yassin DJ, Yassin AA. Erectile dysfunction is a prognostic indicator of comorbidities in men with late onset hypogonadism. Aging Male. 2015;18:186–194.
- Trinick TR, Feneley MR, Welford H, et al. International web survey shows high prevalence of symptomatic testosterone deficiency in men. Aging Male. 2011;14:10–15.
- La Vignera S, Condorelli R, Vicari E, et al. Original immunophenotype of blood endothelial progenitor cells and microparticles in patients with isolated arterial erectile dysfunction and late onset hypogonadism: effects of androgen replacement therapy. Aging Male. 2011;14:183–189.
- Aslan Y, Guzel O, Balci M, et al. The impact of metabolic syndrome on serum total testosterone level in patients with erectile dysfunction. Aging Male. 2014;17:76–80.
- Carruthers M, Cathcart P, Feneley MR. Evolution of testosterone treatment over 25 years: symptom responses, endocrine profiles and cardiovascular changes. Aging Male. 2015;18:217–227.
- Shigehara K, Konaka H, Ijima M, et al. The correlation between highly sensitive C-reactive protein levels and erectile function among men with late-onset hypogonadism. Aging Male. 2016;19:239–243.
- Kulej-Lyko K, Majda J, von Haehling S, et al. Could gonadal and adrenal androgen deficiencies contribute to the depressive symptoms in men with systolic heart failure? Aging Male. 2016;19:221–230.
- Wolf J, Keipert D, Motazedi H, et al. Effectiveness and tolerability of parenteral testosterone undecanoate: a post-marketing surveillance study. Aging Male. 2017;20:225–234.
- Kaya E, Sikka SC, Kadowitz PJ, et al. Aging and sexual health: getting to the problem. Aging Male. 2017;20:65–80.
- Panach-Navarrete J, Martínez-Jabaloyas JM, DE-SDT study group. The influence of comorbidities on the aging males’ symptoms scale in patients with erectile dysfunction. Aging Male. 2017;20:146–152.
- Handelsman DJ. Testosterone and male aging: faltering hope for rejuvenation. JAMA. 2017;317:699–701.
- Finkle WD, Greenland S, Ridgeway GK, et al. Increased risk of non-fatal myocardial infarction following testosterone therapy prescription in men. PLoS ONE 2014;9:e85805.
- Vigen R, O’Donnell C, Barón A, et al. Association of testosterone therapy with mortality, myocardial infarction, and stroke in men with low testosterone levels. JAMA. 2013;310:1829–1836.
- Araujo A, Dixon J, Suarez E, et al. Clinical review: endogenous testosterone and mortality in men: a systematic review and metaanalysis. J Clin Endocrinol Metab. 2011;96:3007–3019.
- Shores MM, Smith NL, Forsberg CW, et al. Testosterone treatment and mortality in men with low testosterone levels. J Clin Endocrinol Metab. 2012;97:2050–2058.
- Blaya R, Thomaz LD, Guilhermano F, et al. Total testosterone levels are correlated to metabolic syndrome components. Aging Male. 2016;19:85–89.
- Pastuszak AW, Kohn TP, Estis J, et al. Low plasma testosterone is associated with elevated cardiovascular disease biomarkers. J Sex Med. 2017;14:1095–1103.
- Selvin E, Feinleib M, Zhang L, et al. Androgens and diabetes in men: results from the Third National Health and Nutrition Examination Survey (NHANES III). Diabetes Care. 2007;30:234–238.
- Haider A, Yassin A, Doros G, et al. Effects of long-term testosterone therapy on patients with “diabesity’’: results of observational studies of pooled analyses in obese hypogonadal men with type 2 diabetes. Int J Endocrinol. 2014;2014:683515.
- Yassin DJ, Doros G, Hammerer PG, et al. Long-term testosterone treatment in elderly men with hypogonadism and erectile dysfunction reduces obesity parameters and improves metabolic syndrome and health-related quality of life. J Sex Med. 2014;11:1567–1576.
- Mazur A, Westerman R, Mueller U. Is rising obesity causing a secular (age-independent) decline in testosterone among American men? PLoSONE. 2013;8:e76178.
- Saad F, Yassin A, Almehmadi Y, et al. Effects of long-term testosterone replacement therapy, with a temporary intermission, on glycemic control of nine hypogonadal men with type 1 diabetes mellitus - a series of case reports. Aging Male. 2015;18:164–168.
- Erens B, Phelps A, Clifton S, et al. Methodology of the third British National Survey of Sexual Attitudes and Lifestyles (Natsal-3). Sex Transm Infect. 2014;90:84–89.
- Waite LJ, EO, Laumann W, Levinson ST, et al. 2007. National Social Life, Health, and Aging Project (NSHAP). ICPSR20541-v1. Chicago, IL: National Opinion Research Center.
- Shirtcliff EA, Granger DA, Likos A, et al. Gender differences in the validity of testosterone measured in saliva by immunoassay. Horm Behav. 2002;42:62–69.
- Keevil BG, MacDonald P, Macdowall W, et al. Salivary testosterone measurement by liquid chromatography tandem mass spectrometry in adult males and females. Ann Clin Biochem Int J Biochem Lab Med. 2014;51:368–378.
- Fiers T, Delanghe J, T'Sjoen G, et al. A critical evaluation of salivary testosterone as a method for the assessment of serum testosterone. Steroids. 2014;86:5–9.
- Mendoza K, MJ, Curran, ST. Lindau 2007. [internet] Salivary Testosterone Measurement in Wave I of the National Social Life, Health and Aging Project (NSHAP). Chicago Core on Biomarkers in Population-Based Aging Research. [cited 2007 Dec 17]. Available from: http://biomarkers.uchicago.edu/pdfs/TR-Testosterone.pdf
- Gavrilova N, Lindau S. Salivary sex hormone measurement in a national, population-based study of older adults. J Gerontol B. 2009;64B:i94–i105.
- Kozloski M, Schumm L, McClintock M. The utility and dynamics of Salivary sex hormone measurements in the national social life, health, and aging project, wave 2. J Gerontol B Psychol Sci Soc Sci. 2014;69:S215–S228.
- Macdonald P, Owen L, Wu F, et al. A liquid chromatography–tandem mass spectrometry method for salivary testosterone with adult male reference interval determination. Clin Chem. 2011;57:774–775.
- Haring R, Hannemann A, John U, et al. Age-specific reference ranges for serum testosterone and androstenedione concentrations in women measured by liquid chromatography-tandem mass spectrometry. J Clin Endocrinol Metab. 2012;97:408–415.
- Davison L, Bell R, Donath S, et al. Androgen levels in adult females: changes with age, menopause, and oophorectomy. J Clin Endocrinol Metab. 2005;90:3847–3853.
- Keevil B, Clifton S, Tanton C, et al. Distribution of salivary testosterone in men and women in a British general population-based sample: the Third National Survey of Sexual Attitudes and Lifestyles (Natsal-3). J Endocrine Society. 2017;1:14–25.
- Handelsman D, Wartofsky L. Requirement for mass spectrometry sex steroid assays in the Journal of Clinical Endocrinology and Metabolism. J Clin Endocrinol Metab. 2013;98:3971–3973.
- Mazur A. History of Biobehavioral Endocrinology in Humans. In: P. Mehta and O. Schultheiss, editors. International Handbook of Social Neuroendocrinology. London: Routledge; 2018.