
Abstract
Background
Metabolic dysfunction and obesity are closely related to chronic kidney disease (CKD). However, studies on the relationship between various metabolic syndrome-body mass index (MetS-BMI) phenotypes and the risk of CKD in the Chinese population have not yet been explored.
Materials and methods
Data from the China Health and Retirement Longitudinal Study (CHARLS) 2015 were analyzed in this study. This study enrolled 12,054 participants. Participants were divided into six distinct groups according to their MetS-BMI status. Across the different MetS-BMI groups, the odd ratios (ORs) for CKD were determined using multivariable logistic regression models.
Results
The prevalence of CKD was higher in metabolically unhealthy groups than in the corresponding healthy groups. Moreover, the fully adjusted model showed that all metabolically unhealthy individuals had an increased risk of developing CKD compared to the metabolically healthy normal weight group (OR = 1.62, p = 0.002 for the metabolically unhealthy normal weight group; OR = 1.55, p < 0.001 for the metabolically unhealthy overweight group; and OR = 1.77, p < 0.001 for the metabolically unhealthy obesity group.
Conclusions
This study is the first to evaluate the relationship between the MetS-BMI phenotype and renal prognosis in the Chinese population. Individuals with normal weights are at different risk of developing CKD depending on their different metabolic phenotypes.
1. Introduction
Several diseases, including glomerulonephritis, can cause chronic kidney disease (CKD), which damages renal function irreversibly over months or years [Citation1,Citation2]. Currently, there are several CKD diagnostic criteria. Kidney damage or an estimated glomerular filtration rate (eGFR) of less than 60 mL.min− 1/1.73 m2, or both, for at least 3 months, are considered part of the widely accepted definition of CKD [Citation1]. CKD can increase the risk of anemia [Citation3,Citation4], bone disease [Citation5], cardiovascular disease [Citation6], and cancer [Citation7,Citation8], which can have a significant financial impact on societies worldwide. Thus, identifying modifiable risk factors for CKD is crucial for clinical and communal health and may alleviate the burden of CKD. Diabetes and hypertension are the two leading causes of CKD [Citation1]. Fasting plasma glucose (FPG), systolic blood pressure (SBP), and body mass index (BMI) have emerged as the primary metabolic markers for determining the risk of CKD in recent years [Citation9]. High BMI raises the risk of developing CKD because of the higher risk of cardiovascular disease, hypertension, and diabetes [Citation10,Citation11]. However, it is yet unknown if a higher BMI independently influences the risk of CKD.
A growing body of research suggests that the onset and progression of CKD are significantly correlated with metabolic syndrome (MetS) [Citation12,Citation13]. Hypertension, central obesity, impaired glucose metabolism, and dyslipidemia (abnormal lipid levels) are the hallmarks of MetS [Citation14,Citation15]. First, MetS is crucial for the onset of CKD. In addition to inducing inflammation, oxidative stress, and impaired kidney function, insulin resistance is a key component of MetS. Furthermore, obesity can induce inflammation and fibrosis, increasing glomerular volume, podocyte hypertrophy, and mesangial stroma expansion. Triglycerides (TGs) and free fatty acids (FFAs) promote kidney injury through an inflammatory response. Patients with hypertension have increased angiotensin II, leading to oxidative stress, ischemia, and renal microvascular damage. Inhibiting the production of nitric oxide, hyperuricemia promotes CKD. Second, CKD progression is accelerated by common risk factors for MetS and CKD. Obesity-associated glomerular hyperfiltration may accelerate glomerular sclerosis and glomerular hyperfiltration caused by CKD. As blood pressure, TG, and insulin resistance deteriorate with CKD, CKD results from these conditions. Insulin resistance exacerbates renal hemodynamics by obstructing ion transport. Hemodynamics are affected, exacerbating CKD as hypertension worsens and the sympathetic nervous system gets active [Citation16].
An indicator of the risk of CKD is waist circumference (WC), which is also a predictor of visceral body fat. Additionally, the onset of CKD is associated with TGs, one of the key components of the MetS. Moreover, a combined analysis of TG and WC revealed that patients with abnormal single factors had a lower risk of CKD than those with high WC and TG content [Citation17]. Importantly, there is an association between MetS and obesity or excess weight, and MetS frequently acts as a mediator between the deleterious impact of obesity on disease progression [Citation18,Citation19]. Different subgroups of obese populations may have different risks for CKD, such as those who are obese but still metabolically healthy. Understanding the pathophysiology of metabolic dysfunction and the risk of CKD is aided by detailed metabolic phenotyping of obesity. Several research studies have found divergent findings regarding the impact of MetS-BMI phenotypes on CKD [Citation20,Citation21]. The association between metabolically healthy overweight/obesity (MHOW/MHO) and the risk of CKD in the Chinese population is also the subject of limited investigation. To analyze their association with CKD risk, we consequently combined the MetS and obesity phenotypes. MetS-BMI phenotypes and the risk of CKD in the Chinese population are being analyzed for the first time using a large-scale national data sample.
2. Material and methods
2.1. Study design and participants
A dataset from the China Health and Retirement Longitudinal Study (CHARLS), a longitudinal project focused on the aging population, was used in this study. CHARLS is an ongoing survey initiated in 2011, and the included participants were followed up in 2013, 2015, and 2018. The dataset offers demographic, clinical, and lifestyle data that allow researchers to investigate the relationships between different factors and the progression of CKD.
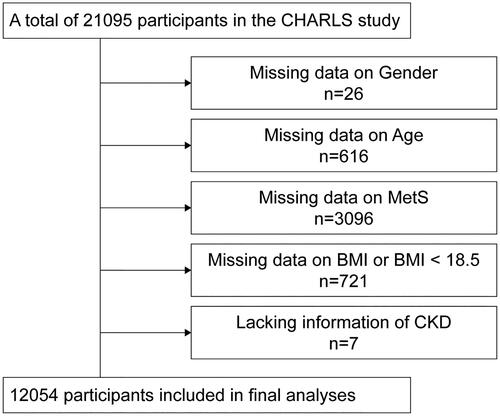
The CHARLS survey used the probability-proportional-to-size sampling technique to randomly select 150 county-level units from 28 provinces and autonomous regions (excluding Tibet) in mainland China. Then same method was used to select primary sampling units (villages or communities) within each county unit. Individuals older than 45 years were included in the survey. A total of 10,257 households were interviewed, and the final response rate was 80.5%. Previous studies have provided detailed reports on the design and methods of CHARLS [Citation22]. Our samples were from 20,453 participants in the 2015 CHARLS database. Excluded from our study were those with missing values for age (n = 616), sex (n = 26), MetS (n = 3096), and CKD (n = 7). Furthermore, those lacking BMI information (n = 4575) or having less than 18.5 kg/m2 (n = 721) were excluded from the analyses. After the dataset was cleaned, 12,054 individuals were still included in the baseline survey (). The Peking University Review Committee (IRB 00001052–11014) approved the study, which was conducted following the Declaration of Helsinki. Each participant gave their informed consent for their participation.
Figure 1. Flow chart of data cleansing. MetS: metabolic syndrome; BMI: body mass index; CKD: chronic kidney disease; CHARLS: China Health and Retirement Longitudinal Study.
2.2. Data collection (covariates)
A standardized questionnaire survey was used to gather baseline data on age, sex, marital status (married/cohabitated or others), smoking and drinking habits, depression, and sleeping time. A lifetime of at least 100 cigarettes smoked was considered smoking [Citation23]. There were three categories for smoking status: current smoker, non-smoker, or ex-smoker. And, participants were asked, “Did you drink any alcoholic beverages, such as beer, wine, or liquor in the past year? How often?” Their answers will be selected from the following options. 1. Drink more than once a month. 2. Drink but less than once a month. 3. None of these. Drinking was reported as never drinking, drinking less than once a month, or drinking more than once a month. There were four categories for age: 40–50 years, 50–60 years, 60–70 years, and >70 years. There were three categories for sleep: <6 h, 6–8 h, and >8 h [Citation19]. Depression was diagnosed in individuals who scored higher than 10 on the Center for Epidemiologic Studies Depression Scale (CESD-10) [Citation24]. The costal margin of the central axilla and iliac crest were used to quantify WC. After at least 5 min of rest, blood pressure was measured with a mercury sphygmomanometer, and the average of three measurements was recorded for each participant [Citation12].
Blood samples were taken following a minimum of 10-h overnight fast. The standard protocol was followed to assess the levels of high-density lipoprotein (HDL), low-density lipoprotein (LDL), glucose, uric acid, creatinine, total cholesterol (TC), TG, and C-reactive protein [Citation25]. Trained medical personnel performed all operations and recordings.
2.3. Evaluation of CKD and MetS-BMI phenotypes
An eGFR < 60 (mL/min/1.73 m2) was used to identify CKD in our study. A previously reported method was used to determine the eGFR [Citation1]. Based on BMI and MetS, participants were classified into six different and mutually exclusive groups: metabolically healthy normal weight/overweight/obesity (MHN/MHOW/MHO) and metabolically unhealthy normal weight/overweight/obesity (MUN/MUOW/MUO) [Citation26].
Currently, there are several global definitions in use, including those from the National Cholesterol Education/Adult Treatment Panel III (NCEP-ATPIII) [Citation27], the World Health Organization (WHO) [Citation28], the International Diabetes Federation (IDF) [Citation29], and others. Nonetheless, the IDF definition considers the ethnic characteristics of Chinese individuals. Early detection and intervention are made more accessible by the IDF definition’s more sensitive WC threshold than by other definitions. Thus, the IDF definition for MetS was used in this study, which requires the presence of two or more of the following criteria in addition to abdominal obesity (male WC ≥ 90 cm, female WC ≥ 80 cm): hyperglycemia, high blood TGs, low HDL, and hypertension [Citation19]. The precise cut-off values for MetS were as previously described [Citation19]. A person’s weight in kilograms divided by their height in meters yielded their BMI. Height and weight were measured by the trained investigators with standardized equipment (Index: height; Equipment: SecaTM213 Stadiometer Manufacturer/source: China Seca (Hangzhou) Co., Ltd. Index: weight; Equipment: OmronTMHN-286Scale Manufacturer/source: Krill Technology (Yangzhou) Co., Ltd.) [Citation30]. The Chinese Working Group on Obesity has proposed three classifications for obesity: normal weight (18.5 ≤ BMI < 24.0 kg/m2), overweight (24.0 ≤ BMI < 28.0 kg/m2), and obesity (BMI ≥ 28.0 kg/m2) [Citation31].
2.4. Statistical analyses
Normally distributed continuous variables are shown as mean ± standard deviation (SD), whereas non-normally distributed continuous variables are shown as median (25th–75th percentile). Percentages were used to summarize categorical data. For continuous data, one-way analysis of variance (ANOVA) was used, and for categorical data, the chi-square test was used to compare the baseline characteristics. A series of logistic regression models were constructed to compute the 95% confidence interval (CI) and odds ratio (OR) to investigate the relationships between BMI, MetS phenotypes, and the potential risks of CKD.
It is well known that age and gender affect the outcome of CKD. In recent years, the influence of lifestyle, such as alcohol and cigarette consumption [Citation32,Citation33], and sleep duration [Citation34] on CKD has gradually been recognized. Interestingly, research confirms that married people have a lower risk of CKD than unmarried people [Citation35]. And, unmarried people are more likely to move from advanced CKD to kidney failure than married people [Citation35]. Besides, depression has been demonstrated to accelerate renal dysfunction and increase hospitalization rates in patients with CKD [Citation36]. Several Mendelian randomization studies have reported significant causal effects of lipid levels (LDL, TC) on CKD or renal function [Citation37]. In summary, in view of the complex effects of the above covariates on the outcome of CKD, we conducted a logistic regression analysis to adjust them. Model 1 was a crude model. Model 2 was adjusted for age, sex, marital status, and sleep duration. Model 3 was further adjusted for smoking status, alcohol consumption, and depression status. Model 4 was also adjusted for TC and LDL levels.
STATA version 17.0 (Stata Corporation, College Station, TX) was used for all statistical analyses. A two-tailed probability value with a two-tailed probability value of p < 0.05 was considered statistically significant.
3. Results
3.1. Baseline characteristics of the study participants
The baseline characteristics of the participants, grouped based on the MetS-BMI phenotypes, are displayed in . Participants in the 2015 CHARLS survey, numbering 12,054, were gathered for the research. Of these, 6070 were of normal weight, 4255 were overweight, and 1729 were obese. Of all participants, those who were metabolically unhealthy made up 36.00% (n = 4339), and those who were metabolically healthy made up 64.00% (n = 7715). Furthermore, among all participants, 35.30% and 14.34% were classified as overweight and obese, respectively. The MHOW subgroup comprised 48.11% of overweight people and 16.98% of all enrolled participants. While, the metabolically healthy obesity (MHO) subgroup made up 4.00% of all registered participants and 27.88% of obese people.
Table 1. Baseline characteristics of included participants in CHARLS 2015.
In addition, metabolically unhealthy individuals had lower HDL levels and higher blood pressure, glucose, TC, and WC levels than metabolically healthy people.
3.2. The cross-sectional association between MetS-BMI phenotypes and prevalent CKD
displays the prevalence of CKD according to the MetS-BMI phenotypes. The MHN, MHOW, MHO, MUN, MUOW, and MUO cohorts had crude prevalence rates of CKD of 4.43%, 4.40%, 2.70%, 8.26%, 5.93%, and 6.01%, respectively. People who were classified as metabolically unhealthy had a higher prevalence of CKD than people who were classified as metabolically healthy, regardless of their BMI.
Table 2. Prevalence of chronic kidney disease classified by MetS-BMI phenotypes.
The association between MetS-BMI phenotypes and CKD risk is shown in . All regression models showed that those with metabolically healthy status did not have an elevated risk of CKD, regardless of their BMI (all p > 0.05). For groups represented by MHOW, MHO, MUN, MUOW, and MUO in model 4, the odd ratios (ORs) of developing CKD were 1.27 (95% CI = 0.98–1.67, p = 0.069), 1.06 (95% CI = 0.59–1.89, p = 0.850), 1.62 (95% CI = 1.19–2.21, p = 0.002), 1.55 (95% CI =1.21–1.97, p < 0.001), and 1.77 (95% CI = 1.33–2.37, p < 0.001), respectively. Crucially, the ORs for those with a metabolically unhealthy status were constantly higher than those for people with a metabolically healthy status across all models. People in the MUO group were more likely to develop CKD than people in the MUN group in models 2–4. This suggests that among populations that are metabolically unhealthy, those who are obese have a more significant chance of developing CKD than people who are normal weight.
Table 3. Association between MetS-BMI phenotypes and risk of CKD.
4. Discussion
The risk of CKD did not significantly differ between BMI levels within any metabolically healthy category, according to the current investigation. Nevertheless, regardless of their BMI categories, all of the metabolically unhealthy subgroups showed increased odds of developing CKD in comparison to those who were metabolically healthy. Moreover, of all the adjusted groups, those with MUO had the highest chance of developing CKD.
A growing body of research indicates that being overweight or obese increases the chance of developing CKD [Citation20,Citation38,Citation39]. Nevertheless, MetS, rather than obesity, is a risk factor for the accelerated age-related reduction in glomerular filtration rate (GFR) in the general population, according to a community-based study comprising 1261 middle-aged Norwegian adults [Citation21]. Differences in race, sample size, or definition of MetS can all contribute to the different results. The incidence of MetS is much higher in those who are overweight or obese [Citation18,Citation25]. It is now widely known that obesity and metabolic abnormalities may negatively impact renal structure and function either separately or in combination, resulting in decreased GFR and increased urine microalbumin levels [Citation13,Citation20,Citation38,Citation40,Citation41]. However, it is sometimes ignored that certain MetS patients who maintain a normal BMI also have a higher risk of developing CKD. Thus, evaluating the risk of CKD in groups with distinct MetS-BMI phenotypes can provide fresh perspectives on the impact of metabolic status on the onset of CKD at different body weights.
Although the exact mechanisms underlying the correlation between metabolic abnormalities and CKD are not fully understood, several plausible explanations could explain this association. Insulin resistance, a key factor in MetS, can trigger sodium and water retention, and vascular endothelial constriction. This then causes lipids to build up in the renal tubules and the renin-angiotensin-aldosterone system (RAAS) to become activated, damaging the kidneys and speeding up the course of CKD [Citation42,Citation43]. Furthermore, structural and functional problems in the kidneys may arise from altered hemodynamics, aberrant lipid metabolism, hormonal response disorders, and ectopic lipid buildup in obese individuals [Citation44–46]. The main pathogenic variables driving MetS-associated CKD include insulin resistance, obesity, hypertension, aberrant lipid levels, inflammation, oxidative stress, and decreased endothelial function [Citation13].
According to our research, there was no discernible difference in the prevalence of CKD between the MHO and MHN groups. Our research and other data show that, in healthy persons, weight gain does not significantly predict the development of CKD, regardless of cardiovascular disease, diabetes, obesity-related glomerular disease, or other underlying causes [Citation21]. This may be explained by the fact that those with MHO have fewer metabolic abnormalities and comparatively normal insulin sensitivity [Citation47]. Nevertheless, other data indicates that MHO is not a lifelong illness since between 30 and 50% of those who were first diagnosed with MHO were later shown to have transitioned to an unhealthy metabolic state [Citation48–50]. Weight loss in those with MHO may also be advantageous for the advancement of CKD. Our findings are consistent with earlier research [Citation51], which indicates that people with aberrant metabolic status have a markedly increased risk of developing CKD even if they maintain a normal weight. This supports the earlier opinion that metabolic status is a valuable marker for determining who is at risk for CKD [Citation21,Citation51]. Moreover, according to our research, the MUO and MHO subcategories had significantly different chances of getting CKD. It seems that those who have MUO are most at risk of developing CKD. One possible explanation for this discrepancy could be that MUO patients have more visceral fat and less subcutaneous adipose tissue expansion than MHO patients [Citation52]. Interestingly, compared to MUN, the OR value of MUOW was significantly lower, presumably due to bias brought on by the small number of MUN samples in the population. However, among overweight and obese individuals, restoring a balanced metabolic pattern is still the most essential way to prevent CKD. Furthermore, our research suggested that when evaluating metabolic status and obesity in the clinical assessment of CKD risk, they should be done together.
Recently, Kathleen E. Adair et al. [Citation53] also conducted a similar study to ours. However, in their study, the researchers overlooked the overweight group, people whose BMI did not meet the criteria for obesity but are at great risk of becoming obese. In our study, we categorized weight into more nuanced categories: normal, overweight, and obese. On the other hand, the definition of MetS in their study was NCEP-ATPIII, while the diagnostic criteria we used (IDF) considered the WC characteristics of different nationalities, which is more suitable for the Chinese population. In addition, participants in Kathleen E. Adair’s study were all from areas of low socioeconomic status. However, our participants are from both urban and rural areas across the country. Taken together, our research implemented a more detailed classification of BMI, a more precise diagnosis of MetS, and a more balanced distribution of participants across varying geographical locations, all of which contributed to the attainment of relatively comprehensive and accurate results.
There were various shortcomings in our study. First, being a cross-sectional study, it was unable to establish a causal association between MetS-BMI phenotypes and CKD. Longitudinal studies and randomized controlled trials are needed to determine the effectiveness and causation of these interventions. Second, the predictive value of MetS-BMI for CKD risk may be influenced by other confounding variables that are unknown or unmeasured, as our analysis only controlled for partial confounders. For some covariates, such as drinking, we could only stratify the analysis by month through the CHARLS questionnaire, which affects the accuracy of the results. Furthermore, a few covariates mostly rely on self-reporting, which may introduce subjective elements and lower the reliability of the conclusions. Lastly, the majority of the participants in our research were middle-aged or elderly. The results of our study may not apply to young adults and people of different races because the prevalence of CKD can differ depending on age and ethnicity.
5. Conclusion
Our research suggests that, apart from obesity, metabolic abnormalities are a significant risk factor for CKD in the Chinese population. Evaluation of metabolic phenotypes is important for identifying high-risk individuals or subgroups, which optimizes strategies for preventing CKD.
Ethical statements
Ethical review and approval were waived for this study, and all data from CHARLS were publicly accessible (http://charls.pku.edu.cn/). Informed consent was obtained from all the participants in the original study.
Authors’ contributions
S.Y. performed the data analyses and wrote the manuscript; S.Z. and J.L. analyzed all data; Y.L. supervised the project; S.Y. wrote and edited the manuscript; and G.Y. revised the manuscript.
Disclosure statement
None of the authors declares competing financial interests.
Additional information
Funding
References
- Webster AC, Nagler EV, Morton RL, et al. Chronic kidney disease. Lancet. 2017;389(10075):1238–1252. doi: 10.1016/S0140-6736(16)32064-5.
- Global, regional, and national burden of chronic kidney disease, 1990-2017: a systematic analysis for the global burden of disease study 2017. Lancet. 2020;395(10225):709–733.
- Hanna RM, Streja E, Kalantar-Zadeh K. Burden of anemia in chronic kidney disease: beyond erythropoietin. Adv Ther. 2021;38(1):52–75. doi: 10.1007/s12325-020-01524-6.
- Batchelor EK, Kapitsinou P, Pergola PE, et al. Iron deficiency in chronic kidney disease: updates on pathophysiology, diagnosis, and treatment. J Am Soc Nephrol. 2020;31(3):456–468. doi: 10.1681/ASN.2019020213.
- Pazianas M, Miller PD. Osteoporosis and chronic kidney disease-Mineral and bone disorder (CKD-MBD): back to basics. Am J Kidney Dis. 2021;78(4):582–589. doi: 10.1053/j.ajkd.2020.12.024.
- Matsushita K, van der Velde M, Astor BC, et al. Association of estimated glomerular filtration rate and albuminuria with all-cause and cardiovascular mortality in general population cohorts: a collaborative meta-analysis. Lancet. 2010;375(9731):2073–2081. doi: 10.1016/S0140-6736(10)60674-5.
- Vajdic CM, McDonald SP, McCredie MR, et al. Cancer incidence before and after kidney transplantation. JAMA. 2006;296(23):2823–2831. doi: 10.1001/jama.296.23.2823.
- Wong G, Hayen A, Chapman JR, et al. Association of CKD and cancer risk in older people. J Am Soc Nephrol. 2009;20(6):1341–1350. doi: 10.1681/ASN.2008090998.
- Fraser SDS, Roderick PJ. Kidney disease in the global burden of disease study 2017. Nat Rev Nephrol. 2019;15(4):193–194. doi: 10.1038/s41581-019-0120-0.
- Hsu CY, McCulloch CE, Iribarren C, et al. Body mass index and risk for end-stage renal disease. Ann Intern Med. 2006;144(1):21–28. doi: 10.7326/0003-4819-144-1-200601030-00006.
- McMahon GM, Preis SR, Hwang SJ, et al. Mid-adulthood risk factor profiles for CKD. J Am Soc Nephrol. 2014;25(11):2633–2641. doi: 10.1681/ASN.2013070750.
- Feng L, Chen T, Wang X, et al. Metabolism score for visceral fat (METS-VF): a new predictive surrogate for CKD risk. Diabetes Metab Syndr Obes. 2022;15:2249–2258. doi: 10.2147/DMSO.S370222.
- Lin L, Tan W, Pan X, et al. Metabolic syndrome-related kidney injury: a review and update. Front Endocrinol (Lausanne). 2022;13:904001. doi: 10.3389/fendo.2022.904001.
- Eckel RH, Grundy SM, Zimmet PZ. The metabolic syndrome. Lancet. 2005;365(9468):1415–1428. doi: 10.1016/S0140-6736(05)66378-7.
- Yang S, Dai H, Hu W, et al. Association between circulating follistatin-like-1 and metabolic syndrome in Middle-aged and old population: a cross-sectional study. Diabetes Metab Res Rev. 2021;37(2):e3373.
- Prasad GV. Metabolic syndrome and chronic kidney disease: current status and future directions. World J Nephrol. 2014;3(4):210–219. doi: 10.5527/wjn.v3.i4.210.
- Japar KV, Hariyanto TI, Mardjopranoto MS. Relationship between phenotype models based on waist circumference and triglyceride levels and the risk of chronic kidney disease: a systematic review and meta-analysis. J Obes Metab Syndr. 2023;32(3):236–246. doi: 10.7570/jomes23037.
- McLaughlin T, Abbasi F, Lamendola C, et al. Heterogeneity in the prevalence of risk factors for cardiovascular disease and type 2 diabetes mellitus in obese individuals: effect of differences in insulin sensitivity. Arch Intern Med. 2007;167(7):642–648. doi: 10.1001/archinte.167.7.642.
- Xiong Y, Zhang Y, Zhang F, et al. Prevalence and associated factors of metabolic syndrome in Chinese Middle-aged and elderly population: a national cross-sectional study. Aging Male. 2021;24(1):148–159. doi: 10.1080/13685538.2021.1998432.
- Chang AR, Grams ME, Ballew SH, et al. Adiposity and risk of decline in glomerular filtration rate: meta-analysis of individual participant data in a global consortium. BMJ. 2019;364:k5301. doi: 10.1136/bmj.k5301.
- Stefansson VTN, Schei J, Solbu MD, et al. Metabolic syndrome but not obesity measures are risk factors for accelerated age-related glomerular filtration rate decline in the general population. Kidney Int. 2018;93(5):1183–1190. doi: 10.1016/j.kint.2017.11.012.
- Zhao Y, Hu Y, Smith JP, et al. Cohort profile: the China health and retirement longitudinal study (CHARLS). Int J Epidemiol. 2014;43(1):61–68. doi: 10.1093/ije/dys203.
- Hou B, Nazroo J, Banks J, et al. Migration status and smoking behaviors in Later-Life in China-Evidence from the China health and retirement longitudinal study (CHARLS). Front Public Health. 2018;6:346. doi: 10.3389/fpubh.2018.00346.
- Andresen EM, Byers K, Friary J, et al. Performance of the 10-item center for epidemiologic studies depression scale for caregiving research. SAGE Open Med. 2013;1:2050312113514576. doi: 10.1177/2050312113514576.
- Xiong Y, Zhang Y, Tan J, et al. The association between metabolic syndrome and lower urinary tract symptoms suggestive of benign prostatic hyperplasia in aging males: evidence based on propensity score matching. Transl Androl Urol. 2021;10(1):384–396. doi: 10.21037/tau-20-1127.
- Ye Z, Wu C, Xiong Y, et al. Obesity, metabolic dysfunction, and risk of kidney stone disease: a national cross-sectional study. Aging Male. 2023;26(1):2195932. doi: 10.1080/13685538.2023.2195932.
- Expert Panel on Detection, Evaluation, and Treatment of High Blood Cholesterol in Adults. Executive summary of the third report of the National Cholesterol Education Program (NCEP) expert panel on detection, evaluation, and treatment of high blood cholesterol in adults (Adult Treatment Panel III). JAMA. 2001;285(19):2486–2497. doi: 10.1001/jama.285.19.2486.
- Takamiya T, Zaky WR, Edmundowics D, et al. World health organization-defined metabolic syndrome is a better predictor of coronary calcium than the adult treatment panel III criteria in American men aged 40-49 years. Diabetes Care. 2004;27(12):2977–2979. doi: 10.2337/diacare.27.12.2977.
- Ford ES. Prevalence of the metabolic syndrome defined by the international diabetes federation among adults in the US. Diabetes Care. 2005;28(11):2745–2749. doi: 10.2337/diacare.28.11.2745.
- Luo H, Li J, Zhang Q, et al. Obesity and the onset of depressive symptoms among Middle-aged and older adults in China: evidence from the CHARLS. BMC Public Health. 2018;18(1):909. doi: 10.1186/s12889-018-5834-6.
- Xiong Y, Zhang YC, Jin T, et al. Depressive males have higher odds of lower urinary tract symptoms suggestive of benign prostatic hyperplasia: a retrospective cohort study based on propensity score matching. Asian J Androl. 2021;23(6):633–639. doi: 10.4103/aja.aja_12_21.
- Hallan S, de Mutsert R, Carlsen S, et al. Obesity, smoking, and physical inactivity as risk factors for CKD: are men more vulnerable? Am J Kidney Dis. 2006;47(3):396–405. doi: 10.1053/j.ajkd.2005.11.027.
- Kelly JT, Su G, Zhang L, et al. Modifiable lifestyle factors for primary prevention of CKD: a systematic review and Meta-Analysis. J Am Soc Nephrol. 2021;32(1):239–253. doi: 10.1681/ASN.2020030384.
- Park S, Lee S, Kim Y, et al. Short or long sleep duration and CKD: a mendelian randomization study. J Am Soc Nephrol. 2020;31(12):2937–2947. doi: 10.1681/ASN.2020050666.
- Hundemer GL, Ravani P, Sood MM, et al. Social determinants of health and the transition from advanced chronic kidney disease to kidney failure. Nephrol Dial Transplant. 2023;38(7):1682–1690. doi: 10.1093/ndt/gfac302.
- Liu M, Zhang Y, Yang S, et al. Bidirectional relations between depression symptoms and chronic kidney disease. J Affect Disord. 2022;311:224–230. doi: 10.1016/j.jad.2022.05.104.
- Wang Y, Zhang L, Zhang W, et al. Understanding the relationship between circulating lipids and risk of chronic kidney disease: a prospective cohort study and large-scale genetic analyses. J Transl Med. 2023;21(1):671. doi: 10.1186/s12967-023-04509-5.
- Garofalo C, Borrelli S, Minutolo R, et al. A systematic review and meta-analysis suggests obesity predicts onset of chronic kidney disease in the general population. Kidney Int. 2017;91(5):1224–1235. doi: 10.1016/j.kint.2016.12.013.
- Madero M, Katz R, Murphy R, et al. Comparison between different measures of body fat with kidney function decline and incident CKD. Clin J Am Soc Nephrol. 2017;12(6):893–903. doi: 10.2215/CJN.07010716.
- Lucove J, Vupputuri S, Heiss G, et al. Metabolic syndrome and the development of CKD in American indians: the strong heart study. Am J Kidney Dis. 2008;51(1):21–28. doi: 10.1053/j.ajkd.2007.09.014.
- Ming J, Xu S, Yang C, et al. Metabolic syndrome and chronic kidney disease in general chinese adults: results from the 2007-08 China national diabetes and metabolic disorders study. Clin Chim Acta. 2014;430:115–120. doi: 10.1016/j.cca.2014.01.004.
- Lopes HF, Corrêa-Giannella ML, Consolim-Colombo FM, et al. Visceral adiposity syndrome. Diabetol Metab Syndr. 2016;8(1):40. doi: 10.1186/s13098-016-0156-2.
- Ramirez-Jimenez M, Morales-Palomo F, Moreno-Cabañas A, et al. Effects of antihypertensive medication and high-intensity interval training in hypertensive metabolic syndrome individuals. Scand J Med Sci Sports. 2021;31(7):1411–1419. doi: 10.1111/sms.13949.
- Yang S, Cao C, Deng T, et al. Obesity-Related glomerulopathy: a latent change in obesity requiring more attention. Kidney Blood Press Res. 2020;45(4):510–522. doi: 10.1159/000507784.
- Muñoz-Durango N, Fuentes CA, Castillo AE, et al. Role of the Renin-Angiotensin-Aldosterone system beyond blood pressure regulation: molecular and cellular mechanisms involved in End-Organ damage during arterial hypertension. Int J Mol Sci. 2016;17(7):797. doi: 10.3390/ijms17070797.
- Remuzzi G, Perico N, Macia M, et al. The role of renin-angiotensin-aldosterone system in the progression of chronic kidney disease. Kidney Int Suppl. 2005;68(99):S57–S65. doi: 10.1111/j.1523-1755.2005.09911.x.
- Phillips CM. Metabolically healthy obesity: definitions, determinants and clinical implications. Rev Endocr Metab Disord. 2013;14(3):219–227. doi: 10.1007/s11154-013-9252-x.
- Soriguer F, Gutiérrez-Repiso C, Rubio-Martín E, et al. Metabolically healthy but obese, a matter of time? Findings from the prospective Pizarra study. J Clin Endocrinol Metab. 2013;98(6):2318–2325. doi: 10.1210/jc.2012-4253.
- Appleton SL, Seaborn CJ, Visvanathan R, et al. Diabetes and cardiovascular disease outcomes in the metabolically healthy obese phenotype: a cohort study. Diabetes Care. 2013;36(8):2388–2394. doi: 10.2337/dc12-1971.
- Hamer M, Bell JA, Sabia S, et al. Stability of metabolically healthy obesity over 8 years: the english longitudinal study of ageing. Eur J Endocrinol. 2015;173(5):703–708. doi: 10.1530/EJE-15-0449.
- Cho YK, Lee J, Kim HS, et al. Impact of transition in metabolic health and obesity on the incident chronic kidney disease: a nationwide cohort study. J Clin Endocrinol Metab. 2020;105(3):dgaa033.
- Ordovas JM, Corella D. Metabolic syndrome pathophysiology: the role of adipose tissue. Kidney Int Suppl. 2008;74(111):S10–S14. doi: 10.1038/ki.2008.517.
- Adair KE, von Waaden N, Rafalski M, et al. Metabolic phenotypes and chronic kidney disease: a Cross-Sectional assessment of patients from a large federally qualified health center. Life (Basel). 2021;11(2):175. doi: 10.3390/life11020175.