
 ?Mathematical formulae have been encoded as MathML and are displayed in this HTML version using MathJax in order to improve their display. Uncheck the box to turn MathJax off. This feature requires Javascript. Click on a formula to zoom.
Abstract
Aims
Six Delta is a six-dimensional independent platform for outcome-based pricing/contracting. The sixth dimension (δ6) estimates prices on the basis of adherence to the prescribed regimen, whereby manufacturers provide payers with adherence-enhancing programs and whereby payers implement these programs and provide adherence data to the manufacturer. We describe this dimension’s methodology and present a proof-of-concept application to the treatment of non-small cell lung cancer (NSCLC) with EGFR mutation with osimertinib.
Materials and methods
We propose two paybacks based on adherence: in-advance (based on clinical trial data) and in-arrear (based on real-world data). The risk of efficacy failure pricing dimension utilizes a 7-step method: 1) defining efficacy endpoints; 2) extracting data; 3) predicting models; 4) estimating in-advance and in-arrear paybacks; 5) suggesting ranges for in-advance and in-arrear paybacks; 6) adjusting for medical inflation; and 7) performing Monte Carlo Simulation (MCS) to estimate the DSPAdherence. A proof-of-concept exercise with osimertinib in NSCLC was performed for two hypothetical outcome-based contracts: 1-year (2019–2020) and 2-year (2019–2021). The 2018 wholesale acquisition cost (WAC) for a 30-day prescription was used and inflated as needed. Herein, the DSPAdherence is estimated exclusively in terms of in-advance payback because real-world data about osimertinib are not yet available and thus the in-arrear payback cannot yet be estimated.
Results
For the 1-year contract, the average price for osimertinib was $13,798 (SD=$1,265) and the DSPAdherence was $13,785 (or −5.69% of the 2018 WAC) for a 30-day prescription. For the 2-year contract, the average price was $12,555 (SD=$2,847) and the DSPAdherence was $12,582 (or −13.92% of the 2018 WAC).
Conclusions
We demonstrated that adherence-based pricing methods can be integrated into our proposed Six Delta platform for outcome-based pricing/contracting. The proof-of-concept exercise needs to be expanded with the in-arrear pricing method based on real world data to be secured.
Introduction
Previously, we provided methods validated by a proof-of-concept exercise to estimate the dimension-specific prices (DSPs) for five dimensions: dimension 1) cost-effectiveness analysis and cost-utility analysis-based pricingCitation1; dimension 2) willingness-to-pay-based pricingCitation2; dimension 3) reference-based pricingCitation3; dimension 4) safety-based pricingCitation4; dimension 5) risk of efficacy failure-based pricingCitation5. In this study, we continue our effort by developing methods and a proof-of-concept exercise for dimension 6 which is adherence-based pricing.
Patient adherence to their prescribed therapeutic regimen is one of the most important elements in an outcome-based contractCitation6. Adherence directly impacts clinical outcomesCitation7,Citation8. In turn, both the drug manufacturer and the payer benefit financially from patients adhering to their therapy. Manufacturers lose revenue if patients do not adhere or discontinue treatment, while payers may end up paying for the preventable risks that arise when patients do not adhere or discontinue their treatmentCitation6.
Drug manufacturers often support adherence programs initiated by payers and service providers. In a survey of members of the Academy of Managed Care Pharmacy (AMCP)Citation9, involving 35 drug payers and 30 drug manufacturers, 40% of the payers indicated that the implementation of outcome-based contracts requires support from drug manufacturersCitation9. Although manufacturers have agreed in principle to support adherence programs in some outcome-based contractsCitation9, the challenge they face is to define and monitor the implementation of such program so that they can hold payers and their beneficiaries accountable. Most (73%) of manufacturers in the survey claimed that the primary barrier to implementing outcome-based contracts is obtaining accurate outcome measuresCitation9. From our informal conversations with several pharmaceutical companies, we resolved the technical barriers of monitoring payer contractual compliance with implementing manufacturer manufacturers’ adherence-enhancing patient support programs.
In this sixth dimension of our outcome-based contracting platform, we focus on how to determine payback to drug payers for improving patient adherence and how manufacturers can accurately estimate the magnitude of adherence. To our knowledge, these bilateral needs can be satisfied by shaping payback conditions based on transparent, fair, and evidence-based methods, while also considering as many scenarios as possible with respect to outcome measures and incorporating sources for outcome data from clinical trials and real-world settingsCitation10.
As a caution, our methods to suggest payback to drug payers based on adherence programs may not apply to all healthcare settingsCitation11,Citation12. These methods may be of value in non-universal health care systems like in the US and in some of low and middle-income countriesCitation11,Citation12. Our proposed methods apply to settings that allow rebates and, more generally, in settings where post hoc paybacks are allowedCitation13.
In this paper, we propose a methodology to estimate manufacturer payback to payers for supporting adherence programs. These paybacks are in two dues: in-advance (based on clinical trial data) and in-arrear (based on real-world data). We acknowledge that uncertainty may arise in estimating these paybacks due to the different sources used for outcome measures, variations in methods for tracking disease and adherence to treatment, and challenges in mirroring clinical trial data in real-world settings. On the other hand, patients enrolled in trials tend to be more adherent than patients treated in daily clinical practice in the real world. The impact of this uncertainty is lessened in our study by integrating both trial and real-world data, different outcome measures, ranges for possible paybacks, and options for in-advance and in-arrear payback dues. As a proof-of-concept, we apply the 7-step method to assess the price of osimertinib for inclusion in an outcome-based contract under two hypothetical contracts: a 1-year contract (2019–2020) and a 2-year contract (2019–2021). In each contract, we suggest ranges for possible paybacks and inflate these ranges as needed. Subsequently, we calculate the average and standard deviation (SD), and perform MCS to suggest a DSPAdherence.
Methods
Overview
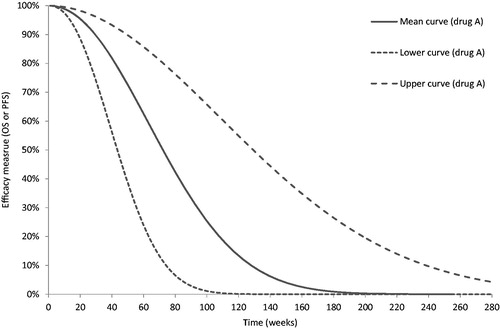
We provide a 7-step method that can be used for estimating paybacks based on patient adherence following manufacturer-sponsored adherence programs for use in an outcome-based contract (). The core idea of our methods is the use of outcome data from clinical trials a priori to project certain paybacks “in-advance paybacks”, which are then updated a posteriori as real-world data become available “in-arrear paybacks”. Briefly, in clinical trials, a Kaplan–Meier (K-M) curve represents the mean and indicates how the drug is expected to perform in a specific population at the reported rate of adherence. This mean curve is enclosed by lower and upper curves (). We estimate paybacks to payers as percentages of the marketed price of a treatment based on an estimation of the percentage of patients for whom the treatment may result in benefits beyond the expected benefit (in-advance paybacks estimated from clinical trial data) and/or below the expected benefit (in-arrear paybacks estimated from real-world data). The population between the mean and upper curves can be considered the population who benefited from the drug more than others, and paybacks are granted for this population as percentages of the marketed price. In our method, this percentage is calculated at the time of contracting on the basis of clinical trial data and adjusted forward for inflation. The population below the lower curve is the population that, in real-world clinical practice, did not benefit from the drug and for whom payback is warranted if this failure occurred in a real-world setting. This percentage is calculated when real-world data become available for comparison with clinical trial data. These two pay-backs are contingent, however, of the payer providing contractually defined metrics of patient adherence to their drug regimen.
Figure 1. Five-step method for estimating paybacks to support adherence programs. Abbreviations. t, time of contract, RCT, randomized controlled trial, RWD, real-world data; MCS, Monte Carlo Simulation.
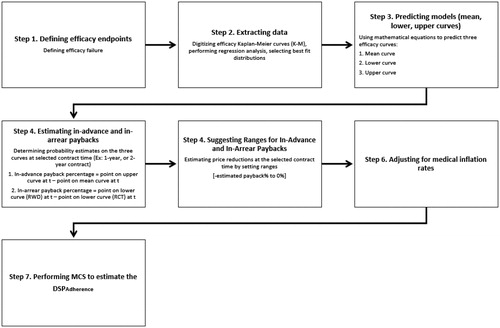
Figure 2. Hypothetical example of a deterministic curve for drug A, with by lower and upper curves.
Adherence-based pricing
Step 1. Defining efficacy endpoints
Defining the efficacy endpoints of interest can be achieved by several methods, preferably in some combination rather than reliance on a single method data, literature review, evidence-based guidelines, consensus, and or expert opinion (). For example, in cancer, OS and PFS are well defined and accepted efficacy measures. Thus, in our method for drug A, two efficacy endpoints are used in outcome-based contracting of cancer treatments: one based on the OS and one based on the PFS.
Step 2. Extracting data
Traditional patient data from a clinical trial or real-world study are the ideal source of data. However, and assuming K-M curves for drug A as reported in a clinical trial are digitized and then replotted based on various parametric distributions. Regression analyses are performed to identify the best fitting distribution with such metrics as the Akaike Information Criteria (AIC), Bayesian Information Criteria (BIC), or general linear models (GLM). The shape and scale coefficients for the selected distribution are used to replicate the OS and PFS K-M curves reported in the clinical trial.
Step 3. Predicting models (mean, lower, and upper curves)
The three mathematical equations are applied to predict the mean curve, lower curve, and upper curve of efficacy measures (OS or PFS). The mean curve is predicted by using the mean estimates of the shape and scale coefficients of the distribution. The lower curve is predicted by using the upper estimates of shape and scale coefficients; and the upper curve by using the lower estimates of the shape and scale coefficients. This step is repeated for each of the efficacy measures of interest. shows an example of the curves generated for drug A. The Y-axis represents the probability of effect and the X-axis represents the time function.
Step 4. Estimating in-advance and in-arrear paybacks
Payback projection for drug A requires two sub-steps: First, from the generated curves – mean, lower, and upper curves – for the OS and PFS best-fit distributions, points are captured for a selected time. This time represents the duration of the outcome-based contract agreed upon by the drug manufacturer and payer (e.g. 1-year contract, 2-year contract). We provide an example in that shows the points taken at 52 weeks (hereafter, the 1-year contract). These points (A, B, and C) are determined in the upper, mean, and lower curves, respectively.
Figure 3. Hypothetical example for estimating efficacy probabilities for 1-year contracting.
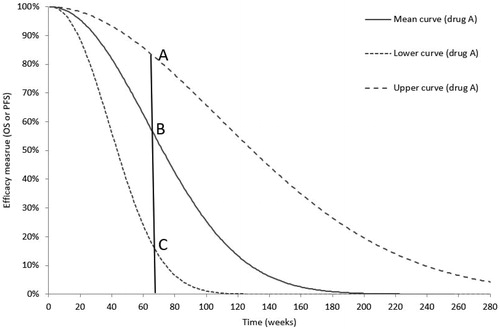
Second, our methodology includes two payback projections: The in-advance payback (e.g. at the beginning of the 1-year contract and based on clinical trial data) and the in-arrear payback (e.g. at the end of the 1-year contract and based on real-world data). The in-advance payback percentage is projected at the beginning of the contract and equals the differential probability between the upper curve and the mean curve (point A – point B) at 52 weeks as shown in . This differential can be calculated from EquationEquation (1)(1)
(1) , and the drug price can be adjusted after deducting the in-advance payback and adding the inflation rate specified for 1 year.
(1)
(1)
where T is time of contract; RCT = randomized clinical trial.
The in-arrear payback percentage equals the differential probability between the lower curve estimated in the clinical trial and any possible real-world point that falls below it (point C– any real-world point below C) at 52 weeks. This differential cannot be estimated at the beginning of the contract because it requires real-world data.
(2)
(2)
where T=time of contract; RWD = real-world data; RCT = randomized clinical trial.
Step 5. Suggesting ranges for in-advance and in-arrear paybacks
For the in-advance payback, the percentage resulting from EquationEquation (1)(1)
(1) is subject to prediction errors that may arise from analysis errors in digitizing and/or estimating fitting coefficients. To minimize this error, we propose that the in-advance payback percentage be set as a range between the negative value of the differential probability (A – B) and 0% (no paybacks added).
The in-arrear payback, can be considered a future condition on an outcome-based contract that requires real-world data. If the probabilities of the efficacy measures are estimated from real-world data fall below the lower probability (point C) projected parametrically from the clinical trial, the manufacturer provides additional payback the payer. Similar to the in-advance payback, to minimize prediction errors, we propose that the in-arrear payback percentage be set as a range between the negative value of the differential probability (CRCT − CRWD) and 0% (no paybacks added).
Step 6. Adjusting for medical inflation rates
The suggested ranges for the two paybacks need to be adjusted for the estimated medical inflation during the contract period. Any future contracting should inflate price estimates based on the projected inflation rates as indicated by the medical consumer price index (mCPI) for prescriptions as published by the Bureau of Labor StatisticsCitation14. This is achieved by averaging the mCPI for previous years and using these averages in the inflation adjustments.
Step 7. Performing MCS to estimate the DSPAdherence
The prices and ranges estimated in the previous step subjected to MCS to generate the DSPAdherence for a specific contract. This by using the following functions for gamma distribution that is scaled from 0 to the positive infinity (0 to +∞)Citation15:
(3)
(3)
(4)
(4)
where ɑ is shape; β is scale; X̄ is average of all price reduction scenarios; and SD is standard deviation
That is, the MCS was applied to run 2,000 iterations for a given contract, and the average of the price iterations generated was called the DSPAdherence.
Assumptions
Three assumptions provided on the adherence-based pricing. First, the payer’s population does not switch to another payer during the contract. However, if the payer can provide a projected turnover rate, the payback percentage can be adjusted by multiplying it with this rate. Second, the payer should provide mutually agreed real-world adherence data and the adherence rate should be used to adjust by multiplication the in-arrear payback percentage. Third, we assume that the patient population for whom the treatment was more effective than expected (between the mean and upper curve) receives a payback of up to the difference between these curves.
Proof-of-concept: application to osimertinib in NSCLC with EGFR mutation
Background
We used the K-M curves of osimertinib from the FLAURA clinical trial. Then we used the estimated risk to estimate the paybacks on osimertinib wholesale acquisition cost (WAC) in two contracts: a 1-year contract (2019–2020) and a 2-year contract (2019–2021). In each contract, we estimated the DSPAdherence.
Model inputs
As shown in , we used the OS and PFS K-M curves published from the FLAURA clinical trial for osimertinib to provide in-advance paybacks for the 2018 WAC for a 30-day prescription of osimertinib, which was $14,616Citation16. The medical inflation rates represented in medical consumer price index (mCPI) were projected from the U.S. Bureau of Labor StatisticsCitation14, by averaging the mCPI over 5 years (2014–2018) yielding adjustment at 0.44% over the 1-year contract and at 0.72% over the 2-year contract.
Table 1. Model inputs.
Analysis
Analyses for the proof-of-concept exercise were performed using Microsoft Excel 365Footnotei MSO supported Visual Basic for Applications (VBA).
Results
Step 1. Defining efficacy endpoints
We focused on two efficacy endpoints as reported in the FLAURA trial, OS and PFSCitation17.
Step 2. Extracting data
The OS and PFS K-M curves for osimertinib from the FLAURA clinical trial were digitized and then re-simulated in three different parametric distributions (Weibull, Exponential, and Gompertz). For each, GLM regression analyses were performed to generate F statistics, R2, residual sum of squares, and (as applicable) shape and scale coefficients. The AIC, the main metric for determining the best fitting distribution, identified the Weibull distribution as the indicated parametric distribution for both OS and PFS.
Step 3. Predicting models (mean, lower, and upper curves)
The OS and PFS Weibull regressions for osimertinib generated means and upper and lower 95%CIs bounds for the scale and shape coefficients. These metrics were used in three mathematical equations specified for the OS and PFS Weibull distributions ( and ) to determine the mean, lower, and upper OS and PFS curves. shows the three predicted OS Weibull curves for osimertinib; shows the three predicted PFS Weibull curves for osimertinib.
Figure 4. Overall survival (OS) Weibull upper, deterministic, and lower curves.
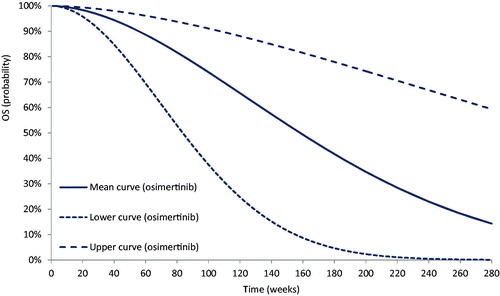
Figure 5. Progression-free survival (PFS) Weibull upper, deterministic, and lower curves.
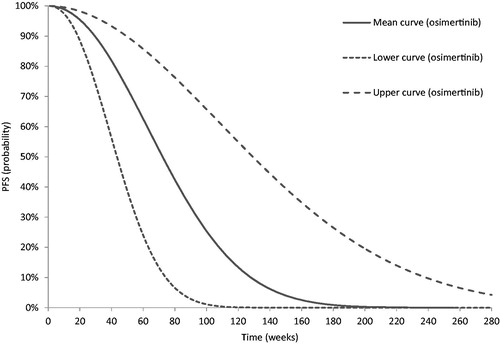
Table 2. Equations used to predict mean, lower, and upper Weibull curves for overall survival (OS).
Table 3. Equations used to predict mean, lower, upper Weibull curves for progression-free survival (PFS).
Step 4. Estimating in-advance and in-arrear paybacks
As seen in , for the 1-year contract, in terms of the OS, the mean probability was 0.91, the lower value was 0.76, and the upper value was 0.97; for the PFS, the mean probability was 0.71, the lower value was 0.35, and the upper value was 0.89. For the 2-year contract, in terms of the OS, the mean probability was 0.72, the lower value was 0.35, and the upper value was 0.91; for the PFS, the mean probability was 0.23, the lower value was 0.01, and the upper value was 0.64.
Table 4. Probability and differential estimates.
By applying the EquationEquation (1)(1)
(1) , as shown in , for the 1-yaer contract, based on OS, the differential probability was estimated at 0.06; and based on PFS, the differential probability was estimated at 0.18. For the 2-year contract, based on OS, the differential probability was estimated at 0.18; and based on PFS, the differential probability was estimated at 0.41.
Considering EquationEquation (2)(2)
(2) , the differential probability for an in-arrear payback could not be estimated because of lacking real-world data. However, the FLAURA clinical trial-based lower probability points were determined as follows. For the 1-year contract, based on OS, the lower probability point was 76%; based on PFS, the lower probability point was 41%. For the 2-year contract, based on OS, the lower probability point was 35%; based on PFS, the lower probability point was 18%. Due to lacking of real-world data, we could not estimate the in-arrear payback. Further, the results below from step 5 to step 7 are exclusively based on clinical trial data (in-advance payback).
Step 5. Suggesting ranges for in-advance paybacks
In-advance payback
For the 1-year contract, based on OS, the differential probability was estimated at 0.06, and the suggested range for the in-advance payback was −6.00% to 0%; based on PFS, the differential probability was estimated at 0.18, and the suggested range for the in-advance payback was −18.00% to 0% (). In the 2-year contract, based on OS, the differential probability was estimated at 0.18 to suggest a range for the in-advance payback of −18.00% to 0%; based on PFS, the differential probability was estimated at 0.41, to suggest a range for the in-advance payback (−41.00% to 0%).
Table 5. Adherence-based pricing for 1-year contract (2019–2020) and 2-year contract (2019–2021).
Step 6. Adjusting for medical inflation rates
As shown in , considering mCPI for 1-year contract at 0.44%: based on OS, the osimertinib WAC price range was $13,835 to $14,680; and based on PFS, the osimertinib WAC price range was $11,997 to $14,680. Considering mCPI for the 2-year contract at 0.72: based on OS, the osimertinib WAC price range was $12,054 to 14,721; based on PFS, the osimertinib WAC price range was $8,724 to $14,721.
Step 7. Performing MCS to estimate the DSPAdherence
As shown in , for the 1-year contract, the average price for osimertinib was $13,798 (SD=$1,265), and the DSPAdherence was $13,785 (or −5.69% the 2018 WAC); and for the 2-year contract, the average price was $12,555 (SD = 2,847), and the DSPAdherence was $12,582 (or −13.92% the 2018 WAC).
Discussion
We propose a balanced 7-step method for manufacturer and payers to consider patient adherence, as promoted by manufacturer-sponsored programs, as a dimension in outcome-based contracting. Four balancing strategies are emphasized. In the first strategy, we suggest that drug manufacturer provide a payback to payers in order to support adherence programs for patients. This is contingent on a commitment from the payer that ensures that the volume of treatment sales is exactly representing the amount of payers’ volume of patients during specific contract duration. In return, payers will benefit from adherence-based contracting in the form of better patient outcome and preventable risk.
In the second strategy, is the split of the payback into in-advance and in-arrear dues. The in-advance payback recognizes the patients most likely to benefit from the treatment and incentivizes payers to maintain these patients on treatment. The in-arrear payback assumes that the patient adherence support program was initiated during the contract duration and that monitoring data demonstrate that the adherence rate from the real-world evidence was within the acceptable ranges reported in clinical trial. However, this payment is tied to those patients who did not show the minimum expected benefit as reported in the clinical trial. The reason for making the in-arrear payback dependent on those adhered patients who did not evidence the minimum expected benefit is that these patients should have shown a therapeutic benefit and that the lack of benefit cannot be attributed to non-adherence.
In the third strategy, the estimated in-advance payback is not an absolute percentage but rather a range that extends downward from 0% payback to the estimated payback from our 7-step method. This means that the manufacturer may support adherence programs at the estimated payback from the clinical trial or below this estimate. This also resolves the uncertainty about the ability of payers to ensure an adherence rate in real-world settings that is similar to that in clinical trials. Note also that the in-arrear payback is the absolute value based on real-world data.
In the fourth strategy, the estimated paybacks (whether in-advance or in-arrear) are dependent on the number of efficacy measures included. In our proof-of-exercise, the DSPAdherence was based on OS and PFS. This was helpful in itself, but also considering our limitation that insufficient real-world data were available at this time. With more than one of efficacy measure included, a greater level of price dispersion was observed.
Our proof-of-concept exercise is in the setting of lung cancer, which in the US is the most incident and prevalent non-gender type of cancerCitation18. We used osimertinib because third-generation EGFR TKIs was approved while we were developing the Six Delta platform, was priced at 2x of standard of care, and became therecommended first line treatment of NSCLC. Clinical trial data and price points were publicly available as well.
In our proof-of-concept exercise, osimertinib demonstrated plausible results in two areas. First, the in-advance payback percentages based on the PFS exceeded those for the OS, which can be attributed to the difference between the PFS mean and upper curves being greater than the difference between the OS mean and upper curves. Greater differences between the curves yielded higher payback percentage; while smaller differences translate into lower payback percentage. Thus, payers gain a greater payback for osimertinib if they consider the PFS in their DSPAdherence calculations.
Second, contracting for longer durations results in greater price reductions. In our example, payers can achieve incremental average savings of 8.23% on the price of osimertinib if they engage in a 2-year contract rather than a 1-year contract. This is also of value to the manufacturer because it assures a 2-year commitment without the need for negotiating a contract after one year.
Our proposed methodology has several strengths. The 7-step method yields plausible results. For the statistical methods, we used three predicted curves to estimate differences between the upper and mean curves, and between the lower curve in real-world data and the lower curve in clinical trial. The techniques and tools to digitizing, regression modeling, and curve fitting are commonly used in pharmacoeconomic modeling. In addition, the technique of MCS, in which sampling through iterations is considered, is applied to assess the stability of model inputs. The use of ranges for paybacks rather than absolute values provides flexibility, accommodates uncertainty, and considers that adherence in real settings may be different from those in clinical trials. Our proof-of-concept analysis considered two efficacy measures. The methods are treatment-specific regardless of market condition or competitors. This also compensates for a lack of comparative studies at the time of product launch, as the FDA regulators may not require an active comparator in clinical trials for approval purposes.
Our study has limitations. Our methodology is based on drug adherence and efficacy measures and not on other characteristics of treatments (e.g. oral versus IV) and patient variables (e.g. age, forgetfulness, falling asleep)Citation19,Citation20. While such factors are important in any outcome-based contracting decision, we provided a form for model inputs selection (Supplemental Material) to enable contractors to include relevant factors that have been proved to be influential in optimizing adherence rates. Also, this study is limited to health care settings that have well-established infrastructures for outcome-based contractingCitation13.
Some limitations are acknowledged. The method of pricing based on selected efficacy endpoints may be affected by selection bias. Using surrogate endpoints like the PFS in our proof-of-concept may be debatable; though, arguably, surrogate endpoints complement primary endpoints. We suggest considering expert opinion when specifying inclusion and exclusion criteria (Supplemental Material). Our proof-of-concept used clinical trial data and needs to be replicated in time with real-world data. Using data from varying sources may provide additional information needed to support prices. Pricing-based prediction modeling is affected mainly by the fitting strategies used. In our proof-of-concept exercise, we digitized and simulated data for two endpoints (OS and PFS) and fitted the data using the Weibull distribution because it yielded the best AIC result. Additional distributions can be used in scenario analyses and can be weighted based on the ability to predict. In turn, estimating paybacks can be based on weighted endpoint estimates.
The assumption of no switching between payers may constrain estimates unless the rate of switching can be projected by the payer. The adherence rate in a clinical trial data and the real-world setting are likely to differ, yet, here to an acceptable adherence rate can be projected and integrated into the estimations as an adjustment. Our proof-of-concept exercise was limited to clinical trial data. Our calculations for the DSPAdherence will need to be replicated once adequately provided real-world data are available. Further, the DSPAdherence in this paper is suggested to be integrated into our six-dimensional platform for outcome-based contracting. Future research should build on methods developed in this article and include other adherence-related metrics like patient’s characteristics, co-morbidities, among others, and treatment characteristics like dosage form and frequency, among others. Also, future adaptations of our methods in this paper for settings in which discounts or rebates are not allowed is important to optimizing adherence programs initiatives in these settings.
Conclusion
We attempted to provide a method to measure possible paybacks to support adherence programs in two dues: in-advance (based on clinical trial data) and in-arrear (based on real-world data). In the proof-of-concept, the resulting DSPsAdherence reflect the in-advance paybacks because real-world data were lacking. Further, using other dimensional prices, as per our platform, might offer additional insights to the information needed about drug pricing.
Transparency
Declaration of funding
The work reported herein was performed without sponsorship or grant funding.
Declaration of financial/other relationships
The authors have no financial relationships to declare.
JME peer reviewers on this manuscript have no relevant financial or other relationships to disclose.
Author contributions
All named authors meet the International Committee of Medical Journal Editors (ICMJE) criteria for authorship of this manuscript.
JME-2020-0098-RT.R1_SUPPLEMENT_CATS.docx
Download MS Word (21 KB)Acknowledgements
No assistance was received in the preparation of this article.
Notes
i Microsoft Excel 365 is a registered trademark of Microsoft Research Lab, Redmond, Washington, DC, USA.
References
- Alkhatib NS, Erstad B, Ramos K, et al. Pricing methods in outcome-based contracting-δ1: cost-effectiveness analysis and cost utility analysis-based pricing. J Med Econ. 2020;23(11):1215–1222.
- Alkhatib NS, Ramos K, Erstad B, et al. Pricing methods in outcome-based contracting-δ2: willingness-to-pay-based pricing. J Med Econ. 2020;23(11):1223–1229.
- Alkhatib NS, Erstad B, Ramos K, et al. Pricing methods in outcome-based contracting-δ3: reference-based pricing. J Med Econ. 2020;23(11):1230–1236.
- Alkhatib NS, Bhattacharjee S, McBride A, et al. Pricing methods in outcome-based contracting-δ4: safety-based pricing. J Med Econ. 2020;23(11):1237–1245.
- Alkhatib NS, McBride A, Bhattacharjee S, et al. Pricing methods in outcome-based contracting-δ5: risk of efficacy failure-based pricing. J Med Econ. 2020;23(11):1246–1255.
- Pagliarulo N. Biogen inks outcomes-based contract for MS meds. [accessed December 2019]. Available from: https://www.biopharmadive.com/news/biogen-outcomes-based-contract-prime-multiple-sclerosis/512422/
- DiMatteo MR, Giordani PJ, Lepper HS, et al. Patient adherence and medical treatment outcomes: a meta-analysis. Med Care. 2002;40:794–811.
- World Health Organization. Adherence to long-term therapies. [accessed December 2019]. Available from: https://www.who.int/chp/knowledge/publications/adherence_report/en/
- Duhig AM, Saha S, Smith S, et al. The current status of outcomes-based contracting for manufacturers and payers: an AMCP membership survey. J Manag Care Spec Pharm. 2018;24:410–415.
- Malmström RE, Godman BB, Diogene E, et al. Dabigatran – a case history demonstrating the need for comprehensive approaches to optimize the use of new drugs. Front Pharmacol. 2013;4:39.
- Simoens S, Sinnaeve PR. Patient co-payment and adherence to statins: a review and case studies. Cardiovasc Drugs Ther. 2014;28:99–109.
- Chin AL, Bentley JP, Pollom EL. The impact of state parity laws on copayments for and adherence to oral endocrine therapy for breast cancer. Cancer. 2019;125:374–381.
- Ferrario A, Arāja D, Bochenek T, et al. The implementation of managed entry agreements in Central and Eastern Europe: findings and implications. Pharmacoeconomics. 2017;35:1271–1285.
- U.S. Bureau of Labor Statistics. Prescription drugs in U.S. city average, all urban consumers, seasonally adjusted. [accessed December 2019]. Available from: https://data.bls.gov/timeseries/CUSR0000SEMF01?output_view=pct_3mths
- Briggs A, Claxton K, Sculpher M. Decision modelling for health economic evaluation. New York (NY): Oxford University Press; 2011.
- RedBook Online [subscription database onlie]. Greenwood Village (CO): Truven Health Analytics. [accessed December 2019; updated periodically]. Available from: http://micromedex.com/products/product-suites/clinical-knowledge/redbook
- Soria J, Ohe Y, Vansteenkiste J, et al. Osimertinib in untreated EGFR-mutated advanced non–small-cell lung cancer. N Engl J Med. 2018;378:113–125.
- American Cancer Society. Chronic lymphocytic leukemia (CLL). [accessed December 2019]. Available from: https://www.cancer.org/cancer/chronic-lymphocytic-leukemia.html
- Krikorian S, Pories S, Tataronis G, et al. Adherence to oral chemotherapy: challenges and opportunities. J Oncol Pharm Pract. 2019;25:1590–1598.
- Muluneh B, Schneider M, Faso A, et al. Improved adherence rates and clinical outcomes of an integrated, closed-loop, pharmacist-led oral chemotherapy management program. J Oncol Pract. 2018;14:e324–e334.