
 ?Mathematical formulae have been encoded as MathML and are displayed in this HTML version using MathJax in order to improve their display. Uncheck the box to turn MathJax off. This feature requires Javascript. Click on a formula to zoom.
Abstract
Aims
Six Delta is a six-dimensional independent platform for outcome-based pricing/contracting. The first dimension (δ1) estimates prices on the basis of cost-effectiveness (CEA) and cost-utility analysis (CUA). We describe this dimension’s methodology and present a proof-of-concept application to the treatment of non-small cell lung cancer (NSCLC) with EGFR mutation with osimertinib.
Materials and methods
CEA and CUA were performed using established methods. Probabilistic sensitivity analyses (PSA) were performed to generate cost-effectiveness acceptability curves (CEAC), specifically the PSA incremental cost-effectiveness (PSA ICER) and incremental cost-utility ratio generated CEACs (PSA ICUR). Price of treatment was estimated at three certainty levels (0%, turning point%, 100%). The marketed drug price at turning point was used to estimate prices at 0% and 100% certainty levels, as per PSA ICER and PSA ICUR-generated CEACs. The resulting prices were pooled, inflated, and simulated by Monte Carlo Simulation (MCS) methods to estimate the dimension-specific price based on CEA and CUA (DSPCEA/CUA). A proof-of-concept exercise with osimertinib in NSCLC was performed for two hypothetical outcome-based contracts: 1-year (2019–2020) and 2-years (2019–2021).
Results
Turning points were estimated at the 50% certainty level in both PSA ICER and ICUR-generated CEACS. At these points, the wholesale acquisition cost for osimertinib was $14,616 (30-day prescription); inflated by 0.44% for 1-year and by 0.72% for 2-year contracts. Additional prices at 0% and 100% certainty levels were quantified based on the PSA ICER and ICUR-generated CEACs. The MCS yielded a DSPCEA/CUA of $16,391 for the 1-year contract and a DSPCEA/CUA at $16,677 for the 2-year contract for a 30-day prescription.
Conclusions
We demonstrated that conventional CEA and CUA methods generate price estimates at varying levels of certainty that can be integrated into our proposed Six Delta platform for outcome-based pricing/contracting.
Introduction
In the USA, methods for drug pricing are shifting from volume-based pricing to value-based pricingCitation1. Different approaches for value-based pricing are being examined, with outcome-based pricing being the most frequent themeCitation1. Outcome-based pricing, often also called outcome-based contracting, is defined as a scenario in which a payer and a drug manufacturer are committed to using clinical measures as pricing determinants for purchasing contracts. Typically, in an outcome-based contract, a price adjustment is ensured in association with outcomes resulting from a drug or a health care programCitation1,Citation2. For example, if the drug shows expected or above expected clinical benefits, the full price is ensured by the payer; if the drug does not show minimum expected clinical benefits, a payback is ensured by the manufacturerCitation2.
The International Society for Pharmacoeconomic and Outcomes Research (ISPOR) Task ForceCitation3 classifies outcome-based contracts in the category of pay-for-performance arrangements. These arrangements aim to manage utilization in the real world by linking the payback to the performance of interventions. Although the suggested ISPOR framework is being used publicly as guidance for payers and drug manufacturers regarding the design of outcome-based contracts, technical methods are also being developed internally by payers and drug manufacturers. While often initial contracts are, by necessity, based on data from pivotal clinical trials, in time such contracts also require real-world data for determining pricesCitation3. The lag time between the availability of clinical trial data to support the approval process of a treatment and the availability of real-world data to support pricing of the treatment may trigger opportunistic pricing strategies by the manufacturer during development of the real-world data.
The methods used in outcome-based contracting are evolving but few have been disclosed. In addition, these methods tend to be specific to the stakeholders, whether payer or manufacturer, and therefore serving the specific needs of the stakeholder. An independent platform is needed for outcome-based pricing and contracting. To this end, we have developed a comprehensive methodology consisting of six dimensions.
Optimizing conventional methods of cost-effectiveness (CEA) and cost-utility analysis (CUA) has been argued to enhance value-based pricing approaches by Claxton et al.Citation4 who concluded that value-based pricing would lead to lower spending on drugs. In this present paper, specific to dimension 1, we aim to optimize the pricing information that can be retrieved from conventional value assessment tools such as that are CEA and CUA in which clinical trial data are used, incremental ratios are measured, and results are confirmed by probabilistic sensitivity analysis (PSA).
In conventional CEA and CUA, the focus on communicating treatment value is restricted to the incremental cost-effectiveness ratio (ICER) and incremental cost-utility ratio (ICUR) terms, respectively. These terms are captured at the turning point% certainty level in the cost-effectiveness acceptability curve (CEAC) in which a treatment of interest become cost-effective over its alternatives. Through this, coverage decisions can be assessed at different levels of willingness to pay (WTP) associated with different probability scales for treatment cost-effectiveness (scale 0%–100%). If the decision is to accept the ICER or ICUR values at the turning point% certainty level for coverage of the treatment, the payer must accept the price point for the interventions used in the analysis. If this is the case, the payer excludes other pricing scenarios associated with the minimum certainty level (0%) and the maximum certainty level (100%). Our approach is to capture the price of a drug at the conventional turning point% certainty and also at the 0% and 100% levels, and apply MCS methods to estimate the average price of the drug when the estimated prices at these certainty scenarios are simulated.
Model
Overview
In this study, we attempted to optimize the pricing information provided by CEA and CUA. Pricing in these conventional methods consider CEAC curves generated from PSAs at turning point% probability at which the treatment of question is cost-effective over its alternative(s). This turning point% probability refers to turning point% certainty level at which the CEA and CUA models’ inputs are accurate and represent the information needed to decide about adopting and funding a given treatmentCitation5.
A decision to adopt and/or fund a treatment made at the turning point% certainty level implies that price negotiations will be around the corresponding price point obtained in the CEA and CUA. In other words, the decision implies that the scenarios of the model inputs not being accurate at all (0% certainty level) or totally accurate (100% certainty level) are excluded. To resolve this technical issue, we integrate the 0% and 100% scenarios with the conventional turning point% certainty scenario.
Our conceptual design is to create different prices (i.e. price variations) that subsequently are fitted to a gamma price distribution, and in which MCS is applied to generate a single estimate that represents the dimension-specific price based on CEA and CUA (DSPCEA/CUA). Thus, a set of calculations is performed to satisfy all potential pricing scenarios at the 0%, turning point%, and 100% certainty levels.
This first of our six-dimensional outcome-based pricing and contracting framework and platform was applied in a proof-of-concept analysis to the case of osimertinib in the treatment of non-small cell lung cancer (NSCLC) with EGFR mutation. The aim of this proof-of-concept was to estimate the DSPCEA/CUA of osimertinib for a 30-day prescription by using the wholesale acquisition cost (WAC). Two hypothetical outcome-based contracts were assumed: a 1-year contract (2019–2020) and a 2-year contract (2019–2021).
Cost-effectiveness analysis and cost-utility analysis-based pricing
We used the CEACs generated by the PSAs for the ICER and ICUR to estimate prices at different levels of certaintyCitation6 (). CEAC is a graph allowing visualization of the effects of uncertainty on the ICER and ICUR. The Y axis represents the certainty of cost-effectiveness expressed as a percentage, and the X axis represents thresholds of WTP values expressed in dollars per LY or per QALY gainedCitation6. The CEAC helps decision-makers understand the uncertainty associated with making a particular decision to approve or reject a new heath technology. The CEAC, derived from the joint distribution of costs and effects, illustrates the (Bayesian) probability of the data being consistent with a true cost-effectiveness ratio below a specified ceiling ratioCitation5.
Figure 1. Cost-effectiveness analysis and cost-utility analysis-based pricing. Abbreviations. CEA, cost-effectiveness analysis; CUA, cost-utility analysis; CEAC, cost-effectiveness acceptability curve; DSP, dimension-specific price.
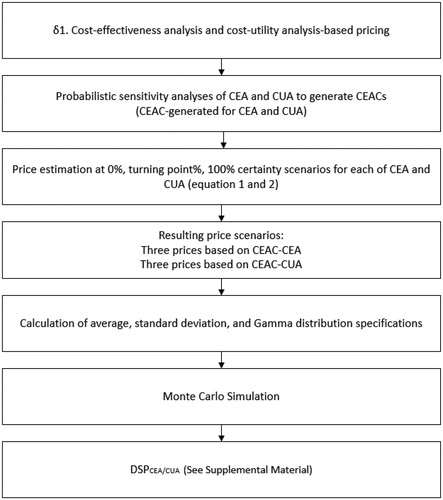
Historically, the conventional methods of pricing that have used CEA or/and CUA focused mainly on the average PSA ICER and PSA ICUR, respectively. The limitation of such methods is that the average PSA ICER and/or PSA ICUR are captured at a neutral level of turning point% certainty on the CEAC. The accuracy of price estimation might indeed be questionable because the price of the drug of interest used in the analysis is the marketed price. Thus, at turning point% certainty in the CEAC, the cost-effectiveness of the drug can be turning point% warranted and 1-turning point% not warranted at that marketed price. Alternatively, and in this dimension, we provide a method to estimate three prices for a drug at three different certainty levels: 0% (no certainty), turning point% and 100% (full certainty). The calculations in this dimension were replicated twice: once with a PSA ICER-generated CEAC and once with a PSA ICUR-generated CEAC.
Procedurally, according to the CEAC curves, the PSA ICER and PSA ICUR values were quantified at the three levels – 0%, turning point% and 100% – of certainty. To illustrate the quantifying method, the marketed drug price was intuitively known when the PSA ICER or PSA ICUR was captured at turning point% certainty. Thus, mathematically, we were able to apply ratio calculations to estimate the two prices corresponding to the 0% and 100% certainty levels. For simplicity, we provide step-by-step equations for estimating prices on the basis of the PSA ICER; the equations were also replicated to estimate prices on the basis of the PSA ICUR.
A price for a drug at turning point% certainty was the marketed drug price used to estimate the average PSA ICER.
(1)
(1)
(2)
(2)
As shown above, three prices for a drug can be derived based on PSA ICER-generated CEACs. In addition, by replicating EquationEquations (1)(1)
(1) and Equation(2)
(2)
(2) above to involve the PSA ICUR, an additional three prices for the drug can be derived based on the CEAC-generated PSA ICUR. This yields a total of six different prices for the drug: three prices obtained from the PSA ICER-generated CEAC and three prices obtained from the PSA ICUR-generated CEAC. Note, that we estimate these prices at a specific point in time and should be inflation-adjusted for the duration of the contract. This can be achieved by using the medical Consumer Price Index (mCPI) specific for prescription drugs, which are available from the U.S. Bureau of Labor StatisticsCitation7.
Monte Carlo simulation to estimate price in a random pattern of variation
The methods above generate price variations for a drug based on the underlying assumptions and inputs. Some prices may deviate modestly from the marketed (WAC) drug price, and some may be extremely over- or underestimated. MCS is a parametric method that empirically involves large numbers of iterations (e.g. 1,000 or 2,000) to estimate the shape of the statistical distribution of variation in drug pricesCitation8. In our analysis, the gamma distribution for price variation was used with price inputs generated from this dimension’s analyses to obtain a price of a drug of interest under a random pattern of price variation. The following equations were used for to specify the parameters for gamma distributionCitation9:
(3)
(3)
(4)
(4)
where ɑ (alpha) is the shape parameter β (beta) the rate parameter; X̄ the average of all price scenarios; and SD the standard deviation of the price scenarios.
Assumption
The methods for this first pricing dimension are based on the assumption that a drug price changes at a constant rate in a linear relationship to the PSA ICER or PSA ICUR values. This assumption is justified because the pricing methods use the results of PSA ICER and PSA ICUR generated CEACs and were affected by the probabilistic values of all model inputs. Thus, the price estimation at the three certainty levels takes into consideration the randomness of all CEA and CUA model inputs.
Proof-of-concept: application to osimertinib in NSCLC with EGFR mutation
As an application of this proposed first pricing dimension, and to be carried through in the studies on the other dimensions, we applied the methodology described herein to a proof-of-concept price assessment for osimertinib, a third generation irreversible EGFR tyrosine kinase inhibitor (EGFR-TKI) in the setting of NSCLC. Osimertinib was approved in 2018 on the basis of the results of the FLAURA clinical trialCitation10 and priced at approximately double the first- and second-generation EGFR-TKIs gefitinib, erlotinib, and afatinibCitation11. In our price assessment for osimertinib, clinical trial data were collected from the FLAURA clinical trial and used to perform CEA and CUA. In the FLAURA clinical trial, head-to-head clinical comparisons were made among osimertinib, gefitinib and erlotinib, with the latter two treatments considered the standard of care (SOC). The FLAURA trial significantly favored osimertinib over the SOC. The hazard ratio for overall survival (OS) was 0.63 (95%CI = 0.45–0.88) for osimertinib versus SOC. The median progression-free survival (PFS) was 18.9 months for osimertinib versus 10.2 months with SOC; the hazard ratio for PFS was 0.46 (95%CI = 0.37–0.57) for osimertinib versus SOC. The FLAURA clinical trial did not include afatinib, which was (and still is) not a widely used option for NSCLC patients with EGFR mutation.
Model inputs
A 15-year Markov model was constructed by using the FLAURA study populations for osimertinib and SOCCitation10. Kaplan–Meier curves for OS and PFS were digitized and best fit the Weibull distributions per the Akaike Information Criterion. Cost (WAC) data for osimertinib and SOC were retrieved from RedBook in 2018 U.S. dollarsCitation11. The cost of disease progressionCitation12, monitoringCitation13, adverse event managementCitation14,Citation15, and utility and disutility valuesCitation13,Citation16 were from published data (). A discounting rate of 3.5% was applied. Furthermore, the seasonally adjusted medical consumer price index (mCPI) specific to prescription drugs in the USA, was obtained from the Bureau of Labor StatisticsCitation7 and was projected to increase by 0.44% during the 1-year contract in 2019–2020 and by 0.72% during the 2-year contract in 2019–2021 ().
Table 1. Model inputs.
Analysis
Price assessment for osimertinib was performed in this dimension and then applied to the two-hypothetical outcome-based contracts of one year (2019–2020) and two years’ (2019–2021) of duration. In our analysis, the results of the PSA ICER and PSA ICUR-generated CEACs were used to provide six possible prices for osimertinib as based on certainty levels as described above. These prices were inflated as needed for the 1-year contract in 2019–2020 and the 2-year contract in 2019–2021. Note that the resulting prices are fixed for a given contract and apply to a 30-day osimertinib prescription.
The six price estimates constituted a price pool for which the dimensional average and SD were calculated and used to find the alpha and beta distributional functions. Next, a gamma distribution was specified to represent the prices at the dimensional level. MCS with 2,000 iterations was performed to generate a random price at the dimensional level (i.e. DSP). Analyses were performed in Microsoft Excel 365Footnotei with MSO supported coding of Visual Basic for applications. Results were populated with base case analysis and PSA results for the ICER and ICUR values. CEAC curves were generated on the basis of the results of the PSA.
Results
Cost-effectiveness analysis and cost-utility analysis
The CEA and CUA (), estimated a gain of 5.67 LYs and 2.91 QALYs at a 15-year cost of $714,826 for osimertinib compared to again of 3.22 Lys and 1.68 QALYs at a 15-year cost of $465,660 for SOC. The resultant base case ICER was $101,700/LY gained and the resultant base case ICUR was $202,574/QALY gained. The PSA ICER confirmed the base case ICER at $98,652/LY gained and the PSA ICUR confirmed the base case ICUR results at $194,538/QALY gained. The cost-effectiveness planes were plotted and are provided as supplemental material (Supplementary Figures S1 and S2).
Table 2. Results of cost-effectiveness and cost-utility analyses.
Cost-effectiveness analysis and cost-utility analysis-based pricing
Of note, the analytics for this dimension were based on PSA. The turning point was estimated at 50% certainty in both PSA ICER and PSA ICUR-generated CEACs. The PSA ICER-generated CEAC is depicted in to represent PSA ICER at three levels of certainty: $0/LY at 0% certainty, $98,652/LY at 50% certainty, and $280,000/LY at 100% certainty. On the basis of the ratio calculation and the marketed drug price at 50% certainty as a reference, the resultant prices of osimertinib () were calculated and inflated as follows: for a 1-year contract (2019–2020), $0, $14,680 and $41,666 at 0%, 50% and 100% certainty levels, respectively; for a 2-year contract (2019–2021), $0, $14,721 and $41,782 at 0%, 50% and 100% certainty levels, respectively.
Figure 2. Cost-effectiveness acceptability curves (CEAC). (A) PSA ICER-generated CEAC; (B) PSA ICUR-generated CEAC.
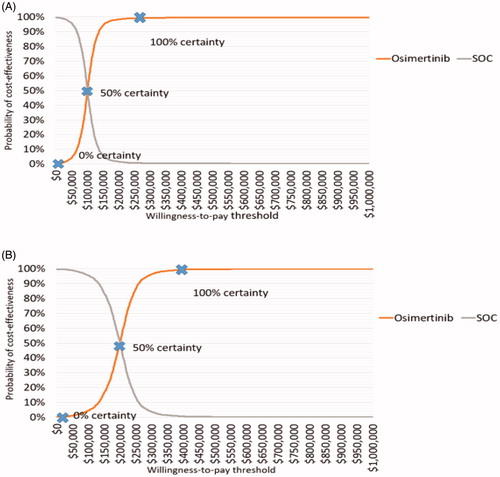
Table 3. Prices of osimertinib suggested per two hypothetical contracts (2019–2020 and 2019–2021).
Similarly, shows the PSA ICUR-generated CEAC with the following ICUR-matched certainty levels: $0/QALY at 0% certainty, $194,538/QALY at 50% certainty, and $372,000/QALY at 100% certainty. The resultant prices of osimertinib () were calculated and inflated as follows: for a 1-year contract (2019–2020), $0, $14,680 and $28,072 at 0%,50% and 100% certainty levels, respectively; for a 2-year contract (2019–2021), $0, $14,721 and $28,150 at 0%, 50% and 100% certainty levels, respectively.
For the 1-year contract, the six prices for osimertinib averaged $16,516 (SD=$16,238). The MCS estimated the DSPCEA/CUA of $16,391 (+12.14% over the 2018 U.S. osimertinib price). For the 2-year contract, the six prices for osimertinib averaged $16,562 (SD=$16,283). The MCS yielded a DSPCEA/CUA of $16,677 (+14.10% over the 2018 U.S. osimertinib price).
Discussion
The usefulness of CEA and CUA as viable pricing tools in the USA is a matter of debateCitation17; mainly because of the uncertainty associated with conventional CEA and CUA results and the heterogeneity in willingness-to-pay limits. It is important to consider that the current pricing methods of CEA and CUA applies two approaches: whether to negotiate the price of treatment at turning point% certainty level, which represents the same marketed price point used in the CEA and CUA models; or performing one-way sensitivity analyses to estimate prices at specific willingness-to-pay thresholds. Within our initiative, we provide two pricing methods using conventional CEA and CUA. Dimension 1 (presented in this paper) considers the uncertainty of PSA results for pricing not only at turning point% certainty but also at 0% and 100%. Dimension 2 (presented in a subsequent paper) considers the heterogeneity of willingness-to-pay thresholds.
In the first dimension of our platform, the aim was to create random patterns of price variation. In economic theory, random patterns of price variation are applied when only imperfect knowledge – and thus uncertainty – is available about a product. In this approach, different product prices are suggested under various levels of uncertainty, until less uncertain information becomes available and can be used for pricing. As more information becomes available, price variation shows different but more predictable patterns compared to the random patternCitation18,Citation19. Conceptually, in our analysis, a random pattern of pricing was justified given the imperfect and relatively uncertain knowledge provided by CEA and CUA. Further, these price variations were created under the assumption of linearity between three levels of uncertainty in the PSA ICER or PSA ICUR estimated drug prices. This is because the PSA ICER and the PSA ICUR were linked to changes in price scenarios suggested in the model. In our model, increasing certainty levels will result in higher prices because price points at 0% and 100% were estimated based on the price point at turning point (at 50% in our proof-of-concept). This assumption is important and represents the need for a payer to estimate the price of a treatment by considering no certainty (0% level) and full certainty in the model inputs (100%).
Note that the 100% certainty PSA ICER suggested a higher price than the 100% certainty PSA ICUR. This is because the full certainty in LY-based ICER can be achieved at lower willingness-to-pay than in QALY-based ICUR at the same full certainty level. The ICUR is a special case of the ICER in which utility values are used to adjust the clinical effect of interest; whereas only the clinical effect is of interest in the case of ICER. This explains why in the PSA ICER-generated CEAC the ranges for price scenarios are wider than those for the PSA ICUR-generated CEAC; for 1-year contract, $0 to $41,666 versus $0 to $28,072; for the 2-year contract, $0 to $41,782 versus $0 to $28,150.
After integration and MCS of the PSA ICER and PSA ICUR-suggested prices, the 1-year contract proposed an increase of +12.14% of the 2018 price of osimertinib, yielding a DSPCEA/CUA at $16,391 for a 30-day prescription. The 2-year contract proposed an increase of +14.10% of the 2018 price of osimertinib, suggesting a DSPCEA/CUA of $16,677 for a 30-day prescription. The 1.96% difference between the 1-year price and 2-year price can be justified by the effect of price inflation in price scenarios.
The strengths of this first dimension, as the starting dimension in our framework, are threefold. First, we developed a supportive methodology that reduces the uncertainty of pricing methods by adopting conventional pharmacoeconomic evaluations. This practice has been recommended by ISPOR in their proposed framework for cost-effectiveness analysisCitation20. We did not limit the analyses to the PSA ICUR-generated CEAC as done in conventional pharmacoeconomic evaluation for pricing. Instead, we also considered the PSA ICER-generated CEAC to offer more price variations. Traditionally, PSA ICUR-generated CEAC is used only to provide a certainty assessment of a drug’s superiority over other(s). However, from a U.S. perspective, this conventional assessment has been questioned in terms of the validity and generalizability of ICURCitation17. ICUR-included QALYs are not accepted for price assessment by some payers in the USA and are excluded from legislation such as the Affordable Care ActCitation17,Citation21. Equal inclusion of the LY term and QALY term in pricing may help to reduce the uncertainty of traditional pricing methods that use the QALY term only.
Second, this first dimension improves the information for decision making. If the decision to adopt and/or to fund a treatment is made at the turning point% certainty level, price negotiations will be around the price point used in the CEA and CUA. This ignores the possibility that inputs were not accurate at all (0% certainty level) or totally accurate (100% certainty level).
Third, The DSP presented in this study cannot be considered as the ultimate price point estimate. As we show in the other forthcoming papers related to our platform, we aim to integrate the prices generated from this dimension with those from other dimensions to estimate the ADP. This ADP reflects a higher price dispersion than integrating prices at dimensional level.
Our study has limitations. First, the accuracy of prices generated is dependent on the accuracy of CEA and CUA performed. A similar pharmacoeconomic evaluation of osimertinib and SOC by Aguiar et al.Citation13showed a higher base case ICUR of $225,841 per QALY gained compared to our estimate of $202,574 per QALY gained. This difference may be explained by two major methodological differences between Aguiar et al. and this study. Aguiar et al. assumed a 10-year time horizon and median PFS as the treatment duration. In contrast, we adopted the methodology of CEA and CUA to evaluate the cost-effectiveness of osimertinib per the National Institute for Health and Excellence (NICE) in UKCitation22. As recommended and optimized by NICE, the time horizon assumed 15 years, and treatments were given until progression or death. Further, Aguiar et al. did not perform a PSA. The study was limited to one-way sensitivity analyses in which uncertainty was assessed in a select set of inputs. Our analysis included PSA, in which uncertainty was assessed for all model inputs.
Second, some limitations are inherent to cost-effectiveness and cost-utility methods in general. These methods vary considerably in the literature; the interpretation of ICER, ICUR, CEAC results, and sampling error-based distributions are not straightforward results are explained differently based on payers’ WTPCitation23. Further, the probability of a treatment to be cost-effective increases as WTP threshold levels increase and the poor ceiling of the CEAC can potentially limit the use of our suggested methodCitation23. Certainty at 100% may not be always achieved and an additional approach that takes the efficacy endpoints into consideration, as we propose in dimension 5 of the Six Delta platform in which risk of efficacy failure is estimated to suggest pricingCitation24.
Third, the number of iterations in the MCS can be challenged. Though admittedly arbitrary, the threshold of 2,000 iterations in our analysis proved to be adequate as no significant fluctuation in the results was observed when the number of iterations exceeded 2,000. Technical details are provided in supplemental material.
Fourth, our study used clinical trial data to provide a price assessment in the proof-of-concept. The price elasticity shown in this proof-of-concept may not address the effects of real-world oncology practice. We adjusted for this by considering the random pattern of price variation because of the imperfect information given by the clinical trial data. Such a pattern can be adopted for pricing for short-term contractsCitation18,Citation19. Replication with real-world data are needed to provide more robust patterns of price dispersion. Payers or/and drug manufacturers may use clinical trial data for pricing purposes for short-term contracting until real-world data become available. For future application, we encourage readers to review the Form of Model Inputs Selection (supplemental material). Future pricing attempts should involve greater price dispersions based on different attributes, assumptions and scenarios; all of which may reflect the real market dynamics and interests of patients, payers and drug manufacturers.
Conclusion
Price variation based on different scenarios and statistical assumptions can reduce the uncertainty of CEA and CUA-based pricing. Results can be further improved by integrating the CEA and CUA price assessments with other dimensions that reflect more assumptions and interests, as we will show in other papers in this series. In the interim, we demonstrated that conventional CEA and CUA methods generate price estimates at varying levels of certainty that can be integrated into our proposed six-dimensional platform for outcome-based contracting.
Transparency
Declaration of funding
The work reported herein was performed without sponsorship or grant funding.
Declaration of financial/other relationships
The authors have no financial relationships to declare.
JME peer reviewers on this manuscript have no relevant financial or other relationships to disclose.
Author contributions
All named authors meet the International Committee of Medical Journal Editors (ICMJE) criteria for authorship of this manuscript.
JME-2020-0093-RT.R1_SUPPLEMENT_CATS.docx
Download MS Word (3.7 MB)Acknowledgements
No assistance was received in the preparation of this article.
Notes
i Microsoft Excel 365 is a registered trademark of Microsoft Research Lab, Redmond, Washington, DC, USA.
References
- Kaltenboeck A, Bach P. Value-based pricing for drugs: theme and variations. JAMA. 2018;319:2165–2166.
- Mailankody S, Bach PB. Money-back guarantees for expensive drugs: wolf’s clothing but a sheep underneath. Ann Intern Med. 2018;168:888–889.
- Garrison LP, Towse A, Briggs A, et al. Performance-based risk-sharing arrangements-good practices for design, implementation, and evaluation: report of the ISPOR good practices for performance-based risk-sharing arrangements task force. Value Health. 2013;16:703–719.
- Claxton K, Briggs A, Buxton MJ, et al. Value based pricing for NHS drugs: an opportunity not to be missed? BMJ. 2008;336:251–254.
- Drummond M, Sculpher MJ, Claxton K, et al. Methods for the economic evaluation of health care programmes. 4th ed. New York (NY): Oxford University Press; 2015.
- Fenwick E, Marshall DA, Levy AR, et al. Using and interpreting cost-effectiveness acceptability curves: an example using data from a trial of management strategies for atrial fibrillation. BMC Health Serv Res. 2006;6:52.
- U.S. Bureau of Labor Statistics. Prescription drugs in U.S. city average, all urban consumers, seasonally adjusted. [accessed December 2019]. Available from: https://data.bls.gov/timeseries/CUSR0000SEMF01?output_view=pct_3mths
- Campbell MK, Torgerson DJ. Bootstrapping: estimating confidence intervals for cost-effectiveness ratios. QJM. 1999;92:177–182.
- Briggs A, Claxton K, Sculpher M. Decision modelling for health economic evaluation. New York (NY): Oxford University Press; 2011.
- Soria J, Ohe Y, Vansteenkiste J, et al. Osimertinib in untreated EGFR-mutated advanced non–small-cell lung cancer. N Engl J Med. 2018;378:113–125.
- RedBook Online [subscription database online]. Greenwood Village (CO): Truven Health Analytics. [accessed December 2019, updated periodically]. Available from: http://micromedex.com/products/product-suites/clinical-knowledge/redbook
- Skinner KE, Fernandes AW, Walker MS, et al. Healthcare costs in patients with advanced non-small cell lung cancer and disease progression during targeted therapy: a real-world observational study. J Med Econ. 2018;21:192–200.
- Aguiar J, Pedro N, Haaland B, et al. cost-effectiveness of osimertinib in the first-line treatment of patients with EGFR-mutated advanced Non-Small Cell Lung Cancer. JAMA Oncol. 2018;4:1080–1084.
- Ting J, Tien Ho P, Xiang P, et al. Cost-effectiveness and value of information of erlotinib, afatinib, and cisplatin-pemetrexed for first-line treatment of advanced EGFR mutation-positive non-small-cell lung cancer in the united states. Value Health. 2015;18:774–782.
- Roy A, Kish JK, Bloudek L, et al. Estimating the costs of therapy in patients with relapsed and/or refractory multiple myeloma: a model framework. Am Health Drug Benefits. 2015;8:204–215.
- Nafees B, Stafford M, Gavriel S, et al. Health state utilities for non small cell lung cancer. Health Qual Life Outcomes. 2008;6:84.
- Burkholder R, Dougherty JS, Neves LA. ISPOR’s initiative on US value assessment frameworks: an industry perspective. Value Health. 2018; 21:173–175.
- Griffith D. Four types of price variation. Laramie (WY); March 2013. [accessed December 2019]. Available from: http://www.uwagec.org/rightrisk/presentations/2013_03_26_DGriffithMarketing/1_Introduction/1_FourTypesPriceVariation.pdf
- Bodoh-Creed A, Boehnke J, Hickman B. Using machine learning to predict price dispersion. Scholars at Harvard. [accessed December 2019]. Available from: https://scholar.harvard.edu/files/boehnke/files/bcbh_machine_learning_price_dispersion.pdf
- Lakdawalla DN, Doshi JA, Garrison LP, Jr, et al. Defining elements of value in health care-a health economics approach: an ISPOR special task force report [3]. Value Health. 2018;21:131–139.
- Office of the Legislative Counsel. Patient protection and affordable care act, 42 U.S.C § 18001 2010. USA; 2010 [accessed December 2019]. Available from: https://www.hhs.gov/sites/default/files/ppacacon.pdf
- Bertranou E, Bodnar C, Dansk V, et al. Cost-effectiveness of osimertinib in the UK for advanced EGFR-T790M non-small cell lung cancer. J Med Econ. 2018;21:113–121.
- Weintraub WS, Cohen JD. The limits of cost-effectiveness analysis. Circ Cardiovasc Qual Outcomes. 2009;2:55–58.
- Alkhatib NS, McBride A, Bhattacharjee S, et al. Pricing methods in outcome-based contracting-δ5: risk of efficacy failure-based pricing. J Med Econ. 2020;23(11):1246–1255.