
Abstract
Context: Echinacea (Asteraceae) is used because of its pharmacological properties. However, there are few studies that integrate phytochemical analyses with pharmacological effects.
Objective: Evaluate the chemical profile and biological activity of hydroalcoholic Echinacea extracts.
Materials and methods: Density, dry matter, phenols (Folin–Ciocalteu method), flavonoids (AlCl3 method), alkylamides (GC-MS analysis), antioxidant capacity (DPPH and ABTS methods), antiproliferative effect (SRB assay), anti-inflammatory effect (paw oedema assay, 11 days/Wistar rats; 0.4 mL/kg) and hypoglycaemic effect (33 days/Wistar rats; 0.4 mL/kg) were determined in three Echinacea extracts which were labelled as A, B and C (A, roots of Echinacea purpurea L. Moench; B, roots, leaves, flowers and seeds of Echinacea purpurea; C, aerial parts and roots of Echinacea purpurea and roots of Echinacea angustifolia DC).
Results: Extract C showed higher density (0.97 g/mL), dry matter (0.23 g/mL), phenols (137.5 ± 2.3 mEAG/mL), flavonoids (0.62 ± 0.02 mEQ/mL), and caffeic acid (0.048 mg/L) compared to A and B. A, B presented 11 alkylamides, whereas C presented those 11 and three more. B decreased the oedema (40%) on day 2 similar to indomethacin. A and C showed hypoglycaemic activity similar to glibenclamide. Antiproliferative effect was only detected for C (IC50 270 μg/mL; 8171 μg/mL; 9338 μg/mL in HeLa, MCF-7, HCT-15, respectively).
Discussion and conclusion: The difference in the chemical and pharmacological properties among extracts highlights the need to consider strategies and policies for standardization of commercial herbal extracts in order to guarantee the safety and identity of this type of products.
Keywords:
Introduction
In order to meet their basic needs, man has always maintained a close relationship with plants. This relationship resulted in the emergence of indigenous and traditional medicine (Koehn & Carter Citation2005; Jones et al. Citation2006). Traditional medicine continues to play an important role in continents such as Africa, Asia and America. The World Health Organization (WHO) has paid attention to the success achieved by Eastern countries such as China, where medicinal plants were incorporated into the official medicine, resulting in their clinical evaluation (Aarland et al. Citation2014). In this regard, in recent years the Food and Drug Administration (FDA) has approved three treatments based on herbal mixtures that includes antiallergenic, anticancer and antipsoriatic drugs (Newman & Cragg Citation2012, Citation2016).
However, even with this background, one of the main problems that hinder the inclusion of medicinal plants in the National and International Pharmacopoeias, is the lack of studies that validate their use through the chemical and pharmacological description of the mixtures used in the final extracts (Pokorny & Schmidt Citation2001; Nindo et al. Citation2003; Hossain et al. Citation2010; Gupta et al. Citation2011). Our research group proposes that an important step in order to develop phytopharmaceutical products from medicinal plants is the standardization of the extracts. This standardization process is important since it allows having a product with the same physical and chemical characteristics, assuring the same pharmacological effect. shows the proposed method, the same that was taken as the basis for the development of this study (Aarland et al. Citation2014).
Table 1. Study design.
The first reports of the use of the plants belonging to the genus Echinacea (Asteraceae) date to the beginning of the twentieth century, currently the sales associated with the hydroalcoholic extracts of Echinacea purpurea (L.) Moench, Echinacea pallida (Nutt.) Nutt. and Echinacea angustifolia DC. reach 21 million dollars in the USA (Blumenthal et al. Citation2005). Sales data in combination with its pharmacological properties make Echinacea an interesting study model to apply the methodology of standardization described earlier in .
Ethnobotanical studies made by WHO refer among the documented empirical uses of Echinacea, its use against snakebites, to heal wounds and as a primitive antibiotic (World Health Organization Citation1999). In pharmacological studies validated experimentally and published in specialized literature, there are reports of antiviral, anticancer activity, and immunomodulatory effects (Chicca et al. Citation2007; Pellati et al. Citation2011; Kim et al. Citation2014; Dong et al. Citation2015). In 2008, a study with commercial Echinacea extracts revealed activities against human pathogenic bacteria (Sharma et al. Citation2008) and recently, a study conducted in Norwegian mothers revealed no risk of malformations or adverse pregnancy outcomes after the use of Echinacea in pregnancy (Heitmann et al. Citation2016). In relation to the chemical studies, several metabolites such as caffeic acid, chlorogenic acid and alkylamides have been described as the possible responsible for its biological activity (Kumar & Ramaiah Citation2011). Glycoproteins, alkylamides and polysaccharides in roots of E. purpurea are chemical compounds that are responsible for their immunomodulatory properties (Balciunaite et al. Citation2015). It is important to mention that the chemical and pharmacological analyses carried out for these plants were executed in independent studies, so the active ingredients and its pharmacological action cannot be correlated directly, hence the main objective of this work was to carry out a comparative study of three commercial extracts of Echinacea, quantifying the major chemical constituents in each one and, in parallel, to determine in vivo anti-inflammatory and hypoglycaemic effects, as well as in vitro antiproliferative effect.
Materials and methods
Biological material and experimental set up
Three commercial hydroalcoholic Echinacea extracts were evaluated; these extracts were obtained from certified trading houses which are subjected to trademarks. These Echinacea hydroalcoholic extracts will be denoted as A, B and C extracts. According to the product label summary, A was prepared with roots of Echinacea purpurea; B with roots, leaves, flowers and seeds of Echinacea purpurea and C with aerial parts and roots of Echinacea purpurea and roots of Echinacea angustifolia.
This study included physical, chemical and biological analyses. The amount of dry matter and the density of the extracts were determined for physical analysis. Qualitative and quantitative determinations were carried out in the chemical analysis. The presence of saponins, anthraquinones, alkaloids, coumarins, and tannins were determined qualitatively. The compounds determined quantitatively were: total phenolics, total flavonoids, caffeic and chlorogenic acids, sugars and alkylamides as described below. Finally, for the analysis of the biological activity the antioxidant capacity was determined by DPPH and ABTS·+ methods, and the anti-inflammatory effect, the hypoglycaemic potential, and the antiproliferative effect were evaluated.
Physical analysis of the extracts
Density
The density of the extracts was determined using a pycnometer equipped with a thermometer. First, the empty pycnometer was weighed, then filled with distilled water and weighed again. Finally, the pycnometer was filled with each Echinacea extract and weighed. Density was calculated using the following formula: ρextract = [W(pycnometer + extract)−Wpycnometer]/[W(pycnometer + water) −Wpycnometer] [ρwater].
Dry matter
To determine the amount of dry matter in the extracts, 10 mL of the studied extract were dried by evaporation to constant weight in sterile conditions using a fume hood at room temperature (25 ± 2 °C). Then, the dry matter was weighed and expressed as grams of dry matter per mL of extract.
Identification and quantification of alcohol present in the extracts
For the determination of the type of alcohol used in the formulation of the commercial extracts, each extract was analyzed with 1H-NMR, obtaining the spectrum from each of the samples. The proportion of alcohol in the sample was determined by the same protocol used for the determination of sugars described below.
UV/Vis spectrum
A Jenway UV/Vis spectrophotometer was used to obtain the absorption spectra of the extracts. The spectrum of each extract in the wavelength range from 190 to 1100 nm was evaluated.
Chemical analysis of the extracts
Qualitative analysis
Determination of saponins
To determine the presence of saponins in the extracts of Echinacea, the technique described by Coolborn and Bolatito (Citation2010) was followed. Dried extract (0.02 g) was placed in a tube containing 10 mL of distilled water, then incubated in a water bath at 80 °C during 30 min. Afterwards, the tube was allowed to cool at room temperature, stirred vigorously and left to stand for 15 to 20 min. The presence and level of saponins were assessed by measuring the height of the foam formed.
Determination of anthraquinones
Determination of anthraquinones was carried out using the method of thin layer chromatography. Silica gel plates 60F254 of 3 × 5 cm were cut and an aliquot (0.1 mL) of each Echinacea extract was applied. The eluent mixture consisted of dichloromethane and methanol 95:5 (v/v). Yellow or red fluorescent spots under UV-light indicated the presence of anthraquinones (Coolborn & Bolatito Citation2010).
Determination of alkaloids
An aliquot of 0.1 mL of each Echinacea extract was applied on silica gel 60F254 plates (3 × 5 cm). Plates were eluted with the same mixture used for anthraquinones and revealed with the Dragendorff reagent. Formation of red-brown spots indicated the presence of alkaloids (Coolborn & Bolatito Citation2010).
Determination of tannins
Each extract (0.02 g) was dissolved in 10 mL of distilled water. The solution was divided into three test tubes and treated with: a gelatin solution 1% (w/v) in test tube number 1; a gelatin-salt reagent (1 g of gelatin and 10 g of NaCl dissolved in 100 mL of distilled water) in test tube number 2; saline solution [NaCl 10% (w/v)] in test tube number 3. The appearance of a white precipitate in test tubes number 1 & 2 and the absence of such precipitate in test tube number 3 indicated the presence of tannins (Coolborn & Bolatito Citation2010).
Determination of coumarins
Each extract (0.02 g) was added to 10 mL of distilled water in test tubes. These test tubes were covered with filter paper moistened in a caustic soda solution (1 g in 15 mL) and heated until boiling point. After 5 min, the filter paper was removed from the tube, dried and exposed to UV-light. Blue fluorescence indicated the presence of volatile coumarins (Coolborn & Bolatito Citation2010).
Quantitative chemical analysis
Total phenols by spectroscopic analysis
The content of total phenolic compounds was determined using the Folin–Ciocalteu reagent as described by Singlenton and Rossi (Citation1965). An aliquot of 200 μL of the hydroalcoholic extracts of Echinacea was diluted with methanol 80% (v/v). This dilution was mixed with 1 mL of Folin–Ciocalteu reagent (previously diluted with water 1:10 (v/v)) and incubated for 1 min at room temperature, added 0.8 mL of sodium carbonate 7.5% (w/v) were added. The reaction mixture was incubated for 1 h at room temperature and subsequently the absorbance was determined at 765 nm. The standard curve was prepared with gallic acid, concentrations ranging from 0 to 200 μM. The results were expressed as mg gallic acid equivalent per mL of each extract.
Total flavonoids by spectroscopic analysis
Total flavonoids were determined using the colorimetric method of aluminum chloride described by Chang et al. (Citation2002). Each hydroalcoholic Echinacea extract (0.5 mL) was mixed with 1.5 mL of 95% ethanol (v/v), 0.1 mL of 10% aluminum chloride (w/v), 0.1 mL of 1 M potassium acetate and 2.8 mL of distilled water. The mixture was incubated at room temperature for 30 min and the absorbance was determined at 415 nm. The standard curve was prepared with quercetin, concentrations ranging from 10 to 100 μg/mL. The results were expressed as mg quercetin equivalent per mL of each extract.
Determination of chlorogenic acid and caffeic acid by HPLC analysis
The determination of these two polyphenols was carried out by high performance liquid chromatography (HPLC), using the technique described by Pellati et al. (Citation2011). The extracts were filtered through 0.45 μm nylon filters. Afterwards, these filters were analyzed microscopically. The filtrate (20 μL) was injected into an HPLC system (Agilent Technology 1260) consisting of a vacuum degasser, quaternary pump, autosampler, thermostatted column compartment and a Multiple Wavelength Detector (MWD). The chromatograms were recorded using Agilent OpenLab EZChrom 2014 Chemstation software. The analyses were carried out on waters μBondapak C18 column (10 μm, 3.9 × 300 mm) using water and acetonitrile mixture as the mobile phase in gradient elution mode. The mobile phase was composed of 0.1% (v/v) acetic acid in MilliQ water (A) and acetonitrile HPLC grade (B). The elution gradient was modified as follows: initial 15% B; from 15 to 30% B for 10 min; from 30 to 65% B for 8 min; from 65 to 80% B for 7 min; from 80 to 90% B for 5 min and 90% B isocratically for 5 min. The postrunning time was 3 min. The flow rate was 1 mL min−1 and the column temperature was set at 30 °C. The results were recorded at 320 nm, and they were interpolated in a standard curve of caffeic or chlorogenic acid (0.05–100 ppm). Results were expressed as ppm g−1 dry weight.
Determination of sugars by HPLC
Each extract was filtered through 0.45 μm nylon filters (Millex, Millipore, Bedford, VA). The filtrate (20 μL) was injected into the HPLC system mentioned above. The analyses were carried out on an Agilent Hi-Plex Ca column (8% crosslinked, 7.7 × 300 mm, 8 μm) using MilliQ water as the mobile phase in an isocratic mode. The flow rate was 0.6 mL min−1 and the column temperature was set at 85 °C. Results were expressed as ppm sugar determined g−1 of dry weight.
Determination of the alkylamides by GC-MS analysis
Lipophilic fraction of the hydroalcoholic Echinacea extracts was obtained to analyze its constituents, mainly alkylamides. Liquid–liquid extraction was carried out; 10 mL of each one of the hydroalcoholic extracts was subjected to threefold extraction with 20 ml n-hexane-ethyl acetate (1:1 v/v) in a separation funnel. The organic phases of each extraction were collected and concentrated in a rotatory evaporator and filtered previously to the GC analysis. GC-MS spectra were recorded on an Agilent Technologies 6890N instrument (Santa Clara, CA) consisting of an Agilent Technologies 5975B mass-selective detector using a HP5MS column (30 m × 0.25 mm ×0.25 μm) and He as carrier gas (5 μL/min). The conditions for recording spectra and identifying constituents were similar to those published by Hudaib et al. (Citation2002). Compounds identification was performed with NIST MS Search software v 2.2, and with the EI mass spectra as reported by Bauer et al. (Citation1988).
Pharmacological assays
Determination of antioxidant capacity by the DPPH method
The method used to test the antioxidant capacity in three replicates of each hydroalcoholic Echinacea extract was based on the evaluation of the free radical scavenging capacity of the extracts according to the method described by Brand-Williams et al. (Citation1995). DDPH is a stable free radical and the assay can accommodate a large number of samples in a short period of time and it is sensitive enough to detect active principles at low concentrations. A solution of 0.1 mM DPPH (2,2-diphenyl-1-picrylhydrazyl) in methanol was prepared. An aliquot of 50 μL of trolox or hydroalcoholic extract was added to 950 μL of this solution. Diluted samples of the hydroalcoholic extract in 80% aqueous methanol (v/v) were used. The antioxidant activity was measured by decreasing the absorbance at 515 nm (Beckman DU-650, UV-Vis spectrophotometer, Brea, CA). The standard curve was prepared with trolox, concentrations ranging from 0 to 30 μM. The results were expressed as trolox equivalent antioxidant capacity (TEAC).
Determination of antioxidant capacity by the ABTS·+ method
This method is based on the evaluation of the free radical scavenging capacity of each hydroalcoholic Echinacea extracts, to reduce the radical cation ABTS·+ to ABTS according to the method described by Rivero-Pérez et al. (Citation2007). The radical was generated by the reaction of 7 mM solution of ABTS in deionized water with 2.45 mM K2S2O8 (1:1 v/v). The solution was held in darkness at room temperature for at least 16 h to obtain stable absorbance values at 734 nm. Subsequently, PBS buffer 1 X, pH 7.4 was used to set the absorbance of this solution at 0.7 (water as blank). An aliquot of 100 μL of trolox or each hydroalcoholic extract was added to 1000 μL of this solution. Diluted samples of each hydroalcoholic extract in PBS buffer 1 X, pH 7.4 were used. The antioxidant activity was measured by the decrease in the absorbance at 734 nm (Beckman DU-650, UV-Vis spectrophotometer, USA). The standard curve was prepared with trolox, concentrations ranging from 0 to 20 μM. The results were expressed as trolox equivalent antioxidant capacity (TEAC).
Determination of the carrageenan-induced paw edema anti-inflammatory in vivo model
Inflammation was induced in 40 male Wistar rats of 84 days of age with weights between 300 and 320 g, the treatment was administered ad libitum during 11 days, divided into the following groups (n = 8): negative control group (500 mL water per group), positive control group (indomethacin 10 mg/kg in 500 mL water per group), three Echinacea extract groups, one for each Echinacea extract was analyzed (1.66 mL of the hydroalcoholic extracts in 500 mL water, this corresponds to a daily dose of 0.4 mL of extract per kilogram of each group). Inflammation was induced in the right paw by a sub-plantar injection of 0.1 mL of carrageenan 1% (w/v) in saline solution 0.9% (w/v) (Cai et al. Citation2014). The change in the oedema was calculated by the difference of the measured diameter between the non-swollen left paw and right paw treated with carrageenan. This study was carried out every 24 h during 11 days. The animals were provided by the animal centre at Universidad Autónoma Metropolitana Unidad-Iztapalapa. The handling of the laboratory animals was performed in agreement with the statutes of the CICUAL (Institutional Committee for the Care and Use of the Animals) based in the international and national rules established in the ‘Official Mexican Rule’ for the care and use of the laboratory animals [NOM-062-ZOO-1999] (NOM Citation1999).
Determination of the hypoglycaemic potential in vivo model
Diabetes was induced in 40 male Wistar rats of 84 days of age with weights between 300 and 320 g by an intraperitoneal injection of alloxan monohydrate dissolved in 0.9% (w/v) saline solution at a dose of 130 mg/kg. One week after the injection, the glucose levels in blood samples obtained from rats’ tail were monitored using a manual glucometer (ECLIPSE Infopia, Korea) to corroborate that the rats were diabetic. The diabetic rats were divided randomly into the following groups (n = 8) for treatment during 33 days: negative control group (500 mL water per group), positive control group (5 mg/kg glibenclamide in 500 mL water per group), three Echinacea groups (1.66 mL of the hydroalcoholic extracts in 500 mL water, this corresponds to a daily dose of 0.4 mL of extract per kilogram of each group). Monitoring of glucose levels was performed every 72 h during 33 days. During the study animals were fed ad libitum (Shah & Khan Citation2014). Analysis of the data was conducted by comparison of means of the groups treated with the controls at 2, 6, and 12 days of treatment.
The animals were provided by the animal centre at Universidad Autónoma Metropolitana Unidad-Iztapalapa. The handling of the laboratory animals was performed in agreement with the statutes of the CICUAL (Institutional Committee for the Care and Use of the Animals) based on the international and national rules established in the ‘Official Mexican Rule’ for the care and use of the laboratory animals [NOM-062-ZOO-1999] (NOM Citation1999).
Antiproliferative effect in tumor cell lines
MCF-7, HeLa and HCT-15 cells were maintained in RMPI 1640 medium with 10% (w/v) fetal bovine serum and cultured at 37 °C in an atmosphere of 5% CO2 in air (100% humidity). Cells at log phase of growth cycle were treated in triplicate with five different concentrations of the biological dry material adjusted in DMSO (dry material was obtained by evaporating 1 mL of each Echinacea extract using a nitrogen flow), and incubated for 72 h at 37 °C in a 100% humidified atmosphere and 5% CO2. Cell growth was determined by the sulforhodamine B assay (SRB) in 96-well plates. Sulforhodamine B absorbance was measured at 564 nm. This colorimetric method expresses the percentage of proliferation in cells treated with the Echinacea extracts compared with a DMSO blank, using the following formula, % cell growth = (At-Ab)/(Ac-Ab) × 100, where At = absorbance value of treatment or positive control (colchicine) well, Ab = absorbance value of DMSO blank well, Ac = absorbance value of growth control well (Skehan et al. Citation1990; Mendoza-Espinoza et al. Citation2009; Campos-Lara & Mendoza-Espinoza Citation2011).
Statistical analysis
Statistical analysis was carried out using NCSS software (2007, update 2009, v07.1.18). Data were compared applying one-way ANOVA followed by Tukey’s multiple comparison tests. Values were considered as statistically significant at p < 0.05.
Results and discussion
Given that this study was performed with commercial Echinacea hydroalcoholic extracts, the presence of ethyl alcohol was determined by 1H-NMR and the proportion of this alcohol in the preparation was determined by HPLC. 0.45 μm nylon filters were analyzed microscopically and no abnormal particles were found. shows the percentage of ethyl alcohol detected in each extract. Qualitative and quantitative chemical analysis indicated that extract C prepared with E. purpurea and E. angustifolia is richer in phenols and total flavonoids (), this result correlates with the higher antioxidant activity found in the in vitro analyses of this extract (). The correlation between the content of phenols and total flavonoids with the antioxidant capacity has also been proposed by Kumar et al. (Citation2008) and Farasat et al. (Citation2014) in ten Indian medicinal plants and edible green seaweeds, respectively.
Table 2. Evaluation of physical and chemical parameters and biological activity of Echinacea extracts.
Gas chromatography analysis coupled to mass spectrometry (GC-MS) revealed the presence of at least 11 alkylamides in extracts A and B and 14 alkylamides in extract C (). The concentration and type of alkylamides depends on the Echinacea species, as well as the plant tissue. A previous study performed by Pellati et al. (Citation2011) using a similar extraction method in whole E. purpurea plants, reported 22 alkylamides in E. angustifolia and 17 in E. purpurea. Mudge et al. (Citation2011) have reported that roots of E. angustifolia have a broader variety of alkylamides compared to the roots of E. purpurea which coincides with our results showing the detection of 11 alkylamides in extract A which is only constituted by E. purpurea roots, while in extract C (constituted of a mixture of roots of E. purpurea and E. angustifolia) 14 alkylamides were detected from which three are exclusive of E. angustfolia ( and ).
Figure 1. Total ion chromatogram (TIC) of the non-polar fractions of the analyzed hydroethanolic extracts: roots of E. purpurea (A), roots and aerial parts of E. purpurea (B) and roots, aerial parts of E. purpurea and roots of E. angustifolia (C). The identity of the detected peaks is shown in .
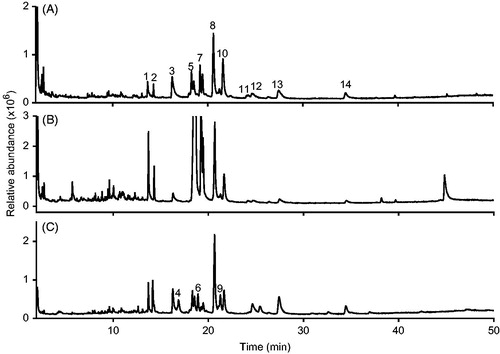
Table 3. Identity, retention times and presence of alkylamides on the non-polar fractions of three Echinacea extracts analyzed GC-MS.
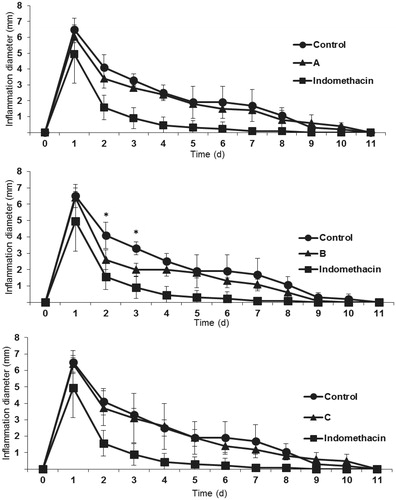
In the model of paw edema in male Wistar rats, extract B (elaborated from roots, leaves, flowers and seeds of Echinacea purpurea) showed a robust anti-inflammatory effect compared to the negative control on day 2 and 3; however, it was less powerful than the positive control (indomethacin) (see support material). It is important to note that the effect of this extract was observed until day 2 and 3 of the treatment, which may indicate that Echinacea extracts have an anti-inflammatory effect but slower than the indomethacin positive control. The other two extracts A and C, showed no significant differences compared to the negative control, which could indicate that the active metabolite for this activity is possibly located in the leaves of Echinacea purpurea and not in the root as it has been reported in some ethnobotanical studies of Echinacea (World Health Organization Citation1999). These results agree and support the study of the protective effect of Echinacea against hepatotoxicity caused by diethylnitrosamine, reported by Rezaie et al. (Citation2013) and the protective effect on induced colitis reported by Dogan et al. (Citation2014). The effect observed by these research groups can be attributed to the anti-inflammatory effect found on the present work; however, it has not been specifically determined in an in vivo anti-inflammatory study. The role of the alkylamides on this effect is not clear, since extract C (with the highest content of alkylamides) showed no anti-inflammatory effect. On the other hand, the anti-inflammatory activity may be due to the abundant presence of saponins observed in the qualitative analysis of extract B. Saponins are a group of heterogeneous secondary metabolites of plants and consist of triterpenoid or steroid aglycone moiety and complex oligosaccharide substituents. Among other properties, the saponins have been associated with anti-inflammatory activity in some Nigerian medicinal plants and in blue cohosh (Hassan et al. Citation2012; Lee et al. Citation2012). It is worth mentioning that on day 1, indomethacin had a significantly higher anti-inflammatory effect than the three evaluated extracts. Generally, this effect could be attributed to the fact that drugs contain higher concentrations of active principles compared with the content in herbal extracts.
A hypoglycaemic effect was observed for the three hydroalcoholic extracts, being extract A the most promising. The average glycemia of male Wistar rats treated with extract A was lower than the positive control (glibenclamide), while rats treated with extracts B and C showed similar average values between them and a similar tendency as the positive control along the experimental period ().
Table 4. Hypoglycaemic effect of the three extracts evaluated.
In relation to the antiproliferative effect, dry material was obtained by evaporating 1 mL of each extract using a nitrogen flow. IC50 (half inhibitory concentration) of A and B were above 30,000 μg/mL, while C showed values in the range from 500 to 10,000 μg/mL, being much more toxic for HeLa cell line and moderately toxic for HCT15 and MCF-7 cell lines. Antiproliferative effect of C may be attributable to the higher number of alkylamides detected by GC-MS analysis (). It is important to mention that these results correlate with the ability to inhibit the growth of human pancreatic cancer cell lines reported by Chicca et al. (Citation2007). The different antiproliferative effect observed in the extracts could be explained by the difference in the type and concentration of alkylamides. Usually, this kind of compounds is related with this biological effect.
UV spectra of the extracts were obtained () in order to have their chemical fingerprints. There is a high similarity among the spectral lines of the three analyzed extracts; therefore, the composition of the biological material present in the extracts could not be determined by this method.
Figure 2. Anti-inflammatory effect of Echinacea extracts (A–C) in the paw oedema model. *indicates significant differences at α = 0.05, n = 8.
Conclusion
There are differences in the physical, phytochemical and biological properties of the three evaluated commercial Echinacea extracts. In this study, 11 alkylamides were identified in extracts A and B and 14 alkylamides in extract C ( and ).
Only extract B showed an anti-inflammatory effect, which suggest that the active compound for this effect is probably present in the aerial part of E. purpurea. Even though extract C was also prepared with aerial parts of E. purpurea, no anti-inflammatory effect was observed. Probably, this is an effect of dilution of extract C which was prepared with two species of Echinacea (aerial parts and roots of E. purpurea and roots of E. angustifolia) and possibly masks the anti-inflammatory effect observed in extract B.
The hypoglycaemic effect found in the extracts A and C could be attributed to the roots of E. purpurea. The present work represents the first report where Echinacea is associated with this pharmacological effect. It would be interesting to perform specific studies to determine the bioactive compounds and to elucidate the mechanism of action of this effect.
A moderate antiproliferative effect was only observed in extract C; the effect correlates with the highest content of alkylamides found in the non-polar fraction of this hydroalcoholic extracts. The results presented here evidence the need to consider strategies and policies of standardization, not only aimed to guarantee the safety and identity of the botanical products, but also their pharmacological effect. It is important to note that the three evaluated extracts of Echinacea are recommended in a similar way; however, its chemical content and biological effects are very different as shown in the present work.
Acknowledgements
This work is part of Rayn Clarenc Aarland PhD. dissertation. We thank CONACYT (No. 248821) for financial support to Rayn C. Aarland during his PhD. studies (PNPC Experimental Biology Program). This work was partially financed by the Universidad Autónoma de la Ciudad de México and by the Universidad Autónoma Metropolitana-Iztapalapa with the projects (UAM-PTC-510) and PRODEP UAM-I-CA-26 (No. 14612582) and financial support of postdoctoral fellowship of Angel E. Bañuelos-Hernández.
Disclosure statement
The authors report no declarations of conflict of interest.
Additional information
Funding
References
- Aarland RC, Rivera-Cabrera F, Pérez-Flores LJ, Díaz de León Sánchez F, Mendoza-Espinoza JA. 2014. Relevance of chemical standardization and innocuousness in the process of development of herbal medicines: a review. Asian J Plant Sci. 13:1–7.
- Balciunaite G, Juodsnukyte J, Savickas A, Ragazinskiene O, Siatkute L, Zvirblyte G, et al. 2015. Fractionation and evaluation of proteins of Echinacea purpurea (L.) Moench. Acta Pharm. 65:473–479.
- Bauer R, Remiger P, Wagner H. 1988. Alkamides from the roots of Echinacea purpurea. Phytochemistry. 27:2339–2342.
- Blumenthal M, Cavaliere C, Ferrier G. 2005. Total sales of herbal supplements in United States show steady growth. HerbalGram. 71:64–66.
- Brand-Williams W, Cuvelier ME, Berset C. 1995. Use of free radical method to evaluate antioxidant activity. LWT Food Sci Technol. 28:25–30.
- Cai C, Chen Y, Zhong S, Ji B, Wang J, Bai X, Shi G. 2014. Anti-inflammatory activity of n-butanol extract from Ipomoea stolonifera in vivo and in vitro. PLoS One. 9:e95931
- Campos-Lara M, Mendoza-Espinoza JA. 2011. Cytotoxic evaluation of fluvastatin and rosuvastatin, and effect of fluvastatin in the Hela cell cycle. Afr J Pharm Phamacol. 5:189–193.
- Chang CC, Yang MH, Wen HM, Chern JC. 2002. Estimation of total flavonoid content in propolis by two complementary colorimetric methods. J Food Drug Anal. 10:178–182.
- Chicca A, Adinolfi B, Martinotti E, Fogli S, Breschi MC, Pellati F, et al. 2007. Cytotoxic effects of Echinacea root hexanic extracts on human cancer cell lines. J Ethnopharmacol. 110:148–153.
- Coolborn AF, Bolatito B. 2010. Antibacterial and phytochemical evaluation of three medicinal plants. J Nat Prod. 3:27–34.
- Dogan Z, Ergul B, Sarikaya M, Filik L, Gonulta? MA, Hucumenoglu S, Can M. 2014. The protective effect of Echinacea spp. (Echinacea angustifolia and Echinacea purpurea) in a rat colitis model induced by acetic acid. Pak J Pharm Sci. 27:1827–1835.
- Dong L, Wang H, Niu J, Zou M, Wu N, Yu D, et al. 2015. Echinacoside induces apoptotic cancer cell death by inhibiting the nucleotide pool sanitizing enzyme MTH1. Onco Targets Ther. 8:3649–3664.
- Farasat M, Khavari-Nejad RA, Nabavi SM, Namjooyan F. 2014. Antioxidant activity, total phenolics and flavonoid contents of some edible green seaweeds from northern coasts of the Persian Gulf. Iran J Pharm Res. 13:163–170.
- Gupta S, Cox S, Abu-Ghannam N. 2011. Effect of different drying temperatures on the moisture and phytochemical constituents of edible Irish brown seaweed. LWT Food Sci Technol. 44:1266–1272.
- Hassan H, Sule M, Musa A, Musa KY, Abubakar MS, Hassan AS. 2012. Anti-inflammatory activity of crude saponin extracts from five Nigerian medicinal plants. Afr J Tradit Complement Altern Med. 9:250–255.
- Heitmann K, Havnen GC, Holst L, Nordeng H. 2016. Pregnancy outcomes after prenatal exposure to Echinacea: The Norwegian Mother and Child Cohort Study. Eur J Clin Pharmacol. 72:623–630.
- Hossain MB, Barry-Ryan C, Martin-Diana AB, Brunton NP. 2010. Effect of drying method on the antioxidant capacity of six Lamiaceae herbs. Food Chem. 1:85–91.
- Hudaib M, Fiori J, Bellardi MG, Rubies-Autonell C, Cavrini V. 2002. GC-MS analysis of the lipophilic principles of Echinacea purpurea and evaluation of cucumber mosaic cucumovirus infection. J Pharm Biomed Anal. 29:1053–1060.
- Jones WP, Chin YW, Kinghorn AD. 2006. The role of pharmacognosy in modern medicine and pharmacy. Curr Drug Targets. 7:247–264.
- Kim HR, Oh SK, Lim W, Lee HK, Moon BI, Seoh JY. 2014. Immune enhancing effects of Echinacea purpurea root extract by reducing regulatory T cell number and function. Nat Prod Commun. 9:511–514.
- Koehn FE, Carter GT. 2005. The evolving role of natural products in drug discovery. Nat Rev Drug Discov. 4:206–220.
- Kumar AS, Mazumder A, Vanitha J, Sivakumar T. 2008. Evaluation of antioxidant activity, phenol and flavonoid contents of some selected Indian medicinal plants. Pharmacogn Mag. 4:143–147.
- Kumar KM, Ramaiah S. 2011. Pharmacological importance of Echinacea purpurea. Int J Pharm Biol Sci. 2:305–314.
- Lee Y, Jung J, Ali Z, Khan IA, Oh S. 2012. Anti-inflammatory effect of triterpene saponins isolated from Blue Cohosh (Caulophyllum thalictroides). Evid Based Complement Alternat Med. 2012:1–8.
- Mendoza-Espinoza JA, López-Vallejo F, Fragoso-Serrano M, Pereda-Miranda R, Cerda-García-Rojas CM. 2009. Structural reassignment, absolute configuration, and conformation of hypurticin, a highly flexible polyacyloxy-6-heptenyl-5,6-dihydro-2H-pyran-2-one. J Nat Prod. 72:700–708.
- Mudge E, Lopes-Lutz D, Brown P, Schieber A. 2011. Analysis of alkylamides in Echinacea plant materials and dietary supplements by ultrafast liquid chromatography with diode array and mass spectrometric detection. J Agric Food Chem. 59:8086–8094.
- Newman DJ, Cragg GM. 2012. Natural products as sources of new drugs over the 30 years from 1981 to 2010. J Nat Prod. 75:311–335.
- Newman DJ, Cragg GM. 2016. Natural products as sources of new drugs from 1981 to 2014. J Nat Prod. 79:629–661.
- Nindo CI, Sun T, Wang SW, Tang J, Powers JR. 2003. Evaluation of drying technologies for retention of physical quality and antioxidants in asparagus. LWT Food Sci Technol. 36:507–516.
- NORMA Oficial Mexicana NOM-062-ZOO-1999, Especificaciones técnicas para la producción, cuidado y uso de los animales de laboratorio [online]. Available at: http://www.fmvz.unam.mx/fmvz/principal/archivos/062ZOO.PDF. Accessed on 20 July 2014.
- Pellati F, Epifano F, Contaldo N, Orlandini G, Cavicchi L, Genovese S, et al. 2011. Chromatographic methods for metabolite profiling of virus- and phytoplasma-infected plants of Echinacea purpurea. J Agric Food Chem. 59:10425–10434.
- Pokorny J, Schmidt S. 2001. Natural antioxidant functionality during food processing. In: Pokorny J, Yanishlieva N, Gordon M, editor. Antioxidants in food: practical applications. Boca Raton FL: CRC Press LLC; p. 331–54.
- Rezaie A, Fazlara A, Karamolah MH, Shahriari A, Hossein HN, Pashmforosh M. 2013. Effects of Echinacea purpurea on hepatic and renal toxicity Induced by diethylmitrosamine in rats. Jundishapur J Nat Pharm Prod. 8:60–64.
- Rivero-Pérez MD, Muñiz P, González-Sanjosé ML. 2007. Antioxidant profile of red wines evaluated by total antioxidant capacity, scavenger activity, and biomarkers of oxidative stress methodologies. J Agric Food Chem. 55:5476–5483.
- Shah NA, Khan MR. 2014. Antidiabetic effect of Sida cordata in alloxan induced diabetic rats. Biomed Res Int. 2014:1–15.
- Sharma M, Vohra S, Arnason JT, Hudson JB. 2008. Echinacea extracts contain significant and selective activities against human pathogenic bacteria. Pharm Biol. 46:111–116.
- Singlenton VL, Rossi JA. 1965. Colorimetry of total phenolics with phosphomolybdic-phosphotungstic acid reagents. Amer J Enol Viticult. 16:144–158.
- Skehan P, Storeng R, Scudiero D, Monks A, McMahon J, Vistica D, et al. 1990. New colorimetric cytotoxicity assay for anticancer-drug screening. J Natl Cancer Inst. 82:1107–1112.
- World Health Organization. 1999. WHO monographs on selected medicinal plants, vol. 1. Malta: WHO.