
Abstract
Objective: To develop an algorithm that prescribes targets for bone conduction frequency response shape, compression, and output limiting, along with a clinical method that ensures accurate transforms between assessment and verification stages of the clinical workflow. Design: Technical report of target generation and validation. Study sample: We recruited 39 adult users of unilateral percutaneous bone conduction hearing aids with a range of unilateral, bilateral, mixed and conductive hearing losses across the sample. Results: The initial algorithm over-prescribed output compared to the user’s own settings in the low frequencies, but provided a good match to user settings in the high frequencies. Corrections to the targets were derived and implemented as a low-frequency cut aimed at improving acceptance of the wearer’s own voice during device use. Conclusions: The DSL-BCD prescriptive algorithm is compatible with verification of devices and fine-tuning to target for percutaneous bone conduction hearing devices that can be coupled to a skull simulator. Further study is needed to investigate the appropriateness of this prescriptive algorithm for other input levels, and for other clinical populations including those with single-sided deafness, bilateral devices, children and users of transcutaneous bone conduction hearing aids.
The desired sensation level prescriptive targets for bone conduction devices: adaptation and comparison to clinical fittings
Some people are unable to wear air conduction hearing aids for a variety of reasons (e.g. aural atresia, chronic ear disease; Håkansson et al, Citation1990; Snik et al, Citation2001). Assuming there is sufficient residual cochlear function in at least one ear, the alternative mode of sound delivery for these patients is bone conduction amplification through skull vibration. While there are many Bone Conduction Devices (BCD)1 available today, at the time of writing, the most common type of bone conduction amplification is the percutaneous BCD. BCDs consist of a sound processor connected via an abutment to a surgically implanted titanium screw in the parietal-mastoid region of a patient’s skull. Many BCD users do well with their devices; however, some patients fail to perform as well as might be expected based on their sensory neural hearing levels and/or the device output limitations (Snik et al, Citation2005). Even for those patients who are performing well, the current procedures often shed little light on what aspects of their hearing abilities or the hearing aid fitting have led to their success. Consequently, each patient serves as a mini experiment in fitting. In this paper, we present approaches to verification and prescription of BCD that are modelled closely on a validated Desired Sensation Level fitting method developed for air conduction hearing aids.
Current fitting and verification approaches
Current approaches to fitting BCDs vary from clinic to clinic. However, common elements of the fitting typically include: standard audiometric bone conduction thresholds, aided soundfield thresholds with the BCD in place, and outcome measures related to performance with the device (e.g. subjective questionnaires and/or aided speech testing). Standard bone conduction thresholds are used to select appropriate candidates and are also used to guide the selection of an appropriate sound processor for that individual. Aided soundfield thresholds are obtained to determine if the device is providing an appropriate aided response for that individual and outcome measures are used to validate the fitting. All hearing aid fitting should be validated with appropriate outcome measure. However, there are some limitations to using traditional bone conduction thresholds and aided soundfield thresholds for the verification of BCD that warrant consideration. These limitations are discussed in the following two sections.
Transcutaneous vs. percutaneous bone conduction
Traditional audiometric bone conduction thresholds are obtained with a headband through skin and subcutaneous tissue (transcutaneous), while the BCD is rigidly anchored to the skull via attachment to a bone-anchored abutment (percutaneous). Several researchers have explored the relationship between thresholds obtained on the same patient trans- and percutaneously (Håkansson et al, Citation1984; Håkansson et al, 1985; Mylanus et al, Citation1994; Stenfelt & Håkansson, Citation2002). On average, there is a significant advantage to delivering bone conduction sounds directly to the BCD abutment, particularly in the high frequencies. Unfortunately, the advantage of percutaneous thresholds over transcutaneous thresholds varies considerably from person to person and cannot be easily predicted (Mylanus et al, Citation1994). Consequently, transcutaneous threshold information does not necessarily represent a valid reference for comparison to aided percutaneous bone conduction hearing through the BCD abutment. Therefore, this paper presents fitting data based on audiometric information obtained directly through the BCD abutment once the implant is in place. Currently available BCDs from both manufacturers (Cochlear Corporation and Oticon Medical) offer in-situ threshold testing capabilities that allow the clinician to obtain percutaneous thresholds directly for each individual once the surgery is completed. The thresholds of interest for prescription and verification are those obtained after the implant has been installed. Clinicians will continue to struggle with some candidacy uncertainty based on the differences between trans- and percutaneous thresholds before the implant is installed.
Aided soundfield thresholds, and prescription with verification as an alternative
Aided soundfield thresholds are commonly used to verify surgically implanted hearing instruments such as BCD and cochlear implants. However, aided thresholds have significant limitations as a verification tool, especially when contrasted with more robust and objective measures available in hearing aid analysis equipment. There are noise floor effects that may make aided thresholds appear to be worse than expected (especially in the low frequencies), test re-test reliability errors imposed by movement of the listener, and validity limitations when testing hearing aids with nonlinear signal processing (see Hawkins (Citation2004) and McCreery (Citation2013) for reviews of these issues). One recent attempt to address some of these issues includes the development of HL-calibrated speech sounds for use in aided soundfield threshold evaluation (Scollie et al, Citation2012; Glista et al, Citation2014). However, even this more recently developed test can only inform the clinician about the hearing aid response to low-level inputs and provides no information regarding the maximum output of the device. For percutaneous BCDs, the use of aided thresholds as the primary means for judging device effectiveness has been described as “extremely inadequate and potentially misleading” (Dillon, Citation2012).
Rather than aided soundfield thresholds, the primary tool used to prescribe and verify performance of air conduction hearing aids is the measurement of in situ gain or output in the ear canal of the patient. These measures are standardised (e.g. ANSI, Citation1997), widely implemented, and recommended for routine use in clinical practice with adults (AAA, Citation2006) and in modified form with infants and children (AAA, Citation2013). In this approach, the ear canal levels of aided sound are compared to prescribed targets, and the device settings are adjusted to optimise the match to the individual’s target levels. This individualised approach to fine-tuning may be distinguished from non-individualised technical measures of hearing aids, in which the device is measured at standardised settings for the purposes of quality control.
Prescription and fine-tuning based on device verification provides patients with improved aided speech recognition scores, improves the consistency of outcomes across patients, sites, and clinicians, and provides a systematic approach to pre-calculation of hearing aid gain and nonlinearity (Stiles et al, Citation2012; McCreery et al, Citation2013; review by Bagatto et al, Citation2005). Without these tools, devices will be fitted using patient-driven procedures, which may require highly systematic approaches in order to be successful (Boymans & Dreschler, Citation2011). Even a successful patient-driven approach assumes that the patient can participate effectively in fine-tuning, typically by providing subjective feedback about sound quality, speech clarity, and/or loudness. Reliance on this approach creates a barrier to effective device fitting for patients who cannot provide this feedback, may require more time than a prescriptive method with verification, and may have varied success across clinicians depending upon the strategies used to elicit and use feedback while tuning. Recent studies of the use of prescriptive procedures for air conduction hearing aids indicate that they may promote consistent levels of audibility across patients, which may, in turn protect against inconsistent outcomes and the risk of over-amplification (McCreery et al, Citation2013; McCreery et al, Citation2016). For these reasons, we have chosen to develop and evaluate an initial approach for objective prescription and verification of percutaneous BCDs.
Hearing aid prescriptions for air-conducted sound have been in development since the 1970s. Currently, several prescriptions exist that are the result of several iterations arising from an ongoing programme of research, and that prescribe targets appropriate for use with modern technologies. This category of prescriptions can be used with multichannel hearing aids employing wide dynamic range compression (WDRC) and are widely implemented within commercial equipment for programming and/or verifying hearing aids. These include the high-frequency version of the Camfit prescriptions (Moore et al, Citation2010), the second revision of the nonlinear National Acoustics Laboratories (NAL) prescription (NAL-NL2, Keidser et al, Citation2011, Citation2012), and the fifth version of the Desired Sensation Level prescription (DSL v5.0, Scollie et al, Citation2005).
Generic prescriptions for BCDs are not clinically available at this time. However, it has been suggested that objective measures of BCD gain/output can be made. Hodgetts et al (Citation2010) compared the LTASS of speech to the threshold of hearing using three different approaches: (i) a modified aided soundfield approach, (ii) a real ear approach and (iii) an acceleration approach. The acceleration approach emerged as most valid. By coupling an accelerometer to the backside of a transducer, the researchers were able to measure directly the acceleration of the skull at threshold and the acceleration of the skull with a BCD in place. These measures are analogous to the real-ear verification that is considered best practice for fitting of air conduction hearing aids. With these verification measurements, the researchers were able to compare directly the output of the device on an individual’s head to the direct bone conduction thresholds all measured through the same common reference point (acceleration in dB at the BCD abutment; logically equivalent to a real ear approach). This led to further work on using BCD verification to assess patient-specific audibility, described below.
Verifying BCD
Hodgetts et al (Citation2011) used the accelerometer approach to demonstrate the importance of audibility for fitting BCD. They developed a master BCD that could be set to either the user’s current frequency response that was available at the time (typically a BCD Divino) or a frequency response derived from an earlier prototype version of the DSL-BCD prescription. The researchers were able to define dynamic range of hearing in acceleration and then use that dynamic range to find a reasonable starting point in which to map speech. Significant improvements were found on the HINT in quiet and in noise and on a consonant identification in noise task when using the BCD fitted to the prototype DSL targets. No differences were found in terms of aided loudness between the two approaches. Interestingly, when people were asked to rate the percentage of sentences understood there were no differences between the two approaches. In other words, subjects in this study felt, subjectively, that speech was just as intelligible with both fittings. However, their objective data revealed a different story, underscoring the importance of not relying only on subjective patient feedback. These results agree with those of a similar study with users of air conduction devices (Boymans & Dreschler, Citation2011).
This early work on prescription and verification is promising. Unfortunately, accelerometers are not available for use in commercial hearing aid analysers. Hodgetts et al (Citation2011) and Dillon (Citation2012) have suggested that a more reasonable alternative to acceleration would be to use a skull coupler (skull simulator, artificial mastoid) to measure the output of the BCD. In this paper, we use this force level approach, and use specific transforms to compare the BCD responses to the listener’s threshold and predicted upper limits of the dynamic range, in force level.
Definitions of variables and transforms
Display type
The fitting approach defined below is an adaptation of the DSL v5 method, which uses the SPLogram display (Seewald et al, Citation2005) to allow the fitter to compare the output level of an air conduction hearing aid to the listener’s dynamic range of hearing. In the sections below, we will describe a method for developing a force level version, the FLogram, for similar use with BCDs. In this method, the appropriate starting point for prescription and verification is to accurately define the dynamic range of hearing with a common reference point. In the case of air conduction hearing aids, the dynamic range of hearing is defined in dB SPL and the common reference point is the ear canal of the patient. In the case of BCDs, we define the dynamic range of hearing in force level, with the reference point being the force level at the abutment of the patient. Two variables, threshold and upper limit of comfort, define the limits of the patient’s dynamic range of hearing. These variables may be quantified in force level at the abutment, with the use of appropriate transforms, reference data and use of a skull simulator.
Transforms used in fitting air conduction hearing aids
When fitting air conduction hearing aids there are two key transforms used to move from the HL (dial level) audiometer thresholds to SPL thresholds in the ear canal of an individual patient. The first is the reference equivalent threshold sound pressure level (RETSPL) transform. This is a standardised, transducer-specific measure that allows the clinician to convert the HL value to an SPL value (ANSI S3.6, Citation2010). In many air conduction fittings, the RETSPL of interest is the one that coverts the HL value from insert earphones to SPL in a 2-cc coupler. Since no two ears are alike and no two ears necessarily conform to a 2-cc coupler, a second transform, the Real Ear to Coupler Difference, (RECD) is required to account for the ear’s unique occluded resonance relative to the coupler response. The RECD is used to derive the appropriate SPL thresholds in the patient’s ear canal (Scollie et al, 1998; Bagatto et al, Citation2005). For each given audiometric frequency the conversion proceeds as shown in EquationEquation 1(1) . A second use of the RECD is applied when hearing aid responses in the ear are predicted from coupler responses, as shown in EquationEquation 2
(2) . Together, these two equations allow audiometric and hearing data (if not measured directly on the ear) to be displayed in dB SPL in the ear canal, which in turn supports the display of the clinical SPLogram. For these procedures to work with acceptable accuracy, some consideration of the coupling type to the ear and the coupler type used in calibration and/or verification is required, and the details of these decisions are described elsewhere (Bagatto et al, Citation2005; Moodie et al, Citation2016):
(1)
(2)
Adaptation of transforms for use with BCD and skull simulators
In 1989, Carlsson & Håkansson developed a coupler for measuring BCDs called the skull simulator TU-1000 (see ). The skull simulator has an accelerometer inside that detects vibrations from the BCD. However, since the skull simulator also has a fixed and known mass, the acceleration response can be multiplied by the mass to easily derive the force response of the BCD. Recently, Interacoustics (Assens, Denmark) have released their own version of a skull coupler known as the SKS10 (see ). It operates on the same principle as the TU-1000, gives equivalent responses to the TU-1000, and is clinically available.
Figure 1. The TU-1000 skull simulator (left), shown alongside the commercially available SKS10 skull simulator (right) developed for use within a commercial hearing aid analyser in clinical practice.
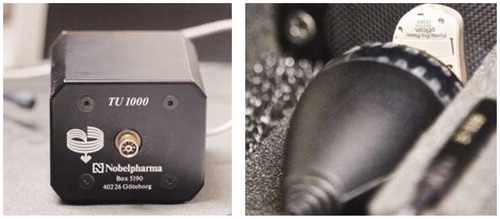
These skull simulator devices may be used as “couplers” for hearing aid analysis and verification, much as fixed-volume couplers are used with air conduction hearing aids. In order for these measures to be individualised to the patient, transforms can be applied so that the responses obtained on the “average” skull will actually represent the response of the patient in-situ. In order to do this, we apply two transforms: (1) software (dial) to force level conversion, and (2) real head to coupler difference (RHCD) transform. The software to force level conversion is logically equivalent to a RETSPL used in air conduction fittings (EquationEquation 1(1) ). When testing the patient in-situ with either manufacturer’s software, they offer a nominal dial level (software) value for each threshold obtained with the patient through the abutment. These are not standardised reference equivalent threshold force levels in dB HL, nor is a standard normative reference widely used in direct bone conduction audiometric assessment (RETFLdbc) although one was published by Carlsson & Håkansson (Citation1997). This lack of standardisation renders the specific force levels per nominal dial level which is somewhat device-dependent. Nonetheless, the accuracy of deriving thresholds through the abutment may outweigh the currently non-standard calibration of clinically available abutment-based audiometry. We therefore first measure the patient’s thresholds through the abutment, and then transform the nominal dial level at threshold to force levels on the skull simulator (). This is conceptually equivalent to converting air conduction audiometric thresholds from dB HL to dB SPL in a standardised calibration coupler. In order to transform these values to in situ, we then apply a second transform, the Real Head to Coupler Difference (RHCD). Stored average values for the RHCD transform were custom-developed for use within this project and for clinical application. This transform accounts for between-individual differences in mass and mechanical impedance (Stenfelt & Goode, Citation2005), measured as the difference between in situ force levels and levels on a skull simulator. At each audiometric frequency, the process for defining thresholds in force level at the BCD abutment is shown in EquationEquation 3
(3) , which is conceptually equivalent to EquationEquation 1
(1) :
(3)
Table 1. Computational stages in the DSL v5.0 air conduction prescription, and adaptations within the DSL-BCD prescription.
These thresholds are used to compute the prescription for output within the modified DSL algorithm, described below. Before this is discussed, we acknowledge that most clinical usage of any prescribed target would currently be done by measuring aided force levels on a skull simulator, not on the abutment of the patient. Therefore, the necessary next step in the transformation process is to define a transform that allows skull simulator verification. The force levels observed on the skull simulator can be transformed to predicted in situ levels with the RHCD (EquationEquation 4(4) ), supporting verification in an acoustically controlled test chamber within either research equipment or within clinical hearing aid analysers, as well as comparison to the in situ thresholds computed in EquationEquation 3
(3) . The correction shown in EquationEquation 4
(4) is conceptually equivalent to EquationEquation 2
(2) for air conduction hearing aids. This approach can also be reversed to allow computation of targets in dB FL on the skull simulator:
(4)
Stored average values for the microphone location effects appropriate for use with BCD were custom-developed and included in EquationEquation 4(4) . These microphone location effects are present at the input to the hearing aid, and as such may have limited effect when the hearing aid is saturated by higher input levels. This nonlinearity is included in the DSL v5 air conduction prescription and accordingly was also included in the DSL-BCD.
Description of the DSL-BCD prescription
The potential benefit of prescribing, verifying, and fine-tuning BCDs has been summarised above, and transforms for representing audiometric thresholds and curves using an in situ dB FL reference have been described. These variables can also be displayed, through transforms, in units of dB FL on a skull simulator to facilitate clinical verification. With these tools in place, a prescriptive method for use with verification of BCDs may be possible to apply in the clinical context. The sections below will describe modifications to the DSL v5.0 prescription to allow its use with BCD. The modified version suggested below was partially implemented for the study reported by Hodgetts et al (Citation2011). In this laboratory study, prescribed levels of audibility produced better aided outcomes for speech recognition when compared to the patients’ performance with their own BCD. Differences between the prototype strategy used in this study, versus the strategy suggested in this paper are summarised in .
The DSL v5.0 prescription uses an underlying algorithm called DSLm[i/o], in which the “m” indicates “multichannel” and the “[i/o]” indicates “input/output function”. An input/output function is a technical measure that describes the output of a hearing aid across input levels, and allows the characterisation of nonlinear devices, such as those that use WDRC. In modern hearing aids, the WDRC feature is applied independently at each of many channels across frequencies, necessitating the development of prescriptions that work with a multichannel, nonlinear architecture. DSLm[i/o] is one such algorithm (Scollie et al, Citation2005). The basis of DSLm[i/o] is the mapping of a functional range of input levels to the listener’s audible range of output levels in the ear canal, while limiting outputs to the upper limits of comfort (Cornelisse et al, Citation1995). Steps within this procedure are described in the leftmost column of . Within DSL, interpolation routines allow prescription to occur at frequencies that were not evaluated audiometrically, such as the standard 1/3 octave band centre frequency of 630 Hz, which lies between the standard audiometric frequencies of 500 and 750 Hz. Next, the combined audiometric and interpolated hearing thresholds, together with an estimate of upper limits of comfort define the outer limits of the listener’s “auditory area” at each of the 17 centre frequencies for one-third octave bands spanning the 200–8000 Hz frequency range. A mapping algorithm, based on Cornelisse et al (Citation1995), relates a wide range of speech input levels (Olsen, Citation1998) to the listener’s auditory area, resulting in nonlinear equations per third octave band. This wide range of inputs extends from a threshold associated with normal hearing to the upper limits of comfort associated with normal hearing. The multichannel architecture and compression thresholds can be customised to match those of the device to be fitted. For example, the 17-band architecture of the algorithm can be adapted for an 8-channel hearing aid by grouping sets of bands together, creating a common input-output slope within a band. A different example is the customisation of the device’s compression threshold: although default compression thresholds are prescribed, they may be overridden by the device-specific thresholds. Achieving adaptation of either of these factors is often done automatically by hearing aid fitting software, based on device parameters. Some clinical applications require these targets to be converted further to accommodate clinical verification using either non-speech test signals, other measurement formats (e.g. gain rather than output), or combinations thereof. Further adaptation of the prescription is achieved by modifying the listener’s developmental status and/or listening environment. Prescribed listening levels are varied, with higher levels prescribed for children with pre-lingual hearing loss (Scollie et al, Citation2005), and lower listening levels are prescribed for use in non-quiet listening environments (Scollie et al, Citation2005; Crukley & Scollie, Citation2012), for a total of four prescription variations: (1) children in quiet; (2) children in noise; (3) adults in quiet; (4) adults in noise. These steps comprise the majority of the DSL v5.0 algorithm’s computational considerations. The DSL[i/o] and DSL v5.0 Child prescriptions have been associated with normalised loudness perception, high aided speech recognition scores, and approximation of preferred listening levels in school aged children, particularly for listening to soft speech (Jenstad et al, Citation1999, Citation2000; Scollie, Citation2008; Scollie et al, Citation2010a,b; Crukley & Scollie, Citation2012). Studies of young children have associated use of DSL-prescribed audibility with successful outcomes of early intervention, particularly when it is paired with routine and high-quality verification that the hearing aid output meets prescribed levels in the child’s ear canal (Sininger et al, Citation2010; Bagatto et al, Citation2011; Stiles et al, Citation2012; McCreery et al, Citation2013), when children routinely use their hearing aids (Walker et al, Citation2015) and when children are exposed to high quality language environments in their early years (Ambrose et al, Citation2015). Children with severe to profound hearing loss performed better in lab and real world tests and preferred to use DSL v5.0 over the NAL-NL1 prescription in a recent study (Quar et al, Citation2013). The DSL v5.0 adult target approximates adults’ preferred listening levels following a period of acclimatisation (Polonenko et al, Citation2010) and was based on an optimisation of speech recognition, loudness and sound quality in adults (Jenstad et al, Citation2007). Externally-developed adaptations of air-conduction algorithms based on DSL have been previously proposed or investigated for BCD in past studies.
In the present work to adapt DSL v5.0 for use with BCD, several calculations and variables required specific adjustment (). Some of these adjustments merely involve the transformation of variables out of the sound pressure level scale and into the force level scale, thereby permitting verification and fine tuning either on the head of the device user or on a skull simulator using the transform procedures discussed above.
Threshold definition
In the clinical workflow used to apply a prescription, the first step is to obtain audiometric thresholds. Valid thresholds pertaining to the percutaneous transmission of sound are best obtained by measuring them directly via presentation of audiometric test signals through the abutment itself, following the post-surgery healing and osseointegration period, which is expected to take about three weeks (Wazen et al, Citation2016). This procedure is facilitated by manufacturer-specific utilities in BCD fitting software that allow in situ audiometry. It is non-standardised and device-specific, so the resulting “dial levels” at threshold are quantified by making technical measurements on a skull simulator, thereby obtaining calibrated measures of output. This is done by placing the BCD on a skull simulator, setting it to the Dial Levels at threshold per frequency, and measuring the dB FL at each frequency. This allows generation of the Dial to Force Level (DFL) transform, in EquationEquation 5(5) :
(5)
The DFL is conceptually equivalent to the Real Ear to Dial Difference (REDD) air conduction transform, which is used to convert between audiometric scales and physical scales of measurement as required (ANSI, Citation2013).
Upper limit of dynamic range
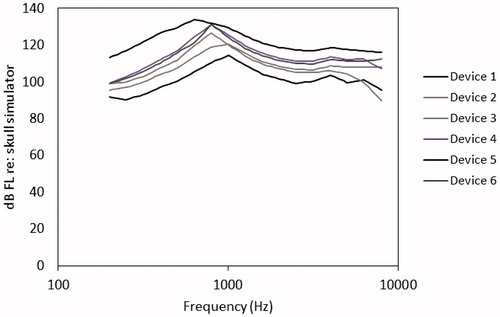
The second step in the workflow for air conduction devices is the definition of the upper limit of the dynamic range of the listener, per ear and per frequency. Prediction of upper limit of comfort for the air conduction version of DSLv5 uses nonlinear equations that compute a conservative estimate of the loudness discomfort level, based on the ear canal sound pressure at threshold. The predictions of upper limits in the DSL-BCD prescription use the same general procedure as is used in DSL v5.0, but have two modifications. First, the nonlinearity of the equations have been modified to account for the growth of loudness expected for BCD users, which is expected to be more compressive (Stenfelt & Håkansson, Citation2002; Stenfelt & Zeitooni, Citation2013). Second, the DSL-BCD prescription has been developed, to date, for unilateral fitting of bone conduction devices, and as such does not have a “per ear” concept. Further development would be needed to consider this prescription on an ear by ear basis for users of bilateral bone conduction devices. Third, the prescription considers of device-specific maximum output. In fitting of air conduction hearing aids, we expect that the device maximum output will meet or exceed the listener’s perception of upper limits of comfort. In prescribing BCD, we expect that the device will limit output at levels lower than the upper limit of comfort of the listener, in many cases. For this reason, we limit the maximum output within the prescription to the lesser of the device-specific maximum output or the listener’s upper limit of comfort. Maximum output performance of BCD varies substantially across different models (), and for some fittings can be low enough to limit the dynamic range of the fitting below the upper limit of comfort of the listener. Reference curves for device-specific maximum output were measured on a TU-1000 skull simulator and stored for further access within the prescriptive software, along with a user-defined option to allow fitters to define devices not included within this reference set.
Figure 2. Device-specific maximum output curves for six bone-anchored hearing instruments of varying makes, models and fitting ranges. All curves were measured with a 90 dB pure tone sweep, with output force levels (dB) measured on a TU-1000 skull simulator.
Mapping across the auditory area
With the definition of the lower limit of fitting (thresholds in on-head force level) and upper limit of fitting (upper limits of device or comfort), the auditory area is defined in force level. Mapping of the output prescription across frequencies and input levels can then proceed to relate a wide range of speech inputs to the individualised range of outputs relevant to the fitting. As with air conduction devices, the DSL m[i/o] mapping is applied to create a set of input-output curves at each frequency that prescribe the target outputs of the device to be fitted. Each input-output curve is forced to pass through a target frequency response shape for mid-level speech, so that the target sensation level for speech audibility is maintained regardless of the number of channels in the hearing aid. The target frequency response shape and input-output characteristics may be adjusted to provide lower gains for adults versus children, and higher gains for listening in quiet versus noise. As is common in air conduction hearing aids, the prescription can be further customised for the device architecture, by adapting it to use the channel structure of the device’s WDRC, or by adapting it to provide linear gain targets rather than WDRC.
Prescribed targets are expressed in decibels force level, as measured on the head of the user via their own abutment. If desired, these on-head targets can be converted for use when measuring the device on a skull simulator (via an adaptation of EquationEquation 4(4) ). These two formats are conceptually analogous to ear canal measurement and coupler measurement formats, which are both commonly used in the fitting and verification of air conduction devices.
Evaluation of initial prescription
The modifications described above were programmed into a custom-developed DSL-BCD algorithm, and compiled as a dynamically-linked library (DLL) labelled as DSL-BCD 1.0. The resulting DLL computed targets for individual patients that were expressed in dB force level (dB FL), referenced to the skull simulator measurement location.
In order to assess the target frequency response shaping systematically, we invited and consented 39 successful BCD users (24 males and 15 females, mean age of 57.3; range 23–72) through the institute for reconstructive sciences in medicine (iRSM) according to the ethics processes of both the University of Alberta and Covenant Health. Patients were deemed successful BCD users if they had (a) received follow-up visits to address any needs for fine tuning; and (b) established regular daily use of their devices for at least 8 h per day and at least two months of device ownership. These patients had a wide range of force level thresholds, ranging from 44 to 81 dB FL, four frequency pure tone averages. They were unilateral BCD users of several device models from Oticon Medical (Ponto Pro/Plus, Ponto Pro Power/Plus Power). None were fitted with BCD for single sided deafness (SSD). Most had unilateral (n = 6) or bilateral conductive hearing loss (n = 15), with the remainder having unilateral (n = 3) or bilateral mixed losses (n = 16). As such, they represent a typical clinical caseload for non-SSD BCD fittings. DSL-BCD 1.0 targets were prescribed for each patient. The Force Level aided responses of each patient’s BCD was then measured on a skull simulator and compared these to the initial DSL5-BCD targets.
Measures of BCD output were made for speech at an input level of 65 dB SPL in the sound field surrounding the BCD instruments, using the male “Standard 1” speech test signal from the Audioscan Verifit (Audioscan, Dorchester, Canada). Microphone location effects were accounted for by filtering them into the test signal prior to presentation to the device in a desktop anechoic chamber (Interacoustics TPS25, Assens, Denmark). Each aided response was analysed in 1/3 octave bands at centre frequencies from 200 through 8000 Hz, and the deviation between the fitted and target responses were computed at audiometric frequencies and inter-octaves.
Results
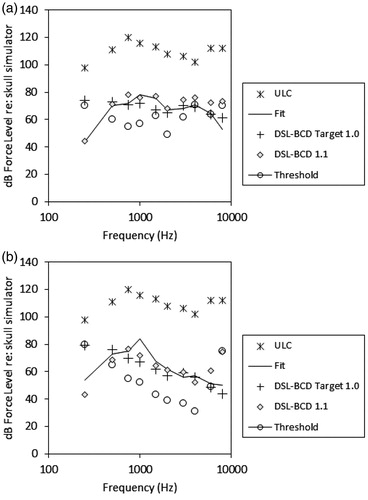
Fitting-to-target deviation was summarised across frequencies, including inter-octaves. The DSL-BCD 1.0 target was higher than the fittings in the low frequencies by 3.1 dB on average (standard deviation: 4.9 dB). illustrates a force-level-o-gram (FLogram) for patient number 18, whose average across-frequency fitting deviation (2.3 dB) was most similar to the group mean deviations. This case illustrates that much of the fitting-to-target deviation is due to the target being higher than the fitting in the low frequencies. This characterisation was observed in all cases.
Figure 3. Panel a: A BCD fitting for an average patient, for DSL-BCD 1.0 and 1.1 targets. Panel b: The same display, for patient whose fitted device provided an unwanted resonant peak at 1000 Hz.
To explore this further, the fitting-to-target differences were averaged into three frequency bands: low (200–630 Hz), mid (800–1600 Hz) and high (2000–8000 Hz). The average signed differences for all fittings for each band were entered into a repeated measures analysis of variance (SPSS 21, Armonk, NY). Results indicated that the differences were greater than zero for at least one frequency band (F(2,82) = 346, p < 0.001, η2=0.89). Post hoc contrasts with Bonferonni correction indicated that targets and fittings did not differ in the high frequencies (mean difference: 0.88 dB, standard deviation 6.43 dB, t(41)= −0.66, p = 0.515). However, the mid frequencies exceeded target significantly (mean: 4.03 dB, standard deviation 4.66 dB, t(41) = 6.18, p < 0.001). In addition, all responses were adjusted to have a significantly lower frequency response than would have been required to meet the DSL BCD 1.0 target in the low frequencies (mean difference: −19.24 dB, standard deviation 6.7 dB, t(41)= −18.87, p < 0.001).
These results were reviewed with several experienced fitters, and discussed in the context of typical reasons for fine tuning. In general, the mid frequency difference between targets and fittings was characterised as attributable to a resonant peak in the BCD frequency response that could not be easily removed by fine tuning. An illustrative case of this fitting outcome is provided in . This resonance was deemed unwanted, and it was decided to not incorporate it into the prescribed target shape, even though doing so would have improved the fit of a revised target to these data. In contrast, the low frequency difference was regarded as a routine and necessary adjustment to support successful device use. For this reason, an adjustment to the target was developed, as described below.
Hearing aid prescription targets are sometimes defined for hearing the voices of conversational partners, although the impact of one’s own voice is certainly an important factor in defining input to the hearing aid and in fine tuning. The DSL-BCD 1.0 target was initially constructed to provide audibility for the voices of others. However, when fitting BCD, other factors affect the fitted frequency response during fine tuning. Specifically, the wearer’s responses to sound quality of his or her own voice, as well as the presence of what many patients refer to as a “barrel effect – that it seems like they are talking with their head in a barrel” during device use may lead to further adjustments to the frequency response. These factors were identified by the clinicians as the reasons for reduction of the low-frequency responses of the BCDs worn by the users in this study.
The differences between the 1/3 octave band frequency response from the fine-tuned BCD and the target were computed. These differences were then evaluated to determine if they were significantly related to threshold in force level. Significant linear relationships (p < 0.05) were present at each frequency in the low frequency band, using the average force level threshold at 250 and 500 Hz as the predictor variable. Linear regression equations were therefore implemented to generate corrections based on the threshold values. These corrections were applied as a correction to the DSL-BCD targets, in order to produce DSL-BCD v1.1. Specifically, the correction was applied to the variable that is responsible for frequency response shaping in the mapping stage of the prescription calculations. Also, as further evaluation of the v1.0 DLL proceeded, further refinements not related to this low-frequency shape change were also made. Specifically, the handling of the input dynamic range variable that defines the upper limit of inputs was adjusted to fix a programming error, and the targets for speech were limited to the broadband output limiting level when the listener’s dynamic range was 5 dB or smaller. These three categories of changes (low cut, input dynamic range upper limit, dynamic range limit) account for differences between targets generated by version 1.0 and 1.1 in and in the results presented below.
The results of these corrections are illustrated in , for the average patient and for the patient whose device had an unwanted mid-frequency resonant peak. It is apparent from this figure that the response modifications provide a low cut to targets that is similar to the fine-tuned responses provided for daily use for these patients. Visual inspection across the 39 patients in this sample indicated that the resulting low cut was maintained across patients, and that many patients would receive prescriptions that approximated their clinical fittings. The proposed adjustments improved the match between the patients’ fits and proposed targets to within 1.9 dB, averaged across frequencies from 250 through 4000 Hz.
The target deviations from version 1.0 and 1.1 were converted to dB RMS using the deviations at 500, 1000, 2000 and 4000 Hz in order to compare to past studies that have recommended a 5 dB criterion for this value (McCreery et al, Citation2013). The average RMS agreement was 7.7 dB for 1.0 and 6.1 dB for version 1.1. Across the sample, the number of fittings that fell within 5 dB of target increased from 5 cases to 15, in versions 1.0 and 1.1, respectively. In version 1.1, most of those exceeding the 5 dB criterion were fittings that required high-power devices, in which the limits of the devices would not allow fitting for full audibility of speech. Because BCD devices currently have fewer channels of adjustment, the frequency response control is not as fine-scaled as is currently possible with air conduction hearing aids. Therefore, some of the deviation from target could be due to target error, while other deviation could be due to device limitations. Further evolution of devices and evaluation of targets is necessary to understand whether further adjustments of the targets themselves are necessary.
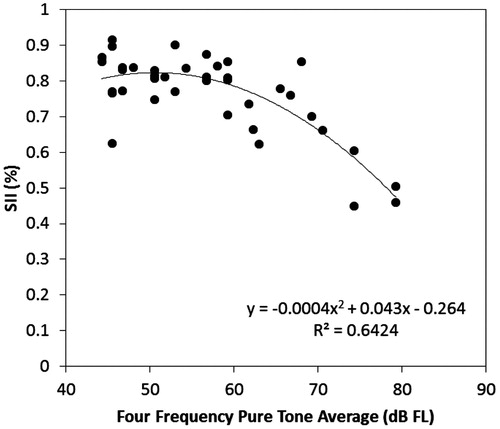
The fittings themselves were further evaluated by the computation of the aided Speech Intelligibility Index (SII: ANSI, Citation2012), and examining the values across levels of hearing loss. Using custom-developed software, the thresholds and aided levels of speech from each fitting, quantified in dB FL at the user’s abutment, were entered into a script for computing the aided SII using the one-third octave method, with an average speech importance weighting function. The values are displayed in . A non-linear trend emerged, in which listeners with thresholds better than about 60 dB FL across 500, 1000, 2000 and 4000 Hz had aided SII values that were high at about 0.80. Above a four-frequency pure tone average of about 60 dB FL, the aided SII values reduced as threshold levels increased. This is highly similar to trends observed for normative values in air conduction hearing aids (Bagatto et al, Citation2011; McCreery et al, Citation2013), in that patients who have less hearing loss have higher aided SII values, with a gradual downward trend as increasing hearing threshold levels require the use of higher sensation levels.
Figure 4. Aided Speech Intelligibility Index (SII) values for 39 patients who use bone conduction devices worn on an abutment. SII values are displayed as a function of the Four Frequency Pure Tone Average hearing threshold levels expressed as dB FL at the user’s abutment. A non-linear fitted trendline is also displayed (–).
Summary and future directions
In this paper, we have presented an approach for developing DSL-based prescriptive targets for use with Bone Conduction Devices (BCD) worn on a skull-mounted abutment. The initial targets were evaluated against the observed fittings of a sample of adults who are successful BCD users, and adjustments to the low frequency targets were performed to improve the match between targets and actual fittings. The resulting algorithm is labelled DSL-BCD v1.1. This algorithm is designed for use within a specific method, in which the patient’s thresholds are measured via direct bone conduction through the abutment, and the dial or software levels at threshold are converted to dB Force Level (FL) for later use when verifying on a skull simulator in dB FL. The targets and fittings are intended to be viewed on the “FLogram” display, which plots the patient’s thresholds, targets, upper limits and fitting on one graph as illustrated in , which allows the clinician to place the fitting in the context of the patient’s auditory area.
This approach has several limitations. Importantly, it has only been evaluated on one sample of experienced users of unilateral BCD, using one brand of BCD, and has not been evaluated for bilateral BCD or SSD-BCD patients. That said, it is expected that measures of frequency response on a skull simulator will generalise, however, to other brands of BCD that are used percutaneously. This approach has not yet been evaluated in children, although these evaluations are currently in progress. Finally, it has only been evaluated for one input level, mainly to address the adequacy of the frequency response shaping, and further studies should evaluate the compression aspects of this prescription by assessing performance across a range of input levels. The overall approach may require further modification for use with these populations and/or other related populations such as users of transcutaneous bone-conduction hearing aids.
| Abbreviations | ||
| BCD | = | Bone Conduction Devices |
| AAA | = | American Academy of Audiology |
| WDRC | = | Wide dynamic range compression |
| NAL | = | National Acoustics Laboratories |
| DSL | = | Desired Sensation Level |
| DFL | = | Dial to Force Level |
| DLL | = | Dynamically linked library |
| FLogram | = | Force-level-o-gram |
| RECD | = | Real ear to coupler difference |
| REDD | = | Real ear to dial difference |
| RETSPL | = | Reference equivalent threshold sound pressure level |
| RHCD | = | Real head to coupler difference |
| RETFLdbc | = | Reference equivalent threshold force level by direct bone conduction |
| RMS | = | Root mean squared |
| SSD | = | Single sided deafness |
| SII | = | Speech intelligibility index |
Declaration of interest
The software product described in this paper is available for licencing via the University of Western Ontario. Licensing revenue are returned to the University, and used in support of further research.
Acknowledgements
This work has been supported by the University of Western Ontario’s Western Innovation Fund grant and Western Economic Partnership Agreement. We acknowledge the contributions of Mr. Steve Beaulac to software development, and Mr. Dylan Scott to data collection and for technical assistance.
Note
Notes
1. For many years, BAHA was an acronym for Bone Anchored Hearing Aid. However, Cochlear now has a trademark on the name Bahatm for their devices. Bone Conduction Devices (BCDs) is used in this paper instead. Oticon Medical devices are called Ponto and Cochlear Devices are called Baha®.
References
- Ambrose, S.E., Walker, E.A., Unflat-Berry, L.M., Oleson, J.J. & Moeller, M.P. 2015. Quantity and quality of caregivers’ linguistic input to 18-month and 3-year-old children who are hard of hearing. Ear Hear, 36, 48S–59S.
- American Academy of Audiology (AAA). 2006. American Academy of Audiology guidelines for the audiologic management of adult hearing impairment. Retrieved from http://www.audiology.org/resources/documentlibrary/Documents/haguidelines.pdf
- American Academy of Audiology (AAA). 2013. American Academy of Audiology Pediatric Amplification Guidelines. Retrieved from http://www.audiology.org/resources/documentlibrary/Documents/PediatricAmplificationGuidelines.pdf
- American National Standards Institute (ANSI). 1997. Method for the Calculation of the Speech Intelligibility Index (ANSI 53.79–1997). New York: ANSI.
- American National Standards Institute (ANSI). 2010. Specification for Audiometers. ANSI S3.6-2010. New York: Acoustical Society of America.
- American National Standards Institute (ANSI). 2012. Methods for calculation of the Speech Intelligibility Index, ANSI S3.5-2012. New York: Acoustical Society of America.
- American National Standards Institute (ANSI). 2013. Methods of Measurement of Real-Ear Performance Characteristics of Hearing Aids. ANSI S3.46-2013. New York: Acoustical Society of America.
- Bagatto, M., Moodie, S., Scollie, S., Seewald, R., Moodie, S., et al. 2005. Clinical protocols for hearing instrument fitting in the desired sensation level method. Trends Amplif, 9, 199–226.
- Bagatto, M.P., Moodie, S.T., Malandrino, A.C., Richert, F.M., Clench, D.A., et al. 2011. The University of Western Ontario Pediatric Audiological Monitoring Protocol. Trends Amplif, 15, 57–76.
- Boymans, M. & Dreschler, W. 2011. Audiologist-driven versus patient-driven fine tuning of hearing instruments. Trends Amplif, 16, 49–58.
- Carlsson, P. & Håkansson, B. 1997. The bone-anchored hearing aid: Reference quantities and functional gain. Ear Hear, 18, 34–41.
- Cornelisse, L.E., Seewald, R.C. & Jamieson, D.G. 1995. The input/output formula: A theoretical approach to the fitting of personal amplification devices. J Acoust Soc Am, 97, 1854–1864.
- Crukley, J. & Scollie, S. 2012. Children’s speech recognition and loudness perception with the desired sensation level v5 quiet and noise prescriptions. Am J Audiol, 21, 149–162.
- Dillon, H. 2012. Hearing Aids. New York (NY): Thieme.
- Glista, D., Scollie, S., Moodie, S., & Easwar, V. 2014. The Ling 6 (HL) test: Typical pediatric performance data and clinical use evaluation. J Am Acad Audiol, 25, 1008–1021.
- Håkansson, B.O., Tjellström, A. & Carlsson, P. 1990. Percutaneous vs. transcutaneous transducers for hearing by direct bone conduction. Otolaryngol Head Neck Surg, 102, 339–344.
- Håkansson, B., Tjellström, A. & Rosenhall, U. 1984. Hearing thresholds with direct bone conduction versus conventional bone conduction. Scand Audiol, 13, 3–13.
- Håkannson, B., Tjellström, A. & Rosenhall, U. 1985. Acceleration levels at hearing threshold with direct bone conduction versus conventional bone conduction. Acta Otolaryngol, 100, 240–252.
- Hawkins, D.B. 2004. Limitations and uses of the aided audiogram. Semin Hear, 25, 51–62.
- Hodgetts, W.E., Hagler, P., Hakansson, B.E.V. & Soli, S.D. 2010. A comparison of three approaches to verifying aided Baha output. Int J Audiol, 49, 286–295.
- Hodgetts, W.E., Hagler, P., Hakansson, B.E.V. & Soli, S.D. 2011. Technology-limited and patient-derived versus audibility-derived fittings in bone-anchored hearing aid users: A validation study. Ear Hear, 32, 31–39.
- Jenstad, L.M., Seewald, R.C., Cornelisse, L.E. & Shantz, J. 1999. Comparison of linear gain and wide dynamic range compression hearing aid circuits: Aided speech perception measures. Ear Hear, 20, 117–126.
- Jenstad, L.M., Pumford, J., Seewald, R.C. & Cornelisse, L.E. 2000. Comparison of linear gain and wide dynamic range compression hearing aid circuits II: Aided loudness measures. Ear Hear, 21, 32–44.
- Jenstad, L.M., Bagatto, M.P., Seewald, R.C., Scollie, S.D., Cornelisse, L.E., et al. 2007. Evaluation of the desired sensation level [input/output] algorithm for adults with hearing loss: The acceptable range for amplified conversational speech. Ear Hear, 28, 793–811.
- Keidser, G., Dillon, H., Flax, M., Ching, T. & Brewer, S. 2011. The NAL-NL2 prescription procedure. Audiol Res, 1, e24–e90.
- McCreery, R., Walker, E., Spratford, M., Kirby, B., Oleson, J. & Brennan, M. 2016. Stability of audiometric thresholds for children with hearing aids applying the American Academy of Audiology Pediatric Amplification Guideline: Implications for safety. J Am Acad Audiol, 27, 252–263.
- Keidser, G., Dillon, H., Carter, L. & O’Brien, A. 2012. NAL-NL2 empirical adjustments. Trends Hear, 16, 211–223.
- McCreery, R. 2013. The trouble with functional gain in verifying pediatric hearing aids. Hear J, 66, 14–16.
- McCreery R., Bentler R. & Roush P. 2013. The characteristics of hearing aid fittings in infants and young children. Ear Hear, 34, 701–710.
- Moodie, S., Pietrobon, J., Rall, E., Lindley, G., Eiten, L., et al. 2016. Using the real-ear-to-coupler difference within the american academy of audiology pediatric amplification guideline: Protocols for applying and predicting earmold RECDs. J Am Acad Audiol, 27, 264–275.
- Moore, B.C.J., Glasberg, B.R. & Stone, M.A. 2010. Development of a new method for deriving initial fittings for hearing aids with multi-channel compression: CAMEQ2-HF. Int J Audiol, 49, 216–227.
- Mylanus, E.A.M., Snik, A.F.M. & Cremers, C.W.R.J. 1994. Influence of the thickness of the skin and subcutaneous tissue covering the mastoid on bone-conduction thresholds obtained transcutaneously versus percutaneously. Scand Audiol, 23, 201–203.
- Olsen, W.O. 1998. Average speech levels and spectra in various speaking/listening conditions: A summary of the Pearson, Bennett, & Fidell (1977) report. Am J Audiol, 7, 21–25.
- Polonenko, M., Scollie, S., Moodie, S., Seewald, R., Laurnagaray, D., et al. 2010. Fit to targets, preferred listening levels, and self reported outcomes for the DSL v5.0a hearing aid prescription for adults. Int J Audiol, 49, 550–560.
- Quar, T.K., Ching, T.Y.C., Newall, P. & Sharma, M. 2013. Evaluation of real-world preferences and performance of hearing aids fitted according to the NAL-NL1 and DSL v5 procedures in children with moderately severe to profound hearing loss. Int J Audiol, 52, 322–332.
- Scollie, S.D., Seewald, R.C., Cornelisse, L.E. & Jenstad, L.M. 1998. Validity and repeatability of level-independent HL to SPL transforms. Ear Hear, 19, 407–413.
- Scollie, S.D., Seewald, R., Cornelisse, L., Moodie, S., Bagatto, M., et al. 2005. The desired sensation level multistage input/output algorithm. Trends Amplif, 9, 159–197.
- Scollie, S.D. 2008. Children’s speech recognition scores: The Speech Intelligibility Index and proficiency factors for age and hearing level. Ear Hear, 29, 543–556.
- Scollie, S.D., Ching, T.Y.C., Seewald, R., Dillon, H., Britton, L., et al. 2010a. Evaluation of the NAL-NL1 and DSL v4.1 prescriptions for children: Preference in real world use. Int J Audiol, 49 Suppl 1, S49–S63.
- Scollie, S.D., Ching, T.Y.C., Seewald, R.C., Dillon, H., Britton, L., et al. 2010b. Children's speech perception and loudness ratings when fitted with hearing aids using the DSL v.4.1 and the NAL-NL1 prescriptions. Int J Audiol, 49 Suppl 1, S26–S34.
- Scollie, S., Glista, D., Tenhaaf Le Quelenec, J., Dunn, A., Malandrino, A., et al. 2012. Ling 6 Stimuli and normative data for detection of Ling-6 sounds in hearing level. Am J Audiol, 21, 232–241.
- Seewald, R., Moodie, S., Scollie, S. & Bagatto, M. 2005. The DSL method for pediatric hearing instrument fitting: Historical perspective and current issues. Trends Amplification, 9, 145–157.
- Sininger, Y.S., Grimes, A. & Christensen, E. 2010. Auditory development in early amplified children: factors influencing auditory-based communication outcomes in children with hearing loss. Ear Hear, 31, 166.
- Snik, F.M., Mylanus, A.M. & Cremers, W.R.J. 2001. The bone-anchored hearing aid: A solution for previously unresolved otologic problems. Otolaryngol Clin North Am, 34, 365–372.
- Snik, F.M., Mylanus, E.A., Proops, D.W., Wolfaardt, J.F., Hodgetts, W.E., et al. 2005. Consensus statements on the BAHA system: Where do we stand at present? Ann Otol RhinolLaryngol, 114(12_suppl), 2–12.
- Stiles, D., Bentler, R. & McGregor, K. 2012. The speech intelligibility index and pure-tone average as predictors of lexical ability in children fit with hearing aids. J Speech Lang Hear Res, 55, 764–778.
- Stenfelt, S. & Håkansson, B. 2002. Air versus bone conduction: an equal loudness investigation. Hear Res, 167, 1–12.
- Stenfelt, S. & Goode, R. 2005. Transmission properties of bone conducted sound: measurements in cadaver heads. J Acoust Soc Am, 118, 2373–2391.
- Stenfelt, S. & Zeitooni, M. 2013. Loudness functions with air and bone conduction stimulation in normal-hearing subjects using a categorical loudness scaling procedure. Hear Res, 301, 85–92.
- Walker, E.A., Holte, L., McCreery, R., Spratford, M., Page, T., et al. 2015. The influence of hearing aid use on outcomes of children with mild hearing loss. J Speech Lang Hear Res, 58, 1611–1625.
- Wazen, J.J., Babu, S., Daugherty, J. & Metrailer, A. 2016. Three-week loading of the 4.5 mm wide titanium implant in bone anchored hearing systems. Am J Otolaryngol, 37, 132–135.