
Abstract
Background
Ecological momentary assessment (EMA) methods allow for real-time, real-world survey data collection. Studies with adults have reported EMA as a feasible and valid tool in the measurement of real-world listening experience. Research is needed to investigate the use of EMA with children who wear hearing aids.
Objectives
This study explored the implementation of EMA with children using a single-blinded repeated measures design to evaluate real-world aided outcome.
Methods
Twenty-nine children, aged 7–17, used manual program switching to access hearing aid programs, fitted according to Desired Sensation Level (DSL) version 5.0 child quiet and noise prescriptive targets. Aided outcome was measured using participant-triggered twice-daily EMA entries, across listening situations and hearing dimensions.
Results
Adherence to the EMA protocol by the children was high (82.4% compliance rate). Speech loudness, understanding and preference results were found to relate to both the hearing aid program and the listening situation. Aided outcomes related to prescription-based noise management were found to be highest in noisy situations.
Conclusions
Mobile device-based EMA methods can be used to inform daily life listening experience with children. Prescription-based noise management was found to decrease perceived loudness in noisy, non-school environments; this should be evaluated in combination with hearing aid noise reductions features.
Introduction
Hearing aid outcome is traditionally assessed using laboratory-based testing methods and retrospective self-report questionnaires. At best, lab environments provide an estimate, or simulation, of how a listener will perform in a complex real-world environment. Questionnaire data can be confounded by memory bias, when completed based on recall, and may not accurately describe individually-experienced listening situations. Advancements in mobile device technologies, equipped with user-friendly applications, now make it possible to collect information outside of the laboratory and in environments representative of listeners’ everyday life. Hearing aid outcomes assessed using real-time, real-world data collection methods are, therefore, advantageous, as outcomes can be determined/modified by a wide variety of environmental or contextual factors (Kaplan and Stone Citation2013). The experience sampling method (ESM) is a technique used to capture data from real-world experiences (Larson and Csikszentmihalyi Citation2014; Stone and Shiffman Citation2002). Included in ESM is ecological momentary assessment (EMA), which involves repeated sampling of participants’ current behaviours and experiences in real-time and in natural environments (Schinkel-Bielefeld et al. Citation2020; Shiffman, Stone, and Hufford Citation2008).
EMA allows for the collection of individual experiential reports at the time of occurrence, thereby substantially reducing recall and report bias (Shiffman, Stone, and Hufford Citation2008); this data collection method can also lead to greater ecological validity and is focussed on the individual’s unique responses. EMA can be structured in different ways and according to the data collection goal(s), including time-based sampling and/or event-based sampling. In time-based sampling, participants are requested to submit EMA surveys in response to a time-based trigger or notification that may vary in schedule, frequency and timing (Shiffman, Stone, and Hufford Citation2008). This method allows for a random assessment of the participants’ experiences and behaviours that occur throughout the day. Event-based sampling allows researchers to focus on specific events of interest, instructing participants to complete surveys during or immediately following pre-determined events such as eating or watching TV. Event-based EMA surveying can use location-based triggers or may involve participant-triggered surveys in response to pre-determined events. In addition to these two types, there is also a combination design, which includes both types of triggers, this is used to provide contextual interpretation for the events through comparisons made from data collected during events of interest and baseline data collected at random (Shiffman, Stone, and Hufford Citation2008). Triggering can be requested through automatic prompts built into a mobile device application or by asking the user to trigger based on a pre-determined data collection goal.
Hearing aid research using EMA methods has gained popularity in recent years, aligning well with the technology-driven field of Audiology. Early studies included the use of paper-and-pencil self-report questionnaires to explore hearing aid preference in everyday listening situations. For example, Walden et al. (Citation2004) highlighted how information related to the characteristics of the listening environment (signal location, distance and type) can add to the understanding of listener preference for hearing aid features/settings (Walden et al. Citation2004). Follow-up work has focussed on evaluating construct validity and the general feasibility of EMA with adult listeners (Galvez et al. Citation2012; Timmer, Hickson, and Launer Citation2017; Wu et al. Citation2015). In recent EMA studies, paired comparison approaches have been used with adult listeners, suggesting the potential for EMA methods to directly compare hearing aid programming in real-life situations and to relate the results to the data of the participants’ auditory reality (Jensen et al. Citation2019; Wu et al. Citation2019). EMA has also been used to highlight benefits of hearing aids to listeners with hearing loss, when compared to unaided listening; among the reported benefits were those related to speech perception and listening effort, measured using rating scales embedded in the EMA survey (Timmer, Hickson, and Launer Citation2018a; von Gablenz et al. Citation2019). The mounting evidence supports the use of EMA with adult listeners to evaluate various aspects of hearing aids, in everyday life; however, research to explore its potential use with children using hearing aids is needed.
Daily life research including children with hearing loss has mainly focussed on listening activities, experiences and related acoustical demands, with and without the use of remote microphone technologies; this has been accomplished through the use of daily logs, data logging and/or paper-and-pencil questionnaires aimed at probing real-world device use (Mulla and McCracken Citation2014; Zimmo Citation2015). In a study by Scollie et al. (Citation2010a), school-aged children used real-world daily paper-and-pencil diaries to log listening preference and use, comparing two hearing aid programs; these were completed with good reliability and high compliance rates. Situational preference, overall preference and reasoning for preference were noted over several weeks of hearing aid use. Results from these diaries fell into two principal components, consistent with situational use of prescriptions. Specifically, a higher-gain prescription was preferred in specific environments that included low sound levels and little background noise, while a lower-gain prescription was preferred in louder and/or noisier environments (Scollie et al. Citation2010a). When comparing performance assessed via paper-and-pencil daily logs to that from EMA data collection methods, one should consider factors such as the accuracy of the measured effects (i.e. precision and quantification of clinically significant effects), participant and/or investigator burden and engagement and sample size requirements.
Daily life research has yet to include the use of EMA to characterise hearing aid benefit with children in school-based situations or outside of school time. Literature discussing school-based acoustical demands, highlights the wide variety of “non-quiet” daily listening environments and situations that children experience surveyed via paper-and-pencil format, suggesting the need for processing strategies for children with non-quiet listening needs (Crukley, Scollie, and Parsa Citation2011). As such, Desired Sensation Level (DSL) version 5.0 (London, Canada) for noise has been evaluated in lab-based research examining speech recognition and loudness perception, which suggests that this prescription-based noise management strategy may be an effective approach to managing non-quiet listening needs (Crukley and Scollie Citation2012). By including daily life research with children who wear hearing aids, we can start to learn more about the relationship between listening situation, hearing aid prescription and hearing aid fitting optimisation.
EMA may be an appropriate methodological choice for children and youth, a population commonly referred to as “digital natives”. Today’s children and youths have been born into the digital era; they are growing up exposed to the continuous flow of digital information and technologies, with both computers and the Internet as natural components of their everyday lives (Govender and Mars Citation2017; Wen et al. Citation2017). This familiarity with technology allows opportunities for research, such as that employing EMA, to engage the younger generations in research and/or a technology-enabled care process. EMA studies have been conducted across a variety of paediatric subgroups, including children with obesity, depression, attention disorders, arthritis, diabetes and pain, as well as children with no known disorders (for example Chiang and Lam Citation2020; Fahrenkamp et al. Citation2020; Harding et al. Citation2009; Russell and Gajos Citation2020; Stinson et al. Citation2008). In a systematic review and meta-analysis done by Wen et al. (Citation2017), it was found that children in EMA studies were generally prompted between two and nine times per day; studies that include more frequent prompting (e.g. >9 times per day) reported lower compliance rates. The literature around the effect of frequent prompting on compliance rates is mixed when considering studies with adult participants; recent research specifies a mix of no difference and lower rates in the reported compliance (Colombo et al. Citation2018; Jones et al. Citation2019). Of the paediatric EMA studies analysed by Wen et al., 12% were completed with children using additional wearable devices; the addition of wearable devices did not influence compliance rates. While EMA is reported to be an effective research method with children across many health care-related fields (Russell and Gajos Citation2020), research is needed to determine if EMA research methods can be effectively used to measure aided outcomes with children who wear hearing aids.
The objectives of this study are as follows: (1) to explore whether children wearing hearing aids, in real-world non-school environments, and across unstructured listening situations could adhere to an EMA protocol; and (2) to assess real-world aided performance and preference in the evaluation of a prescription-based noise management strategy with child listeners.
Materials and methods
Participants
Twenty-nine participants between the ages of 7 and 17 years (mean = 12.14; SD = 2.80) were recruited to this study. Children were recruited with the goal of sampling across school-aged children (7.0 − 12.9 years) and adolescents (13.0 − 17.9 years) for inclusion in the study (). Participants were recruited from a laboratory database including children with hearing loss, residing within Ontario that had previously participated in research at the National Centre for Audiology. All parts of the study were approved by the Western University Research Ethics Board. All participants were asked to provide written consent following receipt of all study information in the form of a letter of information (for adolescents) or an assent letter (for school-aged children). For the group of school-aged children, written consent was also provided by a parent or guardian, following receipt of the letter of information and consent. All participants were compensated for their time.
Table 1. Participant demographics.
Air conduction audiometric assessments were completed with all participants, including threshold measurement at octave and inter-octave frequencies between 125 and 8000 Hz, in addition to otoscopy and middle ear analyses. Participants’ audiometric thresholds were measured using a Grason Stadler GSI 61 audiometer with ER-3A insert earphones coupled to personal earmolds; middle ear analyses were completed using a Madsen Zodiac 901. Four-Frequency Pure Tone Averages (4PTA) were calculated using .5, 1, 2 and 4 kHz for each participant, using better ear thresholds, and were then categorised by hearing loss severity () according to the American Speech-Language-Hearing Association guidance document (Citation2015).
Hearing aid programming
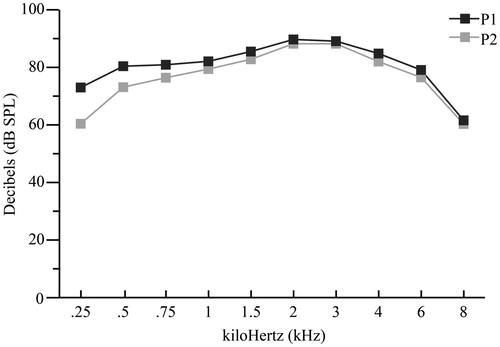
Participants included in this study previously completed a lab-based study (Van Eeckhoutte et al. Citation2020), in which they were provided with study-worn hearing aids to keep and use in daily life (including this study): Phonak Sky V90 devices of various models (). All devices were coupled to personal earmolds and were fitted to the DSL version 5.0 child prescription, incorporating Real Ear to Coupler Difference values measured using personal earmolds. Hearing aid fitting incorporated the DSL version 5.0 child prescription (Bagatto et al. Citation2005; Scollie et al. Citation2005) and coupler-based verification using the Audioscan Verifit 2. Fine tuning was completed using the International Speech Test Signal (ISTS) speech signal (Holube et al. Citation2010) at input levels of 55, 65 and 75 dB SPL, and for tone bursts at 90 dB SPL to assess the maximum power output (MPO). The feedback manager was activated for two participants. All other hearing aid features were disabled. Fit to target deviations were within 2 dB root mean square error (RMSE) using 0.5, 1, 2 and 4 kHz, for speech input levels at 55, 65 and 75 dB SPL, within 4 dB RMSE when including 6 kHz, and within 10 dB when including 8 kHz. These values are within the recommended 5 dB RMSE for frequencies up to 6 kHz for hearing aid fitting (Baker and Jenstad Citation2017; Brennan et al. Citation2017; McCreery, Bentler, and Roush Citation2013). For the MPO test signal, the values were within 3 dB for frequencies up to 4 kHz, within 5 dB for up to 6 kHz, and within 12 dB up to 8 kHz. A comparison of the mean real ear aided frequency response, across participants, was completed for Program 1 (P1) versus Program 2 (P2). displays that for an input level of 65 dB SPL, P2 is quieter by 13 dB at 0.25 and by 7 dB at 0.5; the aided response is within 3 dB for all other frequencies included in . The P1–P2 response difference for 8 kHz should be interpreted with caution, given that for most fittings, a fit-to-target could not be achieved at 8 kHz due to limitations in the device maximum output.
Figure 1. Mean real ear aided response values for an input level of 65 dB SPL, comparing P1 and P2.
Data logging was enabled in 23 out of 29 participants’ hearing aid fittings and all participants were asked to self-report average hearing aid usage, prior to starting the trial. According to hearing aid data logging, on average, the children wore their hearing aids 10.0 h/d and made use of program switching. Participant self-report data indicated an average use of 11.2 h/d. These data agree with previously reported hearing aid usage data indicating lower values with data logging, when compared to self-report data, with an average of 10.6 h/d reported by the families of children with hearing loss (Walker et al. Citation2015). Some participants and/or their parents/guardians reported low hearing aid usage on weekends, evenings or on days with no school.
Hearing aid trial and data collection
A 1-week hearing aid trial was completed by all participants outside of school time. Given the exploratory nature of the EMA component of this study, the investigators chose to include real-world evaluation of an EMA protocol based on unstructured listening environments. This limited the ability to generalise results to school-based listening but allowed for adherence to be assessed across variable daily-life environments and for an arguably more challenging study protocol. The hearing aid trial included manually accessible hearing aid programs via device program switches. P1 included fittings as described in the Hearing Aid Programming section; these fittings were assumed to be optimised for quiet listening situations. P2 included a modified fitting to the DSL version 5.0 child noise prescription, which was developed for use in noisy listening situations (Crukley and Scollie Citation2012; Scollie Citation2005). All participants were blinded to the purpose of each program as well as any details regarding the prescriptive differences. This program orientation was held constant for all participants, to allow for easy and consistent pairing to the child’s remote microphone system for school used. Program counterbalancing within the EMA survey was used to minimise order effects with repeated measurement testing.
Data were collected using tablets (Asus Zenpad 7) loaned to each participant, pre-loaded with a mobile survey application (MobEval version 2.1.1-beta) enabling the real-world collection of EMA data. “Kids Mode” was enabled in all tablets to lock all other tablet functions, allowing access to only the survey application. Participants were asked to complete two EMA surveys each day over the course of the recommended 1-week trial. EMA items and response choices are included in . illustrates the child-friendly graphics and associated response choices for the Speech loudness and Speech understanding scales. EMA entries were coded according to completion of one entire EMA survey. EMA entries were excluded from analyses in the case of partial datasets, which limited the comparison of outcomes across hearing aid programs. Within each EMA survey, core assessment questions were repeated (except for overall preference) to assess listener outcomes across the two hearing aid programs of interest for this study. Participant adherence to the EMA protocol was assessment by measuring compliance rates. Protocol adherence was of interest in this study given that data collection was completed outside of the laboratory, with children, and in unstructured real-world situations. Compliance was calculated by comparing the total requested EMA entries to those that were completed within the EMA protocol guidelines; this included a count of the number of incomplete entries, as well as those that consisted of activities outside of the protocol (i.e. activities completed during school time). An “easy” listening situation and a “difficult” listening situation were identified daily, by each child, to enable data collection across variable contexts; these were determined as follows: participants were instructed to fill out the EMA when in a “difficult listening situation” and when in an “easy listening situation” using event-based participant-triggering. This type of triggering involved participants determining situations of interest and thus initiating the triggering at that point in time. EMA instructions were provided at the start of each trial by paper and verbally, delivered by a research team member; this instruction session was interactive and allowed the children to walk through the completion of an entire practice survey and to practice program switching and categorisation of listening situations according to noise level.
Figure 2. Illustration of the speech loudness and speech understanding rating scales and corresponding graphics.
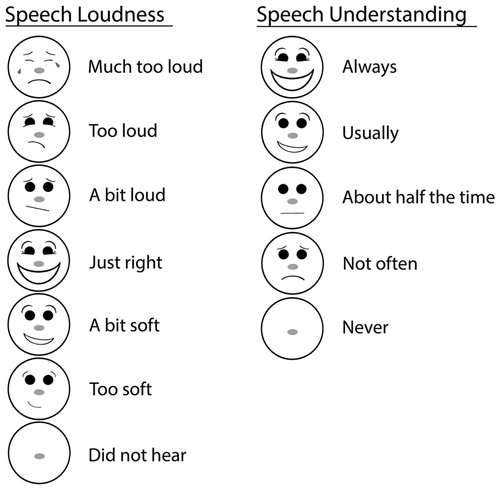
Table 2 The EMA Survey by Item Number, Description, Participant Facing Item, and Response Format
EMA survey items included prompts, multiple-choice questions, rating scales, forced-choice questioning and a question involving an open-ended text-based response. At the start of each EMA survey, participants were prompted to manually switch to P1 or P2 (counterbalanced). A second prompt was used half-way through each EMA survey to enable surveying of outcomes in the opposite program. Text-based rating scales were paired with child-friendly graphics depicting the corresponding facial expressions. A 7-point speech loudness scale included a modified version of the Loudness Metre, with a change to the final category descriptor (Scollie et al. Citation2010b). A 5-point speech understanding scale was created to assess the children’s ability to understand speech for each listening situation of interest. Survey data was stored on each tablet until study completion; once returned to the lab, the data was transferred to a computer and exported as a CSV file. For analysis purposes, counterbalanced responses were aligned according to hearing aid condition.
Data analyses procedures
Preference data collected including optional text-based responses were reviewed and coded into key words, which were then grouped into categories according to published psychoacoustic descriptors of sound stimuli (Kerrick, Nagel, and Bennett Citation1969). Because of the open-ended response format, text responses often contained more than one descriptor. The resulting coded categories included Sound quality, Loudness, Background noise, Intelligibility, Participation/listening effort, Familiarity and Comfort. The sound quality category was further divided into five sub-categories according to the dimensions of perceived sound quality (Gabrielsson and Sjögren Citation1979): Clarity, Softness, Spaciousness, Distance and Total sound quality impression. There were no entries with descriptors related to Brightness or Fullness; as such, these categories were removed.
Repeated measures analyses were used across all datasets in the study to analyse answers from one EMA survey, under different conditions. For data collected using a multiple-choice format (Q2 & Q6) to categorise listening situation by noise level (Quiet, Slightly noisy and Very noisy), a paired design with replications for each child was used to correlate observations from the same child and the same EMA entry, while making simple comparisons between the proportion of responses for P1 and P2. Generalised linear mixed effect models (GLMMs) were used for modelling proportions of each listening situation (Faraway Citation2016). Random effects for each child and entry were incorporated for between- and within-subject variation and correlations. Program was added as the fixed effect, and the corresponding likelihood-based chi-square test was used to examine the difference of the proportions to a specific listening situation between the two programs.
For data collected using word scales, conditional comparisons were made to compare the proportions of each response for Q3 versus Q7 and Q4 versus Q8, while holding the listening situation perceived in P1 (Q2) constant, according to the participants’ responses; this effectively compared speech loudness and understanding ratings made in P1 versus P2 in a straightforward way. The choice to hold the listening situation in P1 constant for analyses purposes was based on the children being most familiar with listening through P1. Conditional comparisons were analysed using the GLMMs with each child and EMA entry as random effects. Since both simple comparisons and conditional comparisons involved multiple hypothesis tests, their p values were adjusted using the Benjamini and Hochberg (Citation1995) method for controlling false discovery rates. For data collected using a forced-choice format (Q9) to assess program preference, simple comparisons were made to compare proportions related to a preference for P1 versus P2; this dataset was analysed by first aggregating the preference counts for each child and then fitting a binomial regression model to the aggregated counts. A likelihood-based chi-square test was then performed with a null hypothesis of no preference to either P1 or P2. 4PTA and speech loudness were further added as fixed effects to the binomial model to assess whether program preference was associated with degree of hearing loss or with speech loudness.
To achieve a holistic representation of the data, multiple correspondence analysis (MCA) was incorporated as a multivariate descriptive method to examine associations among multiple qualitative variables. Similar to principal component analysis for quantitative variables, MCA summarises the categories of qualitative variables with a number of dimensions (components). The variance of the data is mostly explained by the first dimension, followed by the second dimension and so on. MCA can result in the detection and representation of underlying structures in a dataset by representing data as points in a low-dimensional Euclidean space (Greenacre Citation2017; Le Roux and Rouanet Citation2010). MCA was applied to investigate how strongly, and in which direction, the active variables were interrelated. Active variables included Listening situation and Speech loudness (Q2, Q3, Q6 and Q7). The Speech understanding variable was not included in the MCA (Q4 and Q8) given that they contributed little to the clusters produced in the Cluster Analysis. The influences of Preference and 4PTA were examined as supplementary variables. Supplementary variables did not contribute to the construction of the low dimensional space for the active variables, but were projected to the same space, thus enhancing interpretation. When considering the preference data, only responses coded as a preference for P1 or P2 were included; responses that included a preference for both P1 and P2 (3.6%) were removed from the MCA.
Following MCA, the hierarchical k-means clustering procedure (Kassambara Citation2017) was performed on the selected dimensions obtained from the MCA that assigns children to distinct clusters, providing a convenient interpretation of the children. First, the procedure applies the hierarchical clustering algorithm with Ward’s minimum variance criterion to produce a hierarchical clustering tree (Kaufman and Rousseeuw Citation2009; Ward Citation1963). An initial partition is then determined by cutting the tree so that the relative loss of within-cluster variance is highest. Finally, the k-means algorithm was used to improve and balance the initial partition. All statistical analyses were performed using R software version 3.5.2 (Vienna, Austria), with the lme4 1.1–25 package (Bates et al. Citation2015) and FactoMineR 1.42 package (Lê, Josse, and Husson Citation2008), used for conducting GLMMs, MCA and the hierarchical k-means clustering.
Category collapsing was used throughout the analyses to allow for easier interpretation and smoother distribution of the results. Categories from the Speech Loudness rating scale collapsed Much too loud, Too loud and A bit loud into Loud; Just right was kept as Just right; and A bit soft, Too soft and Did not hear were collapsed into Soft. Categories from the Speech Understanding rating scale collapsed About half the time, Not often and Never into Half or less, and Always and Usually were kept as separate categories.
Results
Participants were instructed to complete the EMA trial over seven days; this took an average of 9.5 d for the group of children included in the study. A total of 334 EMA entries were completed during the trial, with an average compliance rate of 82.4%. Compliance was calculated as the total number of surveys completed (334) out of a target of 406 surveys (29 participants, 2 surveys per day per participant, over a 7-d data collection period). Participants completed an average of 11.5 entries per trial (SD = 5, Max = 28 and Min = 4). A total of 35 entries were removed from the analyses, 12 of which were removed for containing references related to being completed during school time, with descriptions that included “school”, “teacher” or “in class”; the remaining 23 entries were removed for containing incomplete data entries.
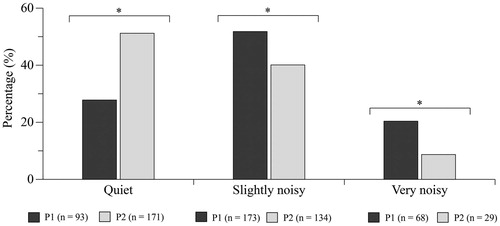
Listening situation was used to categorise the space that the children were listening in as they moved across listening activities, and according to noise level. Listening situations were reported to have higher noise levels when the children were listening through P1 and lower noise levels when listening through P2 (). The chi-squared tests based on the GLMMs applied to each listening situation indicate that listening situations were more often rated as Quiet when in P2 than in P1 (p < 0.001), as Slightly noisy when in P1 than in P2 (p = 0.001) and as Very noisy when in P1 than in P2 (p < 0.001).
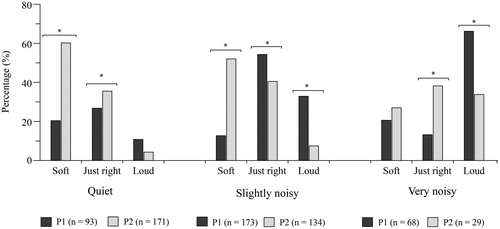
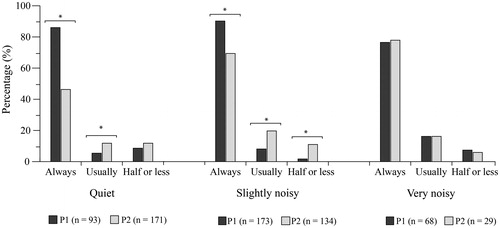
Results obtained for speech loudness ratings were analysed according to listening situation and to compare responses obtained for P1 versus P2. Results indicating a significant difference between P1 and P2 for speech loudness ratings are indicated using an asterisk in . When listening in Quiet situations, P1 was more often rated as Just right (p < 0.001) and P2 was more often rated as Soft (p < 0.001). When listening in Slightly noisy situations, P2 was more often rated as Soft (p < 0.001), P1 was more often rated as Just right (p = 0.011) or Loud (p < 0.001). In Very noisy situations, P1 was more often rated as Loud (p = 0.001) and P2 was more often rated as Just right (p = 0.001).
Figure 3. Proportion of listening situation ratings in P1 and P2. *indicates statistical significance, using a 95% criterion and n refers to the number of entries per hearing aid condition.
Results obtained for speech understanding ratings were analysed according to listening situation and to compare responses obtained for P1 versus P2. Results indicating a significant difference between P1 and P2 for speech understanding ratings are indicated using an asterisk in . When listening in Quiet situations, P1 was more often rated as Always (p < 0.001) and P2 was more often rated as Usually (p < 0.001). When listening in Slightly noisy situations, P1 was more often rated as Always (p < 0.001), P2 was more often rated as Usually (p < 0.001) and P2 was more often rated as Half or less (p < 0.001).
Figure 4. P1 versus P2 speech loudness ratings in each situation. *indicates statistical significance, using a 95% criterion and n refers to the number of entries per hearing aid condition.
Preference
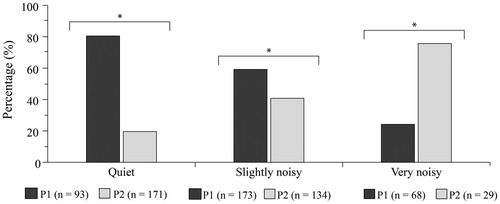
When asked to indicate a preference for P1 versus P2, the children most often preferred P1 (55.7%) to P2 (40.7%). In some cases, the children chose a preference for both P1 and P2 (3.6%) by clicking both response boxes; these responses have been removed from the analyses. Chi-squared results, based on the binomial regression, indicate that preference ratings are significantly associated with programs: X2 (1)=7.7955, p = 0.005.
Chi-squared tests per listening situation () indicate that program preference is significantly different for all listening situations. The children most often indicated a preference for P1 in Quiet (p < 0.001), P1 in Slightly noisy (p = 0.017) and P2 in Very noisy (p < 0.001) listening situations. The percentage values have been calculated to remove responses that were indicated for both P1 and P2.
Figure 5. P1 versus P2 speech understanding ratings in each situation. *indicates statistical significance, using a 95% criterion and n refers to the number of entries per hearing aid condition.
Preference results were also analysed according to hearing severity (). Chi-squared results indicate a statistically significant difference in preference ratings for the participant group with Moderately-severe (p < 0.001) and Severe 4PTA values (p < 0.001), with P1 chosen as the preferred program.
Figure 6. Program preference per situational noise level. *indicates statistical significance, using a 95% criterion and n refers to the number of entries per hearing aid condition.
Text-based responses describing preference
Participants completed 233 responses relating to their reasons for program preference, 33 responses were removed for not providing enough information to code, such as “I liked it”, “there’s no one near me” or “I don’t really have a reason”. Participants rated their preference for P1 as providing more Sound quality, with better Clarity and a better Total impression; more or optimal Loudness; more Intelligibility; better Participation; and more Familiarity. P2 was more likely to be preferred for having less Background noise and less Loudness. Participants were split between rating P1 and P2 for Comfort. summarises the participant comment categories.
Table 3. Text based comments relating to program preference.
MCA and cluster mapping results
Results from the MCA were projected onto a 2-dimensional model to allow for visual interpretation (). In general, variables (based on participant response) that are close to each other, in the low dimensional space, indicate greater association. The data used for the MCA consisted of 322 observations, with 12 active variables (related to listening situation and speech loudness, per program) and 6 supplementary variables (related to preference and hearing level). The first two dimensions of the MCA are explained by 28.1% and 18.4% of the total variance, respectively, and 46.5% of the accumulated variance. The explained variance of the remaining ten dimensions was marginally less than 16%. shows the variables projected according to results considering the first two dimensions only, where two clusters’ boundaries of observations are superimposed.
Figure 7. Program preference by hearing loss group (according to 4PTA value). *indicates statistical significance, using a 95% criterion and n refers to the number of entries per hearing aid condition.
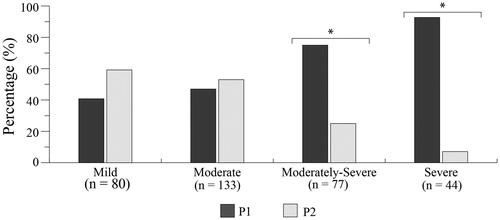
Figure 8. Variable categories projected to the first two dimensions. Categories of supplementary variables are depicted in a lighter grey font. The two clusters’ boundaries are superimposed on top of each other. HL denotes hearing loss and is displayed with a label of Mild, Moderate, Moderately-severe or Severe (according to 4PTA).
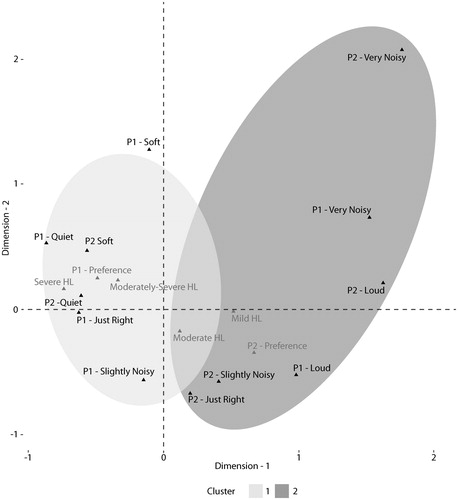
Taking into account the contributions of variables to dimensions and their relative positions, the first dimension opposed Quiet environments, Soft speech, more severe hearing loss (Moderately-severe and Severe 4PTA values) and a preference for P1 against Slightly noisy and Very noisy environments, Loud speech, less severe hearing loss (Mild and Moderate 4PTA values) and a preference for P2. The second dimension opposed Slightly noisy environments versus Very noisy environments. The clusters were determined by applying the hierarchical k-means clustering to the first seven dimensions (cumulative variance of 96.5%). The cluster results display variables that are more closely related according to the following interpretation. Cluster 1 represents situations where P1 was preferred, children had more severe hearing loss (4PTA), listening situations were rated as Quiet, and speech loudness was rated as Soft or Just right with P1 and soft with P2. Cluster 2 represents situations where P2 was preferred, children had less severe hearing loss (4PTA), listening situations were rated as Very noisy, and speech loudness was rated as Loud with P1 and Just right or Loud with P2.
Discussion
This study included the use of EMA methods with children aged 7–17 years, to effectively evaluate aided outcome across hearing dimensions and listening situations deemed to be of importance by the children. EMA surveying was completed outside of school time using self-triggering of a mobile device application. Event-based, twice daily entries were used to capture data over a 1-week trial period. These methods are in line with those previously reported in a systematic review and meta-analysis of 42 EMA protocols with children and adolescents (Wen et al. Citation2017). A high compliance rate of 82.4%, on average, resulted from our study methods, which is comparable to the 78.3% average compliance rate reported by Wen et al. (Citation2017) and that of 75% reported in daily diaries by a similar group of school-aged children using a non-EMA daily life procedure (Scollie et al. Citation2010a). The compliance rate reported in this study is higher than that reported in a systematic review of EMA studies with youths, where event-based triggered studies reported compliance to be between 47.9% and 74.1% (Heron et al. Citation2017). In a summary of EMA studies from Timmer, Hickson, and Launer (Citation2018b) compliance amongst adult hearing aid users ranged between 77% and 93%. Overall, the children in this study reported a high level of enthusiasm around the use of mobile technology to inform the hearing aid fitting process.
Repeated measures were collected, including paired comparisons, to inform aided outcomes related to two clinically available hearing aid programs: Program 1 used DSL version 5.0 child prescription targets, and Program 2 was fitted to DSL version 5.0 child targets for use in noisy listening situations. Paired comparison designs have been used in previous adult EMA research to evaluate the listener preference in real-world situations and across hearing aid settings and/or programs (Jensen et al. Citation2019; Walden et al. Citation2004; Wu et al. Citation2019). Overall, the children in this study could effectively use EMA through a mobile device application, when paired with manual hearing aid program switching. This allowed the researchers to assess aided outcomes in real-world listening situations. Outside of school time, school-aged children and adolescents who wore their hearing aids, more often reported listening situations as noisy (compared to quiet), when listening through a hearing aid program fitted with a prescription designed for listening in quiet (). This indicates the need for noise management strategies with children who wear hearing aids, and when listening in situations that are extracurricular or home-based, for example.
Furthermore, the prescription-based noise management strategy incorporated in this hearing aid study effectively reduced loudness for Very noisy listening situations. As the children moved from quiet to noisy listening situations, the proportion of Loud ratings increased (and vice versa). P2 (DSL version 5.0 for noise) effectively reduced loudness by half when in Very noisy listening situations and when compared to P1 ratings (from 66.2% to 33.8%). When in Quiet listening situations, speech loudness was most often rated to be Just right with P1 and to be Soft with P2. These results indicate that noise management is not recommended when children are in quieter listening situations. Further research is needed to assess findings when hearing aid noise management feature(s) are incorporated in the hearing aid fitting. When in Slightly noisy situations, P2 effectively reduced the proportion of Loud ratings (from 32.9% in P1 to 7.5% in P2), but also was most commonly associated with Soft ratings; ratings made with P1 (when compared to P2) related more often to Just right loudness and the highest proportion of Always for speech understanding (90.2%). Therefore, the DSL version 5.0 noise prescription (P2) is not best suited for Slightly noisy situations. Findings agree with previous research reporting decreased consonant perception for low-level input with DSL version 5.0 for noise evaluated with children (Crukley and Scollie Citation2012).
Ratings of speech understanding were more often rated as Usually or Always when considering speech understanding, in all listening situations and for both programs. The proportion of Always and Usually ratings ranged from 88.1% to 98.3% (compared to Half or less). When listening in Slightly noisy situations, prescription-based noise management had a significant effect on loudness and understanding ability.
P1 was preferred by the children in Quiet and Slightly noisy situations and P2 in Very noisy situations. Preference for P1 was also found to relate to hearing loss severity, where children presenting with Moderately-severe or Severe hearing losses were more likely to prefer P1. This finding likely relates to the need for greater audibility in the noted hearing loss groups. Preference for a higher-gain prescription for use in quiet environments versus a lower-gain prescription for use in noisy environments was previously observed in a similar group of school-aged children (Scollie et al. Citation2010a).
The children effectively contributed text-based descriptions, as the final EMA item in the survey. Preference for P1 was more commonly described by an improvement in sound quality relating to Clarity and/or Total impression; More loudness was described for P1 and Less loudness for P2; Less background noise was described for P2; and greater Intelligibility, Participation and Familiarity were described for P1. These descriptors are similar to the qualitative themes extracted from the Scollie et al. (Citation2010a) study of children’s diaries of overall hearing aid preference; these included situation-use themes relating to descriptors such as “louder and clearer” and to “reducing background noise”. The decrease in real-world loudness with P2 reported in this EMA study agrees with previously-reported laboratory ratings of loudness reduction with the addition of a DSL version 5.0 noise program in hearing aid fittings (Crukley and Scollie Citation2012).
Cluster analyses, including both active and supplemental variables, indicated that a preference for P1 was associated with more severe hearing levels, quieter listening situations and below-average ratings of speech loudness; P2 was associated with milder hearing levels, noisy listening situations and ratings that were associated with categories describing loud speech. This association between listening situation (quiet versus noisy) and hearing aid program preference, differing by tailored prescriptions for quiet versus noisy environments, agrees with findings previously reported by Scollie et al. (Citation2010a). Future research including the use of hearing aid noise management feature(s) along with prescription-based noise management is warranted.
In-situ measurements collected subjectively via EMA offer the potential to optimise hearing aid fitting in ways that are meaningful to each listener’s lifestyle and listening needs. These results suggest that audiologists could prescribe a mobile device application at the time of dispensing a hearing aid to assess the client/patient’s aided outcome across important listening situations. Future research could include an exploration of whether EMA testing also improves the likelihood of the listener becoming a successful and satisfied hearing aid user.
Due to the participants’ busy schedules and the need to involve parental-support, participant-triggered entries were used to effectively assess listening situations of interest. This triggering format does, however, limit the investigators’ ability to monitor how well EMA self-triggering aligned with active participation in the listening situations being evaluated and the minimisation of recall-based entries. Although the participants reported completing EMA entries while participating in the listening situations of interest, we do not have a way of verifying this information. The use of text-based responses improves the ability to relate the assessment results to specific events, requiring the participants to include specific details related to program preference. Many children included text-based descriptions of how specific listening partners/situational contexts influenced their preference, for example, one entry stated, “I’m in dance class and Program 2 helps me hear over the music so that I can hear people's voices”.
Recent advancements in hearing aid research now offer the potential to pair subjective EMA results with objective acoustic measures obtained directly from a device (Jensen et al. Citation2019; Kowalk et al. Citation2017). The addition of objective information in future research may allow investigators to gain further insight in how best to optimise hearing aid fittings according to the multitude of signal processing features when considering viable noise management options for children. Nonetheless, daily life research offers unique and exciting ways to engage both children and adult listeners in the hearing aid fitting process, while connecting in-situ data directly back to the hearing healthcare professional. Findings from this study and previous work in this area suggest that in-situ measurement of subjective EMA offers real-world data collected according to the listener’s unique experiences. Future research efforts could focus on how to best utilise this data to personalise hearing aid fittings to meet the real-world needs of individuals who wear hearing aids.
Disclosure statement
No potential conflict of interest was reported by the author(s).
Additional information
Funding
References
- American Speech-Language-Hearing Association 2015. “Type, Degree, and Configuration of Hearing Loss.” Audiology Information Series, 10802–10803. Rockville, MD: American Speech-Language-Hearing Association.
- Bagatto, M., S. Moodie, S. Scollie, R. Seewald, S. Moodie, J. Pumford, and K. P. R. Liu. 2005. “Clinical Protocols for Hearing Instrument Fitting in the Desired Sensation Level Method.” Trends in Amplification 9 (4): 199–226. doi:10.1177/108471380500900404.
- Baker, S., and L. Jenstad. 2017. “Matching Real-Ear Targets for Adult Hearing Aid Fittings: NAL-NL1 and DSL v5.0 Prescriptive Formulae.” Canadian Journal of Speech-Language Pathology and Audiology 41 (2):9.
- Bates, D., M. Mächler, B. Bolker, and S. Walker. 2015. “Fitting Linear Mixed-Effects Models Using lme4.” Journal of Statistical Software 67 (1): 1–48. doi:10.18637/jss.v067.i01.
- Benjamini, Y., and Y. Hochberg. 1995. “Controlling the False Discovery Rate: A Practical and Powerful Approach to Multiple Testing.” Journal of the Royal Statistical Society: Series B (Methodological) 57 (1): 289–300. doi:10.1111/j.2517-6161.1995.tb02031.x.
- Brennan, M. A., D. Lewis, R. McCreery, J. Kopun, and J. M. Alexander. 2017. “Listening Effort and Speech Recognition with Frequency Compression Amplification for Children and Adults with Hearing Loss.” Journal of the American Academy of Audiology 28 (9): 823–837. doi:10.3766/jaaa.16158.
- Chiang, J. J., and P. H. Lam. 2020. “Commentary: Ecology Momentary Assessment as a Tool for Understanding Dynamic Patterns in Child and Adolescent Health and Development – reflections on Russell and Gajos (2020).” Journal of Child Psychology and Psychiatry, and Allied Disciplines 61 (3): 395–398. doi:10.1111/jcpp.13216.
- Colombo, D., P. Cipresso, J. Fernandez Alvarez, A. Garcia Palacios, G. Riva, and C. Botella. 2018. “An Overview of Factors Associated with Adherence and Dropout to Ecological Momentary Assessments in Depression.” Annual Review of Cybertherapy and Telemedicine 16: 11–17.
- Crukley, J., and S. Scollie. 2012. “Children’s Speech Recognition and Loudness Perception with the Desired Sensation Level V5 Quiet and Noise Prescriptions.” American Journal of Audiology 21 (2): 149–162. doi:10.1044/1059-0889(2012/12-0002).
- Crukley, J., S. Scollie, and V. Parsa. 2011. “An Exploration of Non-Quiet Listening at School.” Journal of Educational Audiology 17: 23–35.
- Fahrenkamp, A., L. Sim, L. Roers, M. Canny, T. Harrison, and C. Harbeck-Weber. 2020. “An Innovative and Accessible Biofeedback Intervention for Improving Self-Regulatory Skills in Pediatric Chronic Pain: A Pilot Study.” Journal of Alternative and Complementary Medicine 26 (3): 212–217. doi:10.1089/acm.2019.0297.
- Faraway, J. J. 2016. Extending the Linear Model with R: Generalized Linear, Mixed Effects and Nonparametric Regression Models. 2nd ed. Boca Raton, FL: CRC Press.
- Gabrielsson, A., and H. Sjögren. 1979. “Perceived Sound Quality of sound-reproducing systems.” The Journal of the Acoustical Society of America 65 (4): 1019–1033. doi:10.1121/1.382579.
- Galvez, G., M. B. Turbin, E. J. Thielman, J. a Istvan, J. A. Andrews, and J. A. Henry. 2012. “Feasibility of Ecological Momentary Assessment of Hearing Difficulties Encountered by Hearing Aid Users.” Ear and Hearing 33 (4): 497–507. doi:10.1097/AUD.0b013e3182498c41.
- Govender, S., and M. Mars. 2017. “The Use of Telehealth Services to Facilitate Audiological Management for Children: A Scoping Review and Content Analysis.” Journal of Telemedicine and Telecare 23 (3): 392–401. doi:10.1177/1357633X16645728.
- Greenacre, M. 2017. Correspondence Analysis in Practice. 3rd ed. Boca Raton, FL: CRC Press.
- Harding, J., K. Harding, P. Jamieson, M. Mullally, C. Politi, E. Wong-Sing, M. Law, and T. M. Petrenchik. 2009. “Children with Disabilities’ Perceptions of Activity Participation and Environments: A Pilot Study.” Canadian Journal of Occupational Therapy 76 (3): 133–144. doi:10.1177/000841740907600302.
- Heron, K. E., R. S. Everhart, S. M. McHale, and J. M. Smyth. 2017. “Using Mobile-Technology-Based Ecological Momentary Assessment (EMA) Methods with Youth: A Systematic Review and Recommendations.” Journal of Pediatric Psychology 42 (10): 1087–1107. doi:10.1093/jpepsy/jsx078.
- Holube, I., S. Fredelake, M. Vlaming, and B. Kollmeier. 2010. “Development and Analysis of an International Speech Test Signal (ISTS).” International Journal of Audiology 49 (12): 891–903. doi:10.3109/14992027.2010.506889..
- Jensen, N. S., O. Hau, D. Lelic, P. Herrlin, F. Wolters, and K. Smeds. 2019. “Evaluation of auditory reality and hearing aids using an ecological momentary assessment (EMA) approach”. Proceedings of the 23rd International Congress on Acoustics, 6545–6552. kas. http://pub.dega-akustik.de/ICA2019/data/articles/000423.pdf.
- Jones, A., D. Remmerswaal, I. Verveer, E. Robinson, I. H. A. Franken, C. K. F. Wen, and M. Field. 2019. “Compliance with Ecological Momentary Assessment Protocols in Substance Users: A Meta-Analysis.” Addiction 114 (4): 609–619. doi:10.1111/add.14503.
- Kaplan, R. M., and A. A. Stone. 2013. “Bringing the Laboratory and Clinic to the Community: Mobile Technologies for Health Promotion and Disease Prevention.” Annual Review of Psychology 64 (1): 471–498. doi:10.1146/annurev-psych-113011-143736.
- Kassambara, A. 2017. Practical Guide to Cluster Analysis in R: Unsupervised Machine Learning, 1st ed. STHDA. https://www.datanovia.com/en/wp-content/uploads/dn-tutorials/book-preview/clustering_en_preview.pdf.
- Kaufman, L., and P. J. Rousseeuw. 2009. Finding Groups in Data: An Introduction to Cluster Analysis, Vol. 344. Hoboken, NJ: John Wiley & Sons. https://onlinelibrary.wiley.com/doi/book/10.1002/9780470316801.
- Kerrick, J. S., D. C. Nagel, and R. L. Bennett. 1969. “Multiple Ratings of Sound Stimuli.” The Journal of the Acoustical Society of America 45 (4): 1014–1017. doi:10.1121/1.1911487.
- Kowalk, U., P. von Gablenz, I. Holube, and J. Bitzer. 2017. “Adaptive Processes in Hearing.” In Proceedings of the International Symposium on Audiological and Auditory Research, edited by S. Santurette, T. Dau, J. C. Dalsgaard, L. Tranebjaerg, T. Andersen, and T. Poulsen, Vol. 7, 25–30. Ballerup, Denmark: Danavox Jubilee Foundation.
- Larson, R., and M. Csikszentmihalyi. 2014. “The Experience Sampling Method.” In Flow and the Foundations of Positive Psychology, 21–34. Berlin, Germany: Springer.
- Le Roux, B., and H. Rouanet. 2010. Multiple Correspondence Analysis. Vol. 163. Thousand Oaks, CA: Sage. https://lib.hpu.edu.vn/handle/123456789/30141.
- Lê, S., J. Josse, and F. Husson. 2008. “FactoMineR: A Package for Multivariate Analysis.” Journal of Statistical Software 25 (1): 1–18. doi:10.18637/jss.v025.i01.
- McCreery, R. W., R. A. Bentler, and P. A. Roush. 2013. “Characteristics of Hearing Aid Fittings in Infants and Young Children.” Ear and Hearing 34 (6): 701–710. doi:10.1097/AUD.0b013e31828f1033.
- Mulla, I., and W. McCracken. 2014. “Frequency Modulation for Preschoolers with Hearing Loss.” Seminars in Hearing 35 (03): 206–216. doi:10.1055/s-0034-1383505.
- Russell, M. A., and J. M. Gajos. 2020. “Annual Research Review: Ecological Momentary Assessment Studies in Child Psychology and Psychiatry.” Journal of Child Psychology and Psychiatry, and Allied Disciplines 61 (3): 376–394. doi:10.1111/jcpp.13204.
- Schinkel-Bielefeld, N., P. Kunz, A. Zutz, and B. Buder. 2020. “Evaluation of Hearing Aids in Everyday Life Using Ecological Momentary Assessment: What Situations are we Missing?” American Journal of Audiology 29 (3S): 591–609. doi:10.1044/2020_AJA-19-00075.
- Scollie, S. 2005. Prescriptive procedures for infants and children. Proceedings of the Third International Conference, Stäfa, Switzerland, 91–104.
- Scollie, S., T. Y. C. Ching, R. Seewald, H. Dillon, L. Britton, J. Steinberg, and J. Corcoran. 2010a. “Evaluation of the NAL-NL1 and DSL v4.1 Prescriptions for Children: Preference in Real World Use.” International Journal of Audiology 49 (1): S49–S63. doi:10.3109/14992020903148038.
- Scollie, S., T. Y. C. Ching, R. C. Seewald, H. Dillon, L. Britton, J. Steinberg, and K. King. 2010b. “Children’s Speech Perception and Loudness Ratings When Fitted with Hearing Aids Using the DSL v.4.1 and the NAL-NL1 Prescriptions.” International Journal of Audiology 49 (1): S26–s34. doi:10.3109/14992020903121159.
- Scollie, S., R. Seewald, L. Cornelisse, S. Moodie, M. Bagatto, D. Laurnagaray, S. Beaulac, and J. Pumford. 2005. “The Desired Sensation Level Multistage Input/Output Algorithm.” Trends in Amplification 9 (4): 159–197. doi:10.1177/108471380500900403.
- Shiffman, S., A. A. Stone, and M. R. Hufford. 2008. “Ecological Momentary Assessment.” Annual Review of Clinical Psychology 4 (1): 1–32. doi:10.1146/annurev.clinpsy.3.022806.091415.
- Stinson, J. N., B. J. Stevens, B. M. Feldman, D. Streiner, P. J. McGrath, A. Dupuis, N. Gill, and G. C. Petroz. 2008. “Construct Validity of a Multidimensional Electronic Pain Diary for Adolescents with Arthritis.” Pain 136 (3): 281–292. doi:10.1016/j.pain.2007.07.002.
- Stone, A. A., and S. Shiffman. 2002. “Capturing Momentary, Self-Report Data: A Proposal for Reporting Guidelines.” Annals of Behavioral Medicine: A Publication of the Society of Behavioral Medicine 24 (3): 236–243. doi:10.1207/S15324796ABM2403_09.
- Timmer, B. H. B., L. Hickson, and S. Launer. 2017. “Ecological Momentary Assessment: Feasibility, Construct Validity, and Future Applications.” American Journal of Audiology 26 (3S): 436–442. doi:10.1044/2017_AJA-16-0126.
- Timmer, B. H. B., L. Hickson, and S. Launer. 2018a. “Do Hearing Aids Address Real-World Hearing Difficulties for Adults with Mild Hearing Impairment? Results from a Pilot Study Using Ecological Momentary Assessment.” Trends in Hearing 22: 2331216518783608–2331216518783615. doi:10.1177/2331216518783608.
- Timmer, B. H. B., L. Hickson, and S. Launer. 2018b. “The Use of Ecological Momentary Assessment in Hearing Research and Future Clinical Applications.” Hearing Research 369: 24–28. doi:10.1016/j.heares.2018.06.012.
- Van Eeckhoutte, M., S. Scollie, R. O’Hagan, and D. Glista. 2020. “Perceptual Benefits of Extended Bandwidth Hearing Aids with Children: A Within-Subject Design Using Clinically Available Hearing Aids.” Journal of Speech, Language, and Hearing Research 63 (11): 3834–3813. doi:10.1044/2020_JSLHR-20-00271.
- von Gablenz, P., U. Kowalk, J. Bitzer, M. Meis, and I. Holube. 2019. Individual hearing aid benefit: Ecological momentary assessment of hearing abilities. Proceedings of the International Symposium on Auditory and Audiological Research, Vol. 7, 213–220. https://proceedings.isaar.eu/index.php/isaarproc/article/view/2019-26.
- Walden, B. E., R. K. Surr, M. T. Cord, and O. Dyrlund. 2004. “Predicting Hearing Aid Microphone Preference in Everyday Listening.” Journal of the American Academy of Audiology 15 (5): 365–396. doi:10.3766/jaaa.15.5.4.
- Walker, E. A., R. W. McCreery, M. Spratford, J. J. Oleson, J. Van Buren, R. Bentler, P. Roush, and M. P. Moeller. 2015. “Trends and Predictors of Longitudinal Hearing Aid Use for Children Who Are Hard of Hearing.” Ear and Hearing 36: 38S–47S. doi:10.1097/AUD.0000000000000208..
- Ward, J. H. Jr, 1963. “Hierarchical Grouping to Optimize an Objective Function.” Journal of the American Statistical Association 58 (301): 236–244. doi:10.1080/01621459.1963.10500845.
- Wen, C. K. F., S. Schneider, A. A. Stone, and D. Spruijt-Metz. 2017. “Compliance with Mobile Ecological Momentary Assessment Protocols in Children and Adolescents: A Systematic Review and Meta-Analysis.” Journal of Medical Internet Research 19 (4): e132–14. doi:10.2196/jmir.6641.
- Wu, Y. H., E. Stangl, O. Chipara, S. S. Hasan, S. DeVries, and J. Oleson. 2019. “Efficacy and Effectiveness of Advanced Hearing Aid Directional and Noise Reduction Technologies for Older Adults with Mild to Moderate Hearing Loss.” Ear and Hearing 40 (4): 805–822. doi:10.1097/AUD.0000000000000672.
- Wu, Y. H., E. Stangl, X. Zhang, and R. A. Bentler. 2015. “Construct Validity of the Ecological Momentary Assessment in Audiology Research.” Journal of the American Academy of Audiology 26 (10): 872–884. doi:10.3766/jaaa.15034.
- Zimmo, S. S. 2015. “Identification of Participation-Related Activities to Be Used as Part of the Development of a Self Efficacy Questionnaire for Adolescents with Hearing Loss.” [Electronic thesis., University of Western Ontario. https://ir.lib.uwo.ca/etd/3450.