
Abstract
This study aimed to explore the relationship between body mass index (BMI) and abdominal obesity and the risk of airflow obstruction, based on the data from the 2007–2012 National Health and Nutrition Survey (NHANES). Logistic regression was applied to assess the relationships between BMI or abdominal obesity and the risk of airflow obstruction by the fixed ratio method and the lower limit of normal (LLN) method. We further used the restricted cubic splines with 3 knots located at the 5th, 50th, and 95th percentiles of the distribution to evaluate the dose-response relationship. A total of 12,865 individuals aged 20–80 years old were included. In the fixed ratio method, underweight was positively correlated with the risk of airflow obstruction, and overweight and obesity were negatively correlated with the risk of airflow obstruction. In the LLN method, the results were consistent with the fixed ratio method. Abdominal obesity was positively associated with the risk of airflow obstruction only in the fixed ratio method (OR: 1.41, 95% CI: 1.04–1.90). There was an additive interaction between underweight and smoking on airflow obstruction in both methods. Abdominal obesity and smoking had additive interactions in the LLN method. Dose-response analysis indicated that there was a non-linear trend between BMI and the risk of airflow obstruction (Pfor nonlinearity < 0.01). Our study suggested that underweight and abdominal obesity were associated with the increased risk of airflow obstruction, and overweight and general obesity were associated with the decreased risk of airflow obstruction.
Introduction
Airflow obstruction is one of the abnormal types of spirometry, which can indicate a decline in lung function. Specifically, it mainly refers to the reduction of expiratory airflow relative to the total amount of exhaled air through spirometry [Citation1]. Airflow obstruction is associated with a variety of chronic respiratory diseases [Citation2–4], among which chronic obstructive pulmonary disease (COPD) is typically characterized by airflow obstruction that cannot be completely reversed [Citation5]. COPD not only affects the quality of life of patients, but also causes huge losses to the healthcare system annually. By 2020, the total medical cost of COPD in the United States reached $49 billion [Citation6]. The irreversibility of COPD and the heavy financial burden make prevention and treatment imperative.
Airflow obstruction is associated with a variety of factors. As the main pathogenic factor of respiratory diseases, harmful particles in cigarette smoke can not only cause lung inflammation, but also affect the ability of airway epithelial cells to maintain airway repair [Citation7]. Besides, the influence of obesity on the respiratory system has been gradually concerned [Citation8]. In America, the prevalence of overweight increased from 45.3% in 1980 to 64.2% in 2015, and the prevalence of obesity increased from 12.9% in 1980 to 28.3% in 2015 [Citation9]. The effect of obesity on lung function may be related to the inflammatory and mechanical aspects of obesity [Citation10]. In addition to general obesity measured by body mass index (BMI), abdominal obesity is also closely associated with lung function [Citation11, Citation12]. Leone et al. showed that subjects with large waist circumference had about twice the risk of forced expiratory volume in one second (FEV1) below the lower limit of normal value, even in subjects with normal BMI [Citation12].
Therefore, we explored the relationship between BMI, abdominal obesity, smoking and the risk of airflow obstruction, based on the data from the 2007–2012 National Health and Nutrition Survey (NHANES), and evaluated a dose-response relationship between BMI and the risk of airflow obstruction. We also conducted stratified analysis and evaluated the interaction effect between underweight, abdominal obesity and smoking on airflow obstruction.
Materials and methods
Data collection and study population
NHANES is an ongoing, 2-year-cycle program managed by the National Center for Health Statistics (NCHS) of the Centers for Disease Control and Prevention. As a nationally representative non-institutional sample, NHANES uses a complex, stratified, and multi-stage sample design to assess the health and nutritional status of American civilians. The data of NHANES is collected through family interviews and health examinations conducted at the Mobile Examination Center. The study protocol was approved by the NCHS Institutional Review Board and obtained the informed consent of all participants.
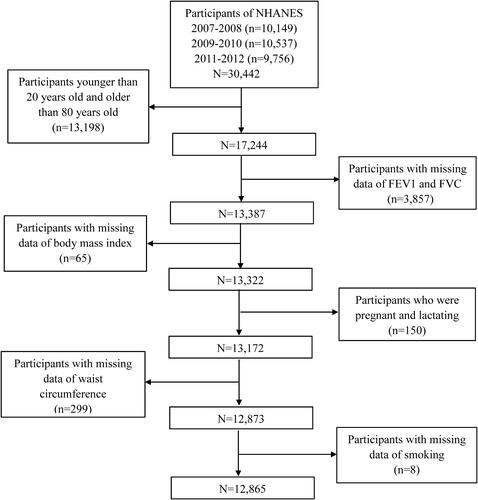
In this study, public data from three cycles of NHANES (2007–2008, 2009–2010, 2011–2012) were used. In NHANES 2007–2012, there were a total of 30,442 individuals and our analyses were limited to 17,244 individuals aged 20–80. Of these, the individuals without complete data of FEV1/forced vital capacity (FVC) (n = 3,857), with missing data of BMI (n = 65), with missing data of waist circumference (WC) (n = 299), with incomplete data of smoking (n = 8), and females who were pregnant or lactating (n = 150) were further excluded. In the end, a total of 12,865 participants were included in the analyses ().
Figure 1. Flow chart of the screening process for the selection of eligible participants.
BMI and WC assessment
BMI is the simplest and most extensive anthropometric method to measure general obesity [BMI = weight (kg)/height (m)2]. The division of BMI is based on World Health Organization standards: (1) underweight: <18.5 kg/m2; (2) normal weight: 18.5 to <25.0 kg/m2; (3) overweight: 25.0 to <30 kg/m2; and (4) general obesity: ≥30 kg/m2. Normal weight was used as the reference group. However, BMI does not reflect the difference in body fat distribution [Citation13]. WC is the most common and convenient indicator to measure abdominal obesity [Citation14]. Abdominal obesity is defined as waist circumference ≥102 cm in men and ≥88 cm in women.
Lung function assessment
Lung function outcomes included: FEV1, FVC, and FEV1/FVC. There are two definitions of airflow obstruction: (1) The Global Chronic Obstructive Pulmonary Disease Initiative (GOLD) defined subjects with post-bronchodilator FEV1/FVC less than 70% to have airflow obstruction [Citation5]. Considering that a large number of participants may have medical contraindications for bronchodilator therapy, there are limited data on post-bronchodilators in NHANES. So in this study, we used the date of pre-bronchodilator. There are also some studies that use this diagnostic criterion to diagnose airflow obstruction [Citation15, Citation16]. (2) The American Thoracic Society (ATS) and the European Respiratory Society (ERs) recommend that the lower limit of normal (LLN) be defined as a threshold at which FEV1/FVC is less than the fifth percentile [Citation1, Citation17].
Other covariates
In order to control the influence of potential confounding factors, the following covariates were included: age (20–39 years, 40–59 years, and ≥60 years), sex (male and female), race (Mexican American, Other Hispanic, Non-Hispanic White, Non-Hispanic Black, and Other races), educational level (below high school, high school, and above high school), annual household income (<$20,000 and ≥$20,000), work activity (vigorous activity, moderate activity, and other), recreational activity (vigorous activity, moderate activity, and other), smoking (smoking at least 100 cigarettes in life or not), marital status (married, living with partner, widowed, divorced, separated, and never married), diabetes (yes, or no), hypertension (yes, or no), and respiratory illness (yes, or no). The covariate "respiratory illness" in NHANES was defined that in the past 7 days, have you had a cough, cold, phlegm, runny nose or other respiratory illness?
Statistical analysis
In order to make a nationally representative estimate, appropriate sampling weights and stratum information were applied in this study. Considering the complex sampling design, all analyses were adjusted according to the survey design and weight variables. Because this study combined three cycles of NHANES data, a new sample weight (the original 2-year sample weight divided by 3) was constructed before the analysis. Kolmogorov-Smirnov normality test was used to test the normality of continuous variables. Normally distributed variables were described by mean ± standard deviation, and non-normally distributed variables were described by median (interquartile difference). The student’s t-test was adopted to compare the mean levels between the airflow obstruction group and the non-airflow obstruction group if the variable was normally distributed, otherwise, the Mann-Whitney U test was adopted. Chi-square test was adopted to compare the percentage of categorical variables between individuals with and without airflow obstruction.
Logistic regression analysis was used to calculate the odds ratio (OR) of the risk of airflow obstruction according to BMI, smoking, and abdominal obesity. Model 1 was adjusted for age and sex. Model 2 was additionally adjusted for race, educational level, smoking status, family income, marital status, work activity, recreational activity, hypertension, diabetes, and respiratory illness. In addition, taking non-abdominal obesity and normal weight as a reference, we combined abdominal obesity with BMI to intensively explore the relationship between different categories of BMI and the risk of airflow obstruction under abdominal obesity/non-abdominal obesity. Non-abdominal obesity was categorized into four groups (underweight, normal weight, overweight, and general obesity). There were no subjects with underweight and abdominal obesity in our data, so abdominal obesity was divided into three groups (normal weight, overweight, and general obesity). And the stratified analysis was performed by sex and smoking status to further examine the associations between BMI, abdominal obesity with the risk of airflow obstruction.
The additive model was used to explore the existence of biological interaction. First, divide the participants into four groups according to whether they are underweight or abdominal obesity. The additive interaction of underweight or abdominal obesity and smoking on the risk of airflow obstruction was tested by calculating the relative excess risk due to interaction (RERI), the attributable proportion due to interaction (AP), and the synergy index (SI). The above indicators are calculated using the Excel table designed by Andersson et al. [Citation18]. We further used the restricted cubic splines with 3 knots located at the 5th, 50th, and 95th percentiles of the distribution to evaluate the dose-response relationship. The p-value of non-linearity was calculated by testing the value of the coefficient of the second spline of zero. All statistical analyses were conducted by SPSS 24.0 and Stata 15.0 (Stata Corporation, College Station TX, USA). A two-sided p < 0.05 was considered statistically significant.
Results
The characteristics of 12,865 eligible participants were shown in . Males accounted for 50.6% of all participants. According to the fixed ratio method (FEV1/FVC < 70%), the prevalence of airflow obstruction was 13.6%; according to the LLN method (FEV1/FVC < the fifth percentile), the prevalence of airflow obstruction was 10.6%. Airflow obstruction was more likely to occur in older, male, Non-Hispanic White participants, and smokers. Those with airflow obstruction were more likely to have higher education, higher income and lower levels of recreational activities.
Table 1. Characteristics of participants by airflow obstruction, NHANES 2007–2012, adults ≥20 years and ≤80 years of age.
The weighted ORs and 95% CIs of airflow obstruction based on different grades of BMI were shown in . When airflow obstruction was defined by the fixed ratio method, compared with normal weight, the ORs with 95% CIs of airflow obstruction for underweight, overweight, and general obesity was 1.61 (1.13–2.30), 0.87 (0.77–0.98), and 0.61 (0.54–0.69), respectively. After adjusting age and sex (model 1), underweight, overweight, and general obesity were still associated with airflow obstruction. After further adjusting race, educational level, annual household income, work activity, recreational activity, smoking, marital status, hypertension, and respiratory illness (model 2), the adjusted ORs with 95% CIs of airflow obstruction for underweight, overweight, and general obesity were 1.97 (1.13–3.44), 0.54 (0.43–0.68), and 0.47 (0.37–0.60), respectively. In model 2, compared to nonsmokers, the adjusted OR with 95% CI of airflow obstruction for smokers was 2.81 (2.28–3.46). When airflow obstruction was defined by the LLN method, underweight was also positively correlated with the risk of airflow obstruction, and overweight and obesity were negatively correlated with the risk of airflow obstruction.
Table 2. Weighted odds ratios (95% confidence intervals) of airflow obstruction across body mass index and smoking, NHANES 2007–2012 (N = 12,865).
The association between BMI and the risk of airflow obstruction in stratified analyses by sex and smoking status were shown in . Based on the fixed ratio method, overweight and obesity were all negatively associated with the risk of airflow obstruction; underweight was still positively related to the risk of airflow obstruction in women (OR: 2.46, 95% CI: 1.25–4.86) and smokers (OR: 2.13, 95% CI: 1.13–4.00), but not in men (OR: 1.09, 95% CI: 0.42–1.81) and nonsmokers (OR: 1.65, 95% CI: 0.53–5.09). When airflow obstruction was defined by the LLN method, underweight was not significantly associated with airflow obstruction in stratified analyses; overweight and obesity were only significantly associated with airflow obstruction in women and smokers.
Table 3. Weighted odds ratios (95% confidence intervals) of airflow obstruction across body mass index, stratified by sex and smoking, NHANES 2007–2012 (N = 12,865).
The weighted ORs and 95% CIs of airflow obstruction based on the combination of abdominal obesity with BMI were shown in . Compared with non-abdominal obesity and normal weight, the multivariate-adjusted ORs with 95% CIs of airflow obstruction (fixed ratio method) for underweight, overweight, and general obesity in non-abdominal obesity group was 2.06 (1.18–3.60), 0.49 (0.35–0.67), and 0.61 (0.23–1.61), respectively. Underweight was associated with an increased risk of airflow obstruction in people without abdominal obesity. There were no subjects with underweight in the abdominal obesity group, so the multivariate-adjusted ORs with 95% CIs of airflow obstruction for normal weight, overweight, and general obesity in the abdominal obesity group was 1.42 (0.84–2.40), 0.62 (0.46–0.83), and 0.49 (0.37–0.63), respectively. High BMI has been associated with a decreased risk of airflow obstruction regardless of abdominal obesity. In the LLN method, the results were consistent with the fixed ratio method.
Table 4. Weighted odds ratios (95% confidence intervals) of airflow obstruction across abdominal obesity and body mass index, NHANES 2007–2012 (N = 12,865).
The adjusted ORs and 95% CIs of airflow obstruction based on abdominal obesity were shown in . And we further stratified analyses by sex and smoking status. The adjusted OR and 95% CI of airflow obstruction (fixed ratio method) based on abdominal obesity was 1.41 (1.04–1.90). The relationship between abdominal obesity and airflow obstruction remained significant in men (OR: 1.81, 95% CI: 1.21–2.74) and smokers (OR: 1.46, 95% CI: 1.03–2.08), but not in women (OR: 1.16, 95% CI: 0.72–1.86) and nonsmokers (OR: 1.24, 95% CI: 0.71–2.17). In the LLN method, the relationship between abdominal obesity and airflow obstruction was not statistically significant.
Table 5. Weighted odds ratios (95% confidence intervals) of airflow obstruction across abdominal obesity and stratified by sex and smoking, NHANES 2007–2012 (N = 12,865).
According to BMI and smoking status, participants were divided into 4 subgroups. The additive interaction effects between underweight and smoking were showed in . After adjusting for age, sex, and WC, RERI was 3.916 (95% CI 0.243–7.588), indicating that due to the additive interaction, there would be 3.916 relative excess risk. AP was 0.540 (95% CI 0.231–0.848), indicating that 54% of airflow obstruction can be attributed to the additive interaction of underweight and smoking. SI was 2.673 (95% CI 1.106–6.460), indicating that the risk of airflow obstruction for underweight smokers was 2.673 times higher than the total risk for participants exposed to underweight or smoking any single risk factor. The results of sex stratification showed that there was a significant additive interaction between underweight and smoking in women (RERI = 8.552 (95% CI 1.187–15.918); AP = 0.711 (95% CI 0.506–0.915); SI = 4.442 (95% CI 1.903–10.367)), but not in men. In the LLN method, there was additive interaction between underweight and smoking on airflow obstruction (RERI = 4.216 (95% CI 0.074–8.359); AP = 0.518 (95% CI 0.222–0.815); SI = 2.445 (95% CI 1.144–5.226)), and it also existed in women (RERI = 8.914 (95% CI 0.872–16.956); AP = 0.719 (95% CI 0.508–0.929); SI = 4.581 (95% CI 1.872–11.207)), which was consistent with the above results of the fixed ratio method.
Table 6. Interaction effects between underweight and smoking.
The additive interaction effects between abdominal obesity and smoking were presented in . None of the RERI or AP or SI values were statistically significant between abdominal obesity and smoking after adjusting for age, sex, and BMI. However, the results of sex stratification indicated that abdominal obesity and smoking have a significant additive interaction effect in men (RERI = 0.804 (95% CI 0.087–1.521); AP = 0.251 (95% CI 0.049–0.382); and SI = 1.417 (95% CI 1.038–1.934)), but not in women. In the LLN method, there was an additive interaction between abdominal obesity and smoking on airflow obstruction (RERI = 1.059 (95% CI 0.276–1.841); AP = 0.213 (95% CI 0.079–0.347); and SI = 1.417 (95% CI 1.091–1.703)), but not in sex stratification.
Table 7. Interaction effects between abdominal obesity and smoking.
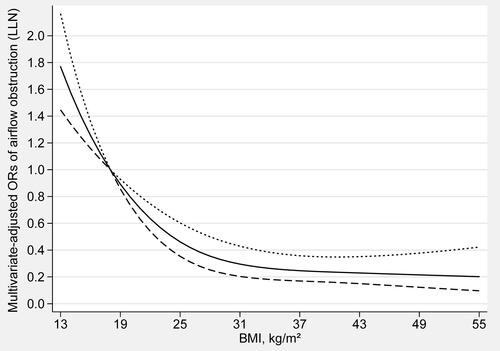
The dose-response relationship between BMI and the risk of airflow obstruction was shown in (fixed ratio) and (LLN). The trend of BMI and the risk of airflow obstruction was completely consistent in both methods. There was an L-shaped and non-linear negative association between BMI and airflow obstruction (Pfor nonlinearity < 0.01) in restricted cubic spline models. When BMI is less than 17 kg/m2 (OR: 1.12, 95% CI: 1.08–1.16), the risk of airflow obstruction gradually increases with the decrease of BMI. When BMI exceeds 18 kg/m2 (OR: 1.00, 95% CI: 1.00–1.00), the risk of airflow obstruction gradually decreases with the increase of BMI. When BMI exceeds 32 kg/m2 (OR: 0.29, 95% CI: 0.21–0.42), as BMI increases, the risk of airflow obstruction will not further decrease.
Figure 2. Dose-response relationship between BMI and the ORs of airflow obstruction (FR). The solid line and dashed line represent the estimated ORs and their 95% confidence intervals. BMI, body mass index; FR, fixed ratio; LLN, lower limit of normal; OR, odds ratio.
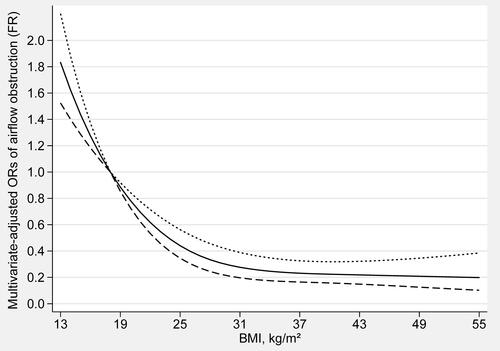
Figure 3. Dose-response relationship between BMI and the ORs of airflow obstruction (LLN). The solid line and dashed line represent the estimated ORs and their 95% confidence intervals. BMI, body mass index; FR, fixed ratio; LLN, lower limit of normal; OR, odds ratio.
Discussion
In this study, we found that underweight, abdominal obesity, and smoking were associated with the increased risk of airflow obstruction, and overweight and general obesity were associated with the decreased risk of airflow obstruction. We used two methods to define airflow obstruction, and the results were slightly different but basically consistent. The dose-response relationship showed that BMI had L-shaped and non-linear associations with the risk of airflow obstruction. When BMI up to 33 kg/m2, OR is close to the threshold, the line begins to reach a plateau.
The mechanism of BMI and airflow obstruction is not yet fully clear. A meta-analysis of clinical trials found a significant correlation between BMI and the rate of decline in lung function [Citation19]. Specifically, lower BMI was associated with a faster FEV1 decrease compared to a normal BMI, and higher BMI was associated with slower FEV1 decline [Citation20, Citation21]. In addition, underweight can lead to the loss of respiratory muscle and skeletal muscle mass, affecting lung function [Citation22]. These findings might be partly explained that underweight was associated with a higher risk of airflow obstruction.
The main symptom of COPD patients is shortness of breath during progressive exercise. The main mechanism to explain this symptom is the development of pulmonary hyperinflation (LH), which is defined as the abnormal increase of gas volume in the airway and lung, resulting in an increase of functional residual capacity (FRC) exceeding the predicted value [Citation23, Citation24]. Since the static lung volume decreases with the increase of BMI, general obesity also has a protective effect on the level of hyperinflation [Citation25, Citation26]. Therefore, the increase of BMI may have some beneficial physiological effects on airflow obstruction. Many studies have shown that obesity may have a protective effect on patients with advanced COPD, which may be related to the "obesity paradox" [Citation27–29]. The obesity paradox usually refers to the contradictory relationship between obesity and the improvement of survival rate for those with major or chronic diseases [Citation30]. P Chittal et al. found that cardiopulmonary fitness (CRF) may be the main reason for this "obesity paradox". Overweight and obese individuals have higher CRF and better functional results [Citation29]. In addition, the main effect of obesity on lung function is not only the reduction of FRC and expiratory reserve volume (ERV), but also the decrease of FEV1 and FVC with the increase of BMI [Citation31, Citation32]. Colak et al. found that FVC decreased more significantly than FEV1, which may result in underdiagnosis of airflow restriction in overweight and obesity individuals [Citation33]. The relationship between high BMI and airflow obstruction needs to be further verified by cohort study.
Although BMI is usually used as a comprehensive indicator to measure body weight, one of its limitations is that it does not consider differences in fat distribution. Body fat distribution is closely related to lung function [Citation34]. A cohort study from Italy showed that abdominal obesity has the independent ability to predict lung damage [Citation35]. Furthermore, it has been demonstrated that other abdominal obesity markers, such as waist-hip ratio or abdominal height, are inversely proportional to FEV1 and FVC when adjusted for BMI [Citation36, Citation37]. Abdominal obesity may affect pulmonary function through a mechanism different from general obesity. In individuals with abdominal obesity, fat accumulates in the chest and abdomen, restricting the downward movement of the diaphragm and the outward movement of the chest wall. The limitation of diaphragm movement and rib movement is critical to ventilation mechanics [Citation38].
Sex differences in fat distribution patterns are one of the mechanisms of sex differences in lung function impairment caused by abdominal obesity. Male fat is mainly concentrated in the chest and abdominal visceral adipose tissue, forming an "apple-shaped" distribution, while female fat is mainly concentrated in the subcutaneous adipose tissue of hips and thighs, forming a "pear-shaped" distribution [Citation39, Citation40]. The subcutaneous adipose tissue absorbs free fatty acids and triglycerides in the circulation, but it can actually provide a protective effect, which is more in women [Citation41]. However, the excess fatty tissue deposits in the abdomen will produce greater resistance to the diaphragm and hinder the ventilation mechanism [Citation31, Citation35]. In other words, the fat distribution around the abdominal organs, which is concentrated mainly in men, is associated with an increased risk of impaired lung function [Citation42, Citation43].
At present, there are two mainstream methods to define airflow obstruction: the fixed ratio method and the LLN method. Although the fixed ratio method is a simple and effective method to diagnose airflow obstruction, it is easy to over diagnose the elderly because the FEV1/FVC ratio decreases with age [Citation44–46]. In addition, defining airflow obstruction as a fixed ratio of FEV1/FVC will lead to age, height, sex, and race related bias [Citation47]. The use of the LLN method can not only avoid this bias, but also reduce the risk of false-positive diagnoses in elderly subjects and false-negative diagnoses in young subjects [Citation48]. But a study based on pooled data from four U.S. general population cohorts supported 0.70 as the best FEV1/FVC threshold for determining clinically significant airflow obstruction [Citation49]. This study suggests that 0.70 may be applicable to all adults because there is no significant threshold that is more accurate than 0.70 in the analysis adjusted for anthropometric and sociodemographic characteristics. Therefore, we use two methods to judge airflow obstruction and find that the two results are basically consistent.
Compared with previous research, there are main significant advantages in our research. First, we used two methods (fixed ratio method and LLN method) to define airflow obstruction and compare the results. Second, we found that the relationship between different grades of BMI (underweight, overweight, and general obesity) and the risk of airflow obstruction was inconsistent. Third, we not only considered the fat distribution and studied the relationship between abdominal obesity and the risk of airflow obstruction, but also combined BMI and abdominal obesity to further explore the relationship between them. Fourthly, we analyzed the interaction between underweight or abdominal obesity and smoking, which is not available in previous studies.
However, there are also several limitations in our study. First, as a cross-sectional study, it is difficult to determine causality between BMI, abdominal obesity, and the risk of airflow obstruction. we cannot exclude the possibility of reverse causality. Second, although abdominal obesity can indicate the distribution of fat, it does not represent the proportion of fat. The relationship between body fat percentage and lung function can be further studied in the future. Third, due to the lack of asthma data, the analysis of the relationship between BMI and airflow obstruction may not be comprehensive enough. Fourth, the reversibility of airflow obstruction cannot be judged by the data of pre-bronchodilators.
Conclusions
In conclusion, our study suggested that BMI and abdominal obesity were associated with airflow obstruction. Specifically, underweight and abdominal obesity were associated with the increased risk of airflow obstruction, and overweight and general obesity were associated with the decreased risk of airflow obstruction. Underweight and abdominal obesity have significant additive interaction with smoking on airflow obstruction. Further large-scale prospective studies are needed to confirm these conclusions.
| Abbreviations | ||
| AP | = | attributable proportion due to interaction |
| CI | = | confidence interval |
| COPD | = | chronic obstructive pulmonary disease |
| CRP | = | C-reactive protein |
| EELV | = | end-expiratory lung volume |
| ERV | = | expiratory reserve volume |
| FEV1 | = | forced expiratory volume in one second |
| FVC | = | forced vital capacity |
| GOLD | = | Global Chronic Obstructive Pulmonary Disease Initiative |
| FR | = | fixed ratio |
| LLN | = | lower limit of normal |
| NCHS | = | National Center for Health Statistics |
| NHANES | = | National Health and Nutrition Survey |
| OR | = | odd ratio |
| RERI | = | relative excess risk due to interaction |
| SI | = | synergy index |
| WC | = | waist circumference |
Declaration of interests
The authors declare that they have no competing interests.
Funding
The author(s) reported there is no funding associated with the work featured in this article.
References
- Eschenbacher WL. Defining airflow obstruction. J Copd F. 2016;3(2):515–518. DOI:10.15326/jcopdf.3.2.2015.0166
- Kim V, Criner GJ. Chronic bronchitis and chronic obstructive pulmonary disease. Am J Respir Crit Care Med. 2013;187(3):228–237. DOI:10.1164/rccm.201210-1843CI
- Thurlbeck WM. Pathology of chronic airflow obstruction. Chest. 1990;97(2 Suppl):6s–10s. DOI:10.1016/S0012-3692(15)41137-7
- Garcia B, Flume PA. Pulmonary complications of cystic fibrosis. Semin Respir Crit Care Med. 2019;40(6):804–809. DOI:10.1055/s-0039-1697639
- Vestbo J, Hurd SS, Agustí AG, et al. Global strategy for the diagnosis, management, and prevention of chronic obstructive pulmonary disease: GOLD executive summary. Am J Respir Crit Care Med. 2013;187(4):347–365. DOI:10.1164/rccm.201204-0596PP
- Criner RN, Han MK. COPD care in the 21st century: a public health priority. Respir Care. 2018;63(5):591–600. DOI:10.4187/respcare.06276
- Wang H, Liu X, Umino T, et al. Cigarette smoke inhibits human bronchial epithelial cell repair processes. Am J Respir Cell Mol Biol. 2001;25(6):772–779. DOI:10.1165/ajrcmb.25.6.4458
- Seidell JC, Halberstadt J. The global burden of obesity and the challenges of prevention. Ann Nutr Metab. 2015;66(Suppl 2):7–12. DOI:10.1159/000375143
- Chooi YC, Ding C, Magkos F. The epidemiology of obesity. Metabolism. 2019;92:6–10. DOI:10.1016/j.metabol.2018.09.005
- Dixon AE, Peters U. The effect of obesity on lung function. Expert Rev Respir Med. 2018;12(9):755–767. DOI:10.1080/17476348.2018.1506331
- He H, Wang B, Zhou M, et al. Systemic inflammation mediates the associations between abdominal obesity indices and lung function decline in a Chinese general population. DMSO. 2020;13:141–150. DOI:10.2147/DMSO.S229749
- Leone N, Courbon D, Thomas F, et al. Lung function impairment and metabolic syndrome: the critical role of abdominal obesity. Am J Respir Crit Care Med. 2009;179(6):509–516. DOI:10.1164/rccm.200807-1195OC
- WHO Consultation on Obesity (1999: Geneva, Switzerland) and World Health Organization. Obesity : preventing and managing the global epidemic: report of a WHO consultation. World Health Organization; 2000. WHO technical report series. 894, 252 p. https://apps.who.int/iris/handle/10665/42330
- Han TS, McNeill G, Seidell JC, et al. Predicting intra-abdominal fatness from anthropometric measures: the influence of stature. Int J Obes Relat Metab Disord. 1997;21(7):587–593. DOI:10.1038/sj.ijo.0800446
- Christopher DJ, Oommen AM, George K, et al. Prevalence of airflow obstruction as measured by spirometry, in rural Southern Indian adults. COPD. 2020;17(2):128–135. DOI:10.1080/15412555.2020.1723074
- Shin SH, Park J, Cho J, et al. Severity of airflow obstruction and work loss in a nationwide population of working age. Sci Rep. 2018;8(1):9674. DOI:10.1038/s41598-018-27999-6
- Bhatt SP, Sieren JC, Dransfield MT, et al. Comparison of spirometric thresholds in diagnosing smoking-related airflow obstruction. Thorax. 2014;69:409–414.
- Andersson T, Alfredsson L, Källberg H, et al. Calculating measures of biological interaction. Eur J Epidemiol. 2005;20(7):575–579. DOI:10.1007/s10654-005-7835-x
- Sun Y, Milne S, Jaw JE, et al. BMI is associated with FEV(1) decline in chronic obstructive pulmonary disease: a meta-analysis of clinical trials. Respir Res. 2019;20(1):236. DOI:10.1186/s12931-019-1209-5
- Celli BR, Thomas NE, Anderson JA, et al. Effect of pharmacotherapy on rate of decline of lung function in chronic obstructive pulmonary disease - Results from the TORCH study. Am J Respir Crit Care Med. 2008;178(4):332–338. DOI:10.1164/rccm.200712-1869OC
- Vestbo J, Anderson JA, Brook RD, SUMMIT Investigators, et al. Fluticasone furoate and vilanterol and survival in chronic obstructive pulmonary disease with heightened cardiovascular risk (SUMMIT): a double-blind randomised controlled trial. Lancet. 2016;387(10030):1817–1826. DOI:10.1016/S0140-6736(16)30069-1
- Gosker HR, Wouters EF, van der Vusse GJ, et al. Skeletal muscle dysfunction in chronic obstructive pulmonary disease and chronic heart failure: underlying mechanisms and therapy perspectives. Am J Clin Nutr. 2000;71(5):1033–1047. DOI:10.1093/ajcn/71.5.1033
- Rossi A, Aisanov Z, Avdeev S, et al. Mechanisms, assessment and therapeutic implications of lung hyperinflation in COPD. Respir Med. 2015;109(7):785–802. DOI:10.1016/j.rmed.2015.03.010
- Gagnon P, Guenette JA, Langer D, et al. Pathogenesis of hyperinflation in chronic obstructive pulmonary disease. Int J Chron Obstruct Pulmon Dis. 2014;9:187–201.
- Hanson C, Rutten EP, Wouters EFM, et al. Influence of diet and obesity on COPD development and outcomes. Int J Chron Obstruct Pulmon Dis. 2014;9:723–733. DOI:10.2147/COPD.S50111
- Alter P, Rabe KF, Schulz H, et al. Influence of body mass on predicted values of static hyperinflation in COPD. COPD. 2018;13:2551–2555. DOI:10.2147/COPD.S164096
- Marti S, Muñoz X, Rios J, et al. Body weight and comorbidity predict mortality in COPD patients treated with oxygen therapy. Eur Respir J. 2006;27(4):689–696. DOI:10.1183/09031936.06.00076405
- Guenette JA, Jensen D, O’Donnell DE. Respiratory function and the obesity paradox. Curr Opin Clin Nutr Metab Care. 2010;13(6):618–624.
- Chittal P, Babu AS, Lavie CJ. Obesity paradox: does fat alter outcomes in chronic obstructive pulmonary disease? COPD. 2015;12(1):14–18. DOI:10.3109/15412555.2014.915934
- Lavie CJ, Milani RV, Ventura HO. Obesity and cardiovascular disease: risk factor, paradox, and impact of weight loss. J Am Coll Cardiol. 2009;53(21):1925–1932. DOI:10.1016/j.jacc.2008.12.068
- Salome CM, King GG, Berend N. Physiology of obesity and effects on lung function. J Appl Physiol (1985). 2010;108(1):206–211. DOI:10.1152/japplphysiol.00694.2009
- O’Donnell DE, Deesomchok A, Lam Y-M, et al. Effects of BMI on static lung volumes in patients with airway obstruction. Chest. 2011;140(2):461–468. DOI:10.1378/chest.10-2582
- Çolak Y, Marott JL, Vestbo J, Lange P. Overweight and obesity may lead to under-diagnosis of airflow limitation: findings from the copenhagen city heart study. COPD. 2015;12(1):5–13. DOI:10.3109/15412555.2014.933955
- Canoy D, Luben R, Welch A, et al. Abdominal obesity and respiratory function in men and women in the EPIC-Norfolk study, United Kingdom. Am J Epidemiol. 2004;159(12):1140–1149. DOI:10.1093/aje/kwh155
- Vatrella A, Calabrese C, Mattiello A, et al. Abdominal adiposity is an early marker of pulmonary function impairment: Findings from a Mediterranean Italian female cohort. Nutr Metab Cardiovasc Dis. 2016;26(7):643–648. DOI:10.1016/j.numecd.2015.12.013
- Lam KB, Jordan RE, Jiang CQ, et al. Airflow obstruction and metabolic syndrome: the Guangzhou Biobank Cohort study. Eur Respir J. 2010;35(2):317–323. DOI:10.1183/09031936.00024709
- Park BH, Park MS, Chang J, et al. Chronic obstructive pulmonary disease and metabolic syndrome: a nationwide survey in Korea. Int J Tuberc Lung Dis. 2012;16(5):694–700. DOI:10.5588/ijtld.11.0180
- Melo LC, Silva MA, Calles AC. Obesity and lung function: a systematic review. Einstein (Sao Paulo). 2014;12(1):120–125. DOI:10.1590/s1679-45082014rw2691
- Fried SK, Lee MJ, Karastergiou K. Shaping fat distribution: New insights into the molecular determinants of depot- and sex-dependent adipose biology. Obesity (Silver Spring). 2015;23(7):1345–1352. DOI:10.1002/oby.21133
- Wells JC. Sexual dimorphism of body composition. Best Pract Res Clin Endocrinol Metab. 2007;21(3):415–430. DOI:10.1016/j.beem.2007.04.007
- Chang E, Varghese M, Singer K. Gender and sex differences in adipose tissue. Curr Diab Rep. 2018;18(9):69. DOI:10.1007/s11892-018-1031-3
- Stevens J, Katz EG, Huxley RR. Associations between gender, age and waist circumference. Eur J Clin Nutr. 2010;64(1):6–15. DOI:10.1038/ejcn.2009.101
- Smith SR, Lovejoy JC, Greenway F, et al. Contributions of total body fat, abdominal subcutaneous adipose tissue compartments, and visceral adipose tissue to the metabolic complications of obesity. Metabolism. 2001;50(4):425–435. DOI:10.1053/meta.2001.21693
- Vollmer WM, Gíslason T, Burney P, et al. Comparison of spirometry criteria for the diagnosis of COPD: results from the BOLD study. Eur Respir J. 2009;34(3):588–597. DOI:10.1183/09031936.00164608
- Hnizdo E, Glindmeyer HW, Petsonk EL, et al. Case definitions for chronic obstructive pulmonary disease. COPD. 2006;3(2):95–100. DOI:10.1080/15412550600651552
- Hardie JA, Buist AS, Vollmer WM, et al. Risk of over-diagnosis of COPD in asymptomatic elderly never-smokers. Eur Respir J. 2002;20(5):1117–1122. DOI:10.1183/09031936.02.00023202
- Quanjer PH, Stanojevic S, Cole TJ, ERS Global Lung Function Initiative, et al. Multi-ethnic reference values for spirometry for the 3-95-yr age range: the global lung function 2012 equations. Eur Respir J. 2012;40(6):1324–1343. DOI:10.1183/09031936.00080312
- Wollmer P, Engström G. Fixed ratio or lower limit of normal as cut-off value for FEV1/VC: an outcome study. Respir Med. 2013;107(9):1460–1462. DOI:10.1016/j.rmed.2013.06.016
- Bhatt SP, Balte PP, Schwartz JE, et al. Discriminative accuracy of FEV1:FVC thresholds for COPD-Related hospitalization and mortality. JAMA. 2019;321(24):2438–2447. DOI:10.1001/jama.2019.7233