
Abstract
The demand for botanicals and natural substances in consumer products has increased in recent years. These substances usually contain proteins and these, in turn, can pose a risk for immunoglobulin E (IgE)-mediated sensitization and allergy. However, no method has yet been accepted or validated for assessment of potential allergenic hazards in such materials. In the studies here, a dual proteomic-bioinformatic approach is proposed to evaluate holistically allergenic hazards in complex mixtures of plants, insects, or animal proteins. Twelve commercial preparations of source materials (plant products, dust mite extract, and preparations of animal dander) known to contain allergenic proteins were analyzed by label-free proteomic analyses to identify and semi-quantify proteins. These were then evaluated by bioinformatics using AllerCatPro 2.0 (https://allercatpro.bii.a-star.edu.sg/) to predict no, weak, or strong evidence for allergenicity and similarity to source-specific allergens. In total, 4,586 protein sequences were identified in the 12 source materials combined. Of these, 1,665 sequences were predicted with weak or strong evidence for allergenic potential. This first-tier approach provided top-level information about the occurrence and abundance of proteins and potential allergens. With regards to source-specific allergens, 129 allergens were identified. The sum of the relative abundance of these allergens ranged from 0.8% (lamb’s quarters) to 63% (olive pollen). It is proposed here that this dual proteomic-bioinformatic approach has the potential to provide detailed information on the presence and relative abundance of allergens, and can play an important role in identifying potential allergenic hazards in complex protein mixtures for the purposes of safety assessments.
Introduction
All foreign proteins are potentially immunogenic, and some are also allergenic, having the ability to induce sensitization. With an increasing demand for sustainable natural ingredients for personal care and consumer products there is an associated need for an holistic approach to the evaluation of the hazards and risks associated with exposure to protein allergens. A recent publication (Krutz et al. Citation2023) provided a description of a new paradigm for allergenicity safety assessment of proteins used in consumer products based on the use of AllerCatPro 2.0 (Nguyen et al. Citation2022; https://allercatpro.bii.a-star.edu.sg/). AllerCatPro 2.0 is an updated version of a previously described web-based application AllerCatPro (Maurer-Stroh et al. Citation2019) that offers new features that support allergenicity hazard assessment.
An important requirement is that potentially allergenic proteins can be identified and characterized accurately. However, there are some important challenges associated with this. A critical consideration for predicting the allergenic activity of proteins is discrimination between protein immunogens and protein allergens. This raises questions about the structural and/or functional features that characterize potentially allergenic proteins and which distinguish them from their non-allergenic counterparts. The question can be stated more simply as what properties confer on proteins the ability to elicit immunoglobulin E (IgE) antibody responses and the development of allergic sensitization? This question has been addressed previously by several investigators (Huby et al. Citation2000; Bredehorst and David Citation2001; Kimber and Dearman Citation2002; Scheurer et al. Citation2015; Krutz et al. Citation2020).
Based on these analyses, it is clear that protein allergens must have the potential to induce the class of immune response (T-helper [TH]-2 cell responses and type 2 innate lymphoid cells [ILC2]) (Sahiner et al. Citation2021) and T-follicular helper (Tfh) cells expressing the CXCR5 chemokine receptor) that support IgE antibody production (Kobayashi et al. Citation2017). However, it is doubtful that the expression of appropriate epitopes, although essential, is alone sufficient to endow proteins with allergenic potential (Huby et al. Citation2000; Scheurer et al. Citation2015). Other factors that have been considered to be important include resistance to proteolytic digestion, the extent and nature of glycosylation, and functional characteristics of the protein (and enzymatic activity in particular), as well as the overall inherent immunogenic potential of the protein. Also of importance is the way in which the protein is recognized and internalized by antigen-presenting dendritic cells (DC) and subsequently displayed to responsive T-lymphocytes (Huby et al. Citation2000; Bredehorst and David Citation2001).
Some or all of these factors might be inter-connected suggesting that an integrated approach to the identification of potentially allergenic proteins might be the most effective route to hazard identification (Krutz et al. Citation2020). AllerCatPro seeks to integrate what is known about the structural, sequence and epitope characteristics of protein allergens as a basis for providing a system for the identification of potential allergenic hazards (Maurer-Stroh et al. Citation2019; Nguyen et al. Citation2022). AllerCatPro 2.0 is based on the most comprehensive and reliable datasets of protein sequences (i.e., amino acid sequences of proteins) associated with allergenicity (identified here as ‘known allergens’) from the union of major databases, most of which include various degrees of manual expert curation.
Typically, single protein allergens can be identified and quantified by enzyme-linked immunosorbent assay (ELISA). However, this method relies on the availability of allergen-specific antibodies and the quantification only of specific protein allergen targets. In the studies described here, AllerCatPro 2.0 is used in tandem with label-free proteomic analyses of complex natural substances to provide a detailed assessment of identified and semi-quantified individual proteins and potential allergens within the ingredient matrix. This approach has been applied previously with a former version of AllerCatPro (v.1.7) to generate an initial robust set of proteins of low allergenic potential that can serve as negative controls in developing new approaches for the identification of protein allergens (Krutz et al. Citation2019). In total, within six abundant and commonly consumed protein sources, 178 characterized proteins were found for which there is no evidence for allergenicity, despite opportunities for human exposure.
For the purposes of the proof-of-concept investigation described here, 12 commercial preparations of source materials known to contain allergenic proteins (including foodstuffs, plant products, dust mite extract and preparations of animal dander) were used to identify source-specific protein allergens. It is important to emphasize that the purpose of these investigations was not to examine further or to validate AllerCatPro 2.0 effectiveness for identification of potentially allergenic proteins, but rather to evaluate the utility of a combined proteomic- bioinformatic approach as a basis for the safety assessment of complex mixtures of proteins.
Materials and methods
Source materials
Protein-containing preparations of source materials were purchased from Stallergenes Greer Ltd. (Lenoir, NC), as defatted, powdered, and dried lyophilized cake (freeze-dried extract). The 12 source materials are listed in and are derived as follows: Peanut and hazelnut extracts are derived from seeds (nuts), various pollen materials are derived from grass species (Johnson grass, Timothy grass), weed species (lamb’s quarters, common mugwort, short ragweed), and tree species (olive, birch), extracts of animal dander are derived from various breeds of either dogs or cats, and for the house dust mite extract, whole bodies of the house dust mite were used. All source materials were extracted at 1:20 [w/v] in 0.01 M ammonium bicarbonate or, in the case of house dust mite extract, as a bi-level extraction at 1:20 and 1:10 [w/v] in 0.01 M ammonium bicarbonate. All extracts were dialyzed against distilled water by the supplier.
Table 1. Source materials purchased from Stallergenes Greer Ltd. (Lenoir, NC), and used for proteomic and bioinformatic analyses.
Label-free proteomic analysis
Based on the Bradford values reported by the supplier (see ), sufficient material was weighed to yield 2500 μg total protein. This material was then re-constituted in 500 μl of a pH 7.55 solution of 5% sodium dodecyl sulfate (CAS# 151-21-3, Sigma, St. Louis, MO) and 50 mM triethylammonium bicarbonate (CAS# 15715-58-9, Sigma). Samples were sonicated for 30 min at ambient temperature in a Branson 3510MT Ultrasonic Cleaner (Branson Ultrasonics, Danbury, CT), then clarified by centrifugation at 18,000 x g for 10 min. A total of 50 μl of the resultant supernatant was carried forward. Samples were chemically reduced by addition of 1 μl 500 mM dithiothreitol (DTT, final concentration 10 mM; CAS# 3483-12-3, Sigma) and incubation at 56 °C for 30 min. Samples were then alkylated by addition of 2.5 μl 500 mM iodoacetamide (final concentration 25 mM; CAS# 144-48-9, Sigma) and incubated at ambient temperature for 30 min in the dark. Samples were then processed through S-trap mini devices (Protifi, Farmingdale, NY) according to manufacturer protocols. After peptide elution from the S-trap device, samples were dried to completion in a Savant SPD111V-115 SpeedVac (Thermo Fisher Scientific, Asheville, NC). Dried peptides were re-constituted in 100 μl mobile phase A (0.1% formic acid in water [CAS# 7732-18-5 & 64-18-6, Honeywell, Charlotte, NC]) prior to analyses in the LC-MS system (Waters, Milford, MA) outlined below.
The gradient was provided by a Waters ACQUITY UPLC M-Class system. The mobile phases were: (A) 0.1% formic acid in water and (B) 0.1% formic acid in acetonitrile (CAS# 64-18-6, 75-05-8, Honeywell). The flow rate was set at 300 nl/min and an EASY-Spray™ (Thermo Fisher Scientific; 75 μm x 150 mm, 3-μm particle size) HPLC column was used. The column was maintained at 35 °C using a system integrated heater. The LC gradient proceeded from 0% (B) to 40% (B) over 90 min, followed by a wash at 80% (B) and re-equilibration for a total run length of 120 min.
The in-line QExactive HF mass spectrometer (Thermo Fisher Scientific) was operated in positive ion mode. Full MS scans were collected from 495-900 m/z at a resolution of 60,000, with an Automatic gain control (AGC) target of 3e6. Up to 12 data dependent MS2 (fragmenta-tion and detection of reporter ion relative intensities) scans were collected per MS1 (peptide ions are detected as intact analytes) scan, at a resolution of 15,000 and an AGC target of 1e5. For data-dependent scan settings, Apex trigger was enabled from 5-45 sec and Dynamic exclusion was enabled for 15 sec.
To identify the peptides and proteins, the spectra were searched against the appropriate protein database. For this purpose, protein databases for the various source materials were downloaded from UniProtKB (UniProt Protein Knowledgebase; http://www.uniprot.org/). When available, a defined ‘proteome’ (according to UniProt curation) was used (see ). Other-wise, all sequences were used from the closest taxonomic rank (species, genus, subtribe, tribe, subfamily, or family), in which the total sequences in UniProt numbered between 10,000 and 100,000. This range was chosen because it is the approximate protein count of well-characterized proteomes. Protein databases were clustered at 90% identity using the UniRef approach (Suzek et al. Citation2015) to reduce redundant entries. Common contaminant protein sequences were appended from the common Repository of Adventitious Proteins (cRAP; Craig et al. Citation2004) Common contaminant protein sequences such as e.g. ‘sp|K2C1_HUMAN|’ that are not part of the analyzed source were excluded from the percentile (relative abundance) calculations for the according material. A false-positive rate of protein identifications was estimated with false (decoy) sequences using pseudo-randomization with the decoyFastaGenerator functionality of the Trans-Proteomic Pipeline (TPP), an open-source (https://sourceforge.net/projects/sashimi/) proteomic MS/MS analysis platform (v. 5.1.0 ‘SYZYGY’, Build 201711031215-7670). Spectra were searched against the appropriate database using the Comet search engine. Resulting peptide-spectrum matches were refined and scored using the TPP to yield peptide and inferred protein identifications.
Quantification was performed on proteins identified at < 1% false-positive rate using the StPeter module of the TPP (Hoopmann et al. Citation2018) and is given as the sum of fragment ion intensities (distributed normalized spectral index, dSIN) for all spectra counted for a protein and normalized by the protein length and the total signal for a given LC-MS/MS run (Sardiu and Washburn Citation2010).
Bioinformatic analysis
Identified proteins were analyzed for their predicted allergenic potential using AllerCatPro 2.0 (Nguyen et al. Citation2022; https://allercatpro.bii.a-star.edu.sg/). In brief, protein sequences in FASTA format are first screened for their similarity to Gluten-like proteins, then for their similarity on a 3-D structure level against a 3-D structure database and finally for similarity on the protein sequence level. The 3-D structure database consists of 714 templates covering the majority of protein allergens. For the analysis of similarity on the protein sequence level, AllerCatPro 2.0 comprises the most complete dataset with 4,979 protein allergens, 162 low allergenic proteins, and 165 human proteins associated with autoimmune diseases. The datasets are derived from the major databases FARRP (Food Allergy Research and Resource Program), COMPARE (Comprehensive Protein Allergen Resource), WHO/IUIS (World Health Organization/International Union of Immunological Societies), UniProtKB, and Allergome. The output of AllerCatPro 2.0 provides information on potential cross-reactivity toward other protein allergens, protein information (UniProt/NCBI) and functionality (Pfam, InterPro, SUPFAM), as well as the clinical relevance, which refers to IgE prevalence data (reflected as total number of individuals that have been tested for specific IgE toward the protein allergen in published epidemiology studies that are listed in Allergome) and allergen information (reflects the current characterization status of the protein allergen based on availability of experimental data showing positive responses) related to the identified most similar protein allergen (reviewed in Krutz et al. [Citation2023]).
A protein is predicted with ‘strong evidence’ or ‘weak evidence’ for allergenicity if its 3-D structure and/or sequence is significantly similar to a protein within the AllerCatPro 2.0 dataset. The output gives a ‘predicted most similar allergen’ along with the according species name. This best hit protein represents a simplified allergen name (e.g. ‘Fel d 1’ instead of ‘Fel d 1.0101’). In addition, the column ‘potential cross-reactivity of query protein’ shows the number of protein sequences within the AllerCatPro 2.0 data set that are found to be significantly similar to the query protein (E-value [Expect value] of protein-protein Basic Local Alignment Search Tool (BLASTP) search < 0.001). The number is a link to a new tab with the list of all protein sequences, IgE prevalence data, the percent identity, and the BLAST E-value. The E-value indicates the probability due to chance and thus, the closer the value is to zero, the more significant (but not random) is the similarity toward the query protein sequence. Sequences are ranked from lowest to highest E-value, and thus by significance.
Proteins are predicted with ‘no evidence’ for allergenic potential if the protein sequence does not trigger a hit for similarity to known allergens on a 3-D structure level and on a sequence level above 35% sequence identity to known allergens within the 80-amino acid window as well as a sequence identity of at least three short hexamers with known allergens (3 × 6-mer sequence identity rule). The similarity to Gluten-like proteins is shown as a comment separately in addition to the sequence similarity comment to provide further information, whether the result is based on sequence similarity and/or Gluten-like prediction. In addition, any similarity to ‘autoimmune allergens’ is excluded from the ‘predicted most similar allergen’ column but shown in a separate column, same as the similarity to low allergenic proteins. The percent identity values to either ‘autoimmune allergens’ or low allergenic proteins also function as a link to a separate tab that shows the list and percent identity to human proteins, similarly to the ‘potential cross-reactivity of query protein’ table.
Results
Occurrence and abundance of protein sequences with allergenic potential
In total, 4,586 protein sequences (or UniProtIDs) were identified with label-free proteomic analyses of the 12 source materials, ranging between total numbers of 42 for olive tree pollen extract and 594 for peanut (). The detailed overview of all identified and semi-quantified protein sequences, their AllerCatPro 2.0 prediction output (Supplement 1) as well as a summary of findings (Supplement 2) for all 12 materials can be found in the supplements. The majority of all protein sequences are found at a relative abundance below 1%. Per material, not more than 23 sequences are found with relative abundances at or above 1%: 11 sequences in olive and birch pollen, and up to 23 sequences in lamb’s quarters. The highest relative abundances of a single protein sequence range from 35.1% in olive tree pollen to 7.2% in mugwort pollen (Supplement 1 - ).
Figure 1. Overview of proteomic and bioinformatic results for 12 source materials. Shown are the number (A) and sum of the relative abundances* (B) of all identified and semi-quantified protein sequences (n = 4,586) with AllerCatPro 2.0 predictions for strong, weak and no evidence for allergenicity. *total mass related to the total protein content of the material.
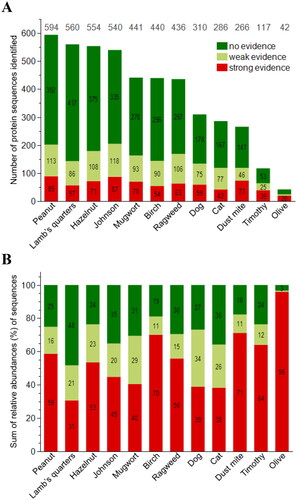
Figure 2. Relative abundance [%] of top 25 proteins identified and semi-quantified in 12 materials by proteomic analysis, their predicted ‘best hit protein name’ and prediction for strong, weak or no evidence for allergenicity using AllerCatPro 2.0.
![Figure 2. Relative abundance [%] of top 25 proteins identified and semi-quantified in 12 materials by proteomic analysis, their predicted ‘best hit protein name’ and prediction for strong, weak or no evidence for allergenicity using AllerCatPro 2.0.](/cms/asset/aae91abf-951d-42da-bd38-d0de0ef8f0e1/iimt_a_2305452_f0002_c.jpg)
Of all identified protein sequences, 1,665 protein sequences are predicted with weak (n = 941) or strong (n = 724) evidence for allergenicity. They thus are found to be similar to at least one protein allergen within the AllerCatPro 2.0 dataset. Among all 12 source materials, the lowest number of potentially allergenic protein sequences with weak or strong evidence for allergenicity are found in olive tree pollen (24 of 42 sequences) and the highest number in Johnson grass (205 of 540 sequences) and peanut (202 of 594 sequences). The relative abundance of identified protein sequences predicted with weak or strong evidence for allergenicity ranges between 52% in lamb’s quarters pollen and 97% in olive tree pollen, followed by 82% in house dust mite and 81% in birch pollen ().
Identified and semi-quantified source-specific allergens
shows the top 25 predicted protein allergens and identified UniProtIDs (in case no similarity to a protein allergen was predicted), respectively, per analyzed source material. If multiple protein sequences (UniProt ID) within a source material were predicted with an identical predicted protein allergen, then the sum of the relative abundances of the according UniProtIDs are depicted in accordance with the protein allergen name. For example, UniProtIDs B5TYU1, A0A444YLI2, A0A2R9ZPY0, and Q647H2 are predicted as the peanut allergen Ara h 3, a trimeric 11S globulin belonging to the family of RmlC-like cupins (SSF51182). However, different protein sequences can result in different prediction results and thus a mix of weak and strong evidence for allergenicity, such as for Sor h 2 in Johnson grass (). All UniProtIDs, protein sequences and prediction results can be reviewed in Supplement 1.
Among all 12 source materials, the most abundant predicted protein allergens are identified with a relative abundance from 7.2% (Amb a CPI) in mugwort to 35.1% (Ole e 1) in olive pollen (). Interestingly, several protein sequences were found in many different materials and predicted as allergens such as Zea m 20S (31 sequences, found in seven out of 12 materials) and Alt a 4 homolog (29 sequences, found in ten out of 12 materials). Some proteins were predicted to be highly similar to low allergenic proteins, e.g. a histone protein (P59259) in lamb’s quarters. The top 25 proteins start with the lowest relative abundance levels between 0.1% in olive pollen to 1.1% in lamb’s quarters. The sum of all relative abundances of all predicted protein allergens of the top 25 proteins is on average 76% (ranging between 57.6% in lamb’s quarters to 99.2% in olive pollen).
Within the top 25 proteins, well known source-specific allergens (e.g. Cor a 9 found at 23% in hazelnut material) were identified as well as allergens from other species (e.g. Bet v 7, a birch pollen allergen at 4.2% and Jug n 4, an allergen in walnut at 1.5%; both found in hazelnut material). While a great number (2,921) of the protein sequences are predicted with no evidence for allergenicity, and thus not significantly similar to any (non-human) allergen within the AllerCatPro 2.0 dataset, only a very few of those protein sequences annotated with their UniProtID derived from the proteomic results were found within the top 25 most abundant proteins (e.g. A0A337SBR4 at 13.7% in cat dander; see ). Among the protein 2,921 sequences predicted with no evidence for allergenicity, 471 identified protein sequences showed sequence similarity to low allergenic proteins and 77 protein sequences showed similarity to autoimmune allergens such as Hom s alpha_Actin (P62736), which was found to have 94% sequence identity to the query protein P60709 in cat and dog dander.
In order to present all identified source-specific allergens per source material, allergens are listed with their relative abundance and predicted evidence for allergenicity in . AllerCatPro 2.0 also provides further information, such as the protein functionality (SUPFAM) and the number of individuals tested for IgE reactivity derived from Allergome, which is annotated to Supplement 2 as an extended version of . For the hazelnut material, which was derived from Corylus americana, Corylus avellana was selected as closest surrogate to depict identified source-specific allergens, mugwort (Artemisia vulgaris) allergens were extended with other Artemisia species (A. annua, A. vulgaris, A. capillaris, A. gmelinii, A. sieversiana) and ragweed (Ambrosia artemisiifolia) and Ambrosia trifida allergens and vice versa. Source specific allergens for house dust mite allergens are shown as Dermatophagoides farinae in addition to Dermatophagoides pteronyssinus allergens.
Table 2. Identified species-specific allergens (n = 129) in 12 analyzed source materials, their relative abundance, and predicted evidence for allergenicity using AllerCatPro 2.0.
In total 129 source specific allergens were identified in the 12 source materials combined (). Many well-known allergens were found at significant levels in the analyzed source materials. The total relative abundance of those identified source-specific allergens ranges between 0.8% (lamb’s quarters) to 63% (olive pollen). Some protein allergens were identified with weak evidence only e.g. Der f 13 in house dust mite extract and Amb a CPI, Amb a 11, and Amb a 3 in mugwort pollen. However, in all cases, the allergen species is a related, but different one compared to the tested source material. For all other source-specific allergens, at least one of the identified and semi-quantified UniProtID (which might reflect only a fragment or a chain of the protein complex) was predicted with strong evidence for allergenicity. For example, four UniProtIDs (A0A2R9ZPY0, A0A444YLI2, B5TYU1, Q647H2) were found to have similarity to Ara h 3, a RmlC-like cupin, all of them were predicted with strong evidence for allergenicity. Four UniProtIDs (A0A1Z5RKZ4, A0A1Z5S9E5, C5YR92, C5YR98) were found to have similarities to Sor h 2, a pollen allergen. However, two (A0A1Z5RKZ4, C5YR98) out of four were predicted with weak evidence for allergenicity.
Identified and semi-quantified allergens in peanut material
Taking peanut as an example, the data show that of 594 identified protein sequences, 113 were predicted to have weak evidence and 89 with strong evidence for allergenicity () and thus significant similarity to at least one protein allergen within the AllerCatPro 2.0 data set. These 202 protein sequences with evidence for allergenicity account for 75% of the total mass of the protein content of the material (). As shown in and Supplement 2, the sum of the relative abundance of the total 15 identified source-specific allergens (Ara h 3, Ara h 1, Ara h 6, etc.) comprise almost 50% of the total protein content. The most abundant identified peanut-specific allergens Ara h 3 (20.3%; 11S globulin) and Ara h 1 (14.8%; 7S globulin) belong to the protein superfamily of cupins (PF00190), Ara h 6 (5.2%), Ara h 2 (4.1%), Ara h 7 (0.3%), Ara h 17 (0.1%), and Ara h 9 (0.1%) belong to plant lipid transfer proteins (PF00234), Ara h 8 (1.4%) to the pathogenesis-related (PR-10) protein family, Ara h Agglutinin (1.3%) to lectins (PF00139), and Ara h 18 (1.2%) to cyclophilins (PF00160). All other peanut allergens at or below 0.5% belong to the scorpion toxin-like (SSF57095) protein family (Ara h 12, Ara h 13) and oleosins (PF01277; Ara h 10, Ara h 11, Ara h 14). Interestingly, the cyclophilin Ara h 18, is not only found in peanut source material (1.2%), but also identified with strong or weak evidence in pollen extracts from ragweed (5.2%), Johnson (2.3%) and Timothy (0.02%) grass, mugwort (0.5%), and lamb’s quarters (0.3%). For some of the source-specific allergens (Ara h 3, Ara h 1, Ara h 6, Ara h 2, Ara h 8, Ara h 7, Ara h 9), AllerCatPro 2.0 provides a number of individuals tested for IgE (). In the AllerCatPro 2.0 output, this number functions as a link to the according Allergome website that contains the list of published epidemiology studies to evaluate IgE prevalence (see Supplement 1).
Excluding peanut-specific allergens, other identified protein sequences in peanut predicted with strong or weak evidence for allergenicity comprise 25.4% of the total mass. Remarkably, weak and strong similarities to soy (Glycine max) allergens (Gly m 6, Gly m Bd 28K, Gly m 7) are found among proteins with significant relative abundance levels between 1% to 3.6% (). An input protein identified using proteomic analysis (UniProtID A0A445CPP8) and found at 1.4% relative abundance is predicted to be significantly similar to the walnut allergen Jug n 4. The similarity is based on 67.5% linear 80 aa window identity and 88.2% identity based on 3-D structure. Jug n 4 belongs to the same cupin superfamily (PF00190) and has been identified as an 11S globulin with a protease recognition site that is similar to Pru du 6 (almond), Cor a 9 (hazelnut), Ana o 2 (cashew) as well as Ara h 3 (Zhang et al. Citation2017).
To better understand the sequence similarity of a specific protein sequence to other allergens from different species, AllerCatPro 2.0 provides a number and a list of BLASTP-hits of the protein of interest against the AllerCatPro 2.0 database of proteins associated with allergenicity in the ‘potential cross-reactivity of query protein (# and links)’ column. For Jug n 4, the list shows significant similarity to 90 protein sequences in the AllerCatPro 2.0 database (see Supplement 3); the majority of the sequences are annotated to belong to the cupin protein family (PF00190) and with a high number of individuals tested for IgE. The list of 90 protein sequences ranked from the lowest, most significant E-value, to the highest and includes allergens from e.g. hazelnut (Cor a 9), pecan (Car i 4), English walnut (Jug r 4), kiwifruit (11S globulin), sesame (Ses i 7), Brazil nut (Ber e 2), cashew (Ana o 2), pistachio (Pis v 5, Pis v 2), pumpkin (Cuc ma 4), almond (Pru d 6), soy (Gly m 6) as well as 16 different UniProtIDs related to Ara h 3 from peanut.
Other relatively-abundant proteins in peanut source material are predicted with strong or weak similarity to allergens from chicken (Gal d 10), chickpea (Cic a 1), hazelnut (Cor a 11), chestnut (Cas s 9), wheat (Tri a 27, Tri a 31), etc. (see Supplement 1). Taken together, the peanut material covers a broad range of 15 source-specific peanut allergens that are present at different levels, but comprising almost 50% of the total protein content of the material (), 7 of the source-specific allergens are within the top 25 identified most abundant proteins ().
Identified and semi-quantified allergens in house dust mite material
The total number of protein sequences identified in the house dust mite (Dermatophagoides pteronyssinus) extract was 266 (), of which 119 were predicted to have weak (46) or strong (73) evidence for allergenicity using AllerCatPro 2.0. These account for 82% of the total mass of the protein content of the material, and thus, the house dust mite material comprised much of the total mass of the protein content.
The identified proteins that are predicted as allergens in house dust mites are represented as the American (Dermatophagoides farina) and European house dust mite (D. pteronyssinus). The most abundant identified house dust mite-specific allergens within the top 25 of all identified proteins are Der p 30 (16.8%), Der p 5 (7.4%), Der p 7 (5%), Der p 14 (4%), Der p 2 (3.7%), Der f 27 (2.7%), Der p 1 (2%), Der p 25 (1.3%), as well as the allergens Der p 8, Der f 34, Der p 13, and Der p 21, which were found at or below 1% relative abundance (, Supplement 2). All identified house dust mite-specific allergens from either the European (D. pteronyssinus) or American (D. farinae) house dust mites comprise 52% of the total protein content (, Supplement 2). Remarkably, these protein families also account for the highest number of individuals tested for IgE reactivity (e.g. 21,941 tested for Der p 2), which may indicate the clinical relevance of these allergens to diagnose house dust mite allergy.
The identified protein families with the highest relative abundances are ferritin (Der p 30), E set domains (SSF81296) with 5% relative abundance (Der p 2, Der f 35 and Der f 22), followed by the protein family lipovitellin-phosvitin complex (SSF48431) with 4% relative abundance (Der p 14 and Der f 14), serpins (SSF56574) with 3% (Der f 27) and cysteine proteinases (SSF54001) with 2% relative abundance (Der p 1 and Der p 38).
Besides house dust mite-specific allergens, allergens from other species were identified, some at a comparable relative abundance level as Der p 1. Among the top 25 most abundant protein allergens are among others the tropomyosin Pso o 10 from sheep scab mite (9.1%), the mold mite allergens Tyr p 13 (lipocalin, 3.4%) and Tyr p 28 (actin-like, 1.6%), the parasite cysteine proteinase allergen Sch ma Sm31 (2.2%), and the cockroach NAD(P)-binding allergen Per a 13 (2.1%).
Taken together, the house dust mite material covers a broad range of 37 European and American house dust mite specific allergens that are present at different levels comprising 52% of the total protein content of the material, 12 of the source-specific allergens are within the top 25 identified most abundant proteins.
Discussion
Allergenic proteins induce sensitization through the elaboration of IgE antibody responses, and a key objective in safety assessment is to distinguish such proteins from those that, although potentially immunogenic in foreign species, fail to stimulate IgE antibody production and induce allergic sensitization. There continues to be considerable interest in, and a need for, the development of approaches for the accurate identification of proteins with allergenic properties (Krutz et al. Citation2020, Citation2023). The objective described here was to develop and evaluate the utility of a novel approach for this purpose based on proteomics in tandem with bioinformatics. A specific aim was creation of a robust method for the holistic evaluation of allergenic hazards that might be associated with complex mixtures of plant, insect, or animal proteins.
The results describe the analysis of 12 source materials with detailed information on the identification and semi-quantification of a substantial number of allergens specifically associated with different sources, as well as proteins showing significant similarity to allergens characterized in other organisms. AllerCatPro 2.0, a new version of a previously described web application AllerCatPro 1.7 (Maurer-Stroh et al. Citation2019) was used to predict allergenicity. It has a similar workflow to AllerCatPro 1.7 and achieves an overall accuracy of 84.7% with 100% sensitivity and 68.9% specificity (Nguyen et al. Citation2022). In this context, it is important to reiterate that the aim of these investigations was to explore whether a combined proteomic-bioinformatic approach can provide a reliable basis for assessing potential allergenic hazards in complex mixtures of proteins in the context of safety assessment. The intention was not to formally assess the safety profile of the materials examined. Neither was the aim a formal evaluation of the performance of AllerCatPro 2.0, which has been described elsewhere (Maurer-Stroh et al. Citation2019; Nguyen et al. Citation2022).
Studies here have previously used the same approach of combining proteomics and AllerCatPro to identify proteins with low allergenic potential and have discussed the advantages and limitations of this approach elsewhere (Krutz et al. Citation2019). Furthermore, proteomics combined with in silico tools is gaining increasing popularity for the identification of new potential allergens, and specific allergens in complex materials. For certain well-characterized materials, especially peanut, the levels of major allergens have been investigated by proteomics (Johnson et al. Citation2016), as well as with analytical SDS-PAGE (sodium dodecyl-sulfate polyacrylamide gel electrophoresis; Koppelman et al. Citation2001), and ELISA (enzyme-linked immunosorbent assay; Schocker et al. Citation2017). Of these, ELISA is the most commonly used method for quantitative analysis of single protein allergens, but it relies on availability of allergen-specific antibodies and allows quantification of specific protein allergen targets only. Alternatively, proteins in complex materials can be identified and semi-quantified for protein safety assessments using label-free proteomic analysis in tandem with bioinformatics.
A first-tier approach of using the AllerCatPro 2.0 prediction output with ‘strong evidence’ or ‘weak evidence’ for allergenicity in the context of the identified protein sequences and their relative abundances provides top-level information about the occurrence of potential allergenic protein sequences in complex mixtures. As described here, of 4,586 identified and semi-quantified protein sequences, 1,665 were predicted to have weak or strong evidence for allergenicity in the 12 source materials combined. Among these 1,665 protein sequences, 129 species-specific allergens were identified with a total relative abundance ranging from 0.8% (lamb’s quarters) to 63% (olive pollen). Furthermore, among the 1,665 protein sequences, many proteins with similarities to allergens characterized in other organisms were identified.
Despite the considerable amount of data generated, there are limitations to this proteomic-bioinformatic approach. Proteomic analysis provides relative quantification of proteins based on the ionic intensity of their detected peptides. The range of protein abundance levels that can be accurately measured is influenced by various factors such as the sensitivity of the mass spectrometer and the complexity of the sample. Like most analytical approaches, mass spectrometry can more readily detect high abundance analytes and may have limitations in accurately measuring low abundance proteins.
For example, the number of identified proteins and allergens can be surprisingly low if the proteome of the material of interest is not well characterized, as is the case with olive. Based on the proteome of the Oleaceae, which according to UniProt includes 1,476 protein sequences, only 42 protein sequences were identified in the here studied olive pollen material. While olive oil has only a small proteome of 40 sequences (Castro et al. Citation2020), a study on olive pollen grains identified 1,907 proteins by LC-MS/MS (San Segundo-Acosta et al. Citation2019). The characterization of the proteome of the olive tree remains challenging, mainly due to the limited genome resources, and the considerable difficulty in achieving protein extraction from olive material (Wang et al. Citation2010). Such small proteome size can impact the total number of identified protein sequences and therefore can shift relative abundances of the major proteins to a higher number versus a material with many hundred identified protein sequences.
Consistent with this, the number and relative abundance of identified allergens can vary between source materials depending on the representation of protein sequences belonging to a protein (different chains, fragments, etc.). It should be noted that one single UniProtID does not necessarily represent one complete allergen, but only one component (e.g. chain, fragment) of it. In addition, not all chains or fragments that belong to one complex protein allergen are fully represented in AllerCatPro 2.0. Thus, some of these chains and fragments may not necessarily be predicted with strong evidence for allergenicity. With the exception of Der f 13 in house dust mite, at least one UniProtID of all other 121 identified species-specific allergens were predicted with strong evidence for allergenicity (). It is important, therefore, to consider individual UniProtIDs in the context of the protein complex they belong to. Here, the protein allergen name given by AllerCatPro 2.0 was used to summarize relative abundances of multiple UniProtIDs.
For house dust mite and peanut, a significant number of species-specific allergens was found in the source materials. For peanut, the most abundant species-specific allergens represent allergens that are commonly tested for IgE reactivity For example, for Ara h 3 and Ara h 1 (the most abundant proteins found in the source material) there are published IgE reactivity data for 2989 and 3405 individuals, respectively, available from epidemiology studies in Allergome (www.allergome.org, the link to the results is provided in AllerCatPro 2.0 output, see Supplement 1). For Ara h 6 (with a 4-fold lower abundance) there are published data for 618 tested individuals. However, IgE prevalence rates for specific allergens in peanut allergic subjects (positive skin prick test and specific serum IgE antibody) vary greatly depending on the cohort group analyzed. Due to the difficulty in estimating overall IgE prevalence rates, the number of tested individuals can function as an indicator for the likelihood of an allergen being a clinically relevant and frequently suspected allergen (Krutz et al. Citation2023).
Nevertheless, not all allergens can (yet) be identified using this proteomic-bioinformatic approach. For example, technical challenges with the protein extraction from the source material, the influence of the extraction buffer on the protein composition, as well as the presence of very short (less than 20 amino acids) protein sequences may determine whether a protein is detectable or not. Finally, the source-specific allergen may simply not be present in the specific parts of the plant that were used for the preparation of the source material.
A great advantage of using AllerCatPro 2.0 in tandem with proteomics is the identification of potential allergens that are not specific to the source material. Information on such proteins can be of value for identifying currently uncharacterized allergens in the source material or phylogenetically related counterparts to a known (and thus potentially cross-reactive) allergen in a different species with the same or similar protein function. For example, in the cat and dog dander source material, protein sequences with similarities (weak evidence for allergenicity) to the horse allergen Equ c 4 were identified. This latherin-like, bactericidal permeability-increasing protein function is also present in dogs and cats. The Equ c 4-identified protein could represent either a particular contamination with horse source material or a protein in cats and dogs that is very similar in sequence to the horse allergen Equ c 4 and, therefore, potentially cross-reactive or a latherin-like protein that fails to stimulate IgE production and induce allergic sensitization when it is derived from cats or dogs, but not from horses. The clinical relevance of potential cross-reactivities as well as the potential lack of the latherin-like protein in cats and dogs to stimulate IgE production and sensitization, remains to be explored.
Another example is the predicted walnut allergen Jug n 4 identified in the here analyzed peanut material. This identified protein sequence (A0A445CPP8) may be part of the RmlC-like cupin peanut allergens Ara h 1 or Ara h 3, but AllerCatPro predicted Jug n 4 has the most similar protein allergen. IgE cross-reactivity of peanut-sensitized individuals to walnut (Maleki et al. Citation2011) and soy (Cabanillas et al. Citation2018) has been found to relate to sequence homology of certain protein families, including RmlC-like cupin-like 11S globulins (Kim et al. Citation2016). The clinical relevance of this IgE cross-reactivity is difficult to proof, as other unique allergens other than the cross-reacting antibodies, may contribute to allergic reactions, as shown for soy (Eigenmann et al. Citation1996).
AllerCatPro 2.0 applies conservative cutoff values for protein similarities, and as such, evolutionary preserved proteins are predicted with weak evidence for allergenicity in many different analyzed materials. For example, the allergen Art v 5, a calcium-binding protein in mugwort, was found in 10 out of 12 materials at relative abundances up to 2%. It is predicted to belong to the EF hand protein family, which represents an evolutionary conserved structural motif of two α-helices (E and F) that are involved in calcium binding. Another example is the predicted allergen Ole e 5, which was found at 8% relative abundance in olive, but also birch tree pollen as well as in seven other materials. Ole e 5 is predicted to belong to the widely distributed and evolutionary conserved superoxide-dismutase protein family. Such proteins may be very similar to proteins within the source material and identified due to the nature of proteomic identification (based on peptide sequences) and/or less well characterized protein sequences within the source material (data gaps in proteome information). It is also possible that such proteins were introduced via contamination during sample processing, but one would also expect other proteins.
In addition to potential allergens, in each of the 12 analyzed materials, at least two abundant proteins (within the top 25) were predicted with no evidence for allergenicity, and thus no significant similarity to any of the 4,979 allergenic protein sequences in AllerCatPro 2.0. Proteins with a high relative abundance and no evidence for allergenicity were found in cat (A0A337SBR4 at 13.7%) and dog (E2R0H6 at 6.6%) dander, house dust mite extract (A0A1Y3AZM9 at 3.3%), etc. (). Such proteins could be considered of lower allergenic concern. They may be potential candidates for use in the calibration of tests that seek to discriminate between proteins of different allergenic potential (Krutz et al. Citation2019).
A standardized approach is needed to identify and semi-quantify allergens for the safety assessment of botanicals and natural substances. The studies presented here have demonstrated that a combined proteomic-bioinformatic approach can be used to identify and semi-quantify species-specific allergens in complex mixtures, as well as proteins with potential cross-reactivity based on their similarity to other related source materials.
The data presented here, particularly those pertaining to the well-characterized source materials from peanut and house dust mite, reveal the level of detailed information that can be generated using proteomic analysis aligned with AllerCatPro 2.0. Such a holistic evaluation of protein allergens in complex materials provides an alternative to commonly used ELISA methods that rely on allergen-specific antibody recognition toward very specific targets. The holistic evaluation is based on the assumption that a broad range of environmental protein allergens have already been identified and characterized. The number of completely new environmental protein sequences of allergenic concern continues to grow with new clinical data being generated and reviewed by WHO/IUIS (Sudharson et al. Citation2021). The newly updated dataset of 4,979 protein sequences on which AllerCatPro 2.0 is founded is substantial and reflects the recently identified IUIS recognized allergens.
Nevertheless, the prediction tool is strongly dependent upon the quality of its database and requires a continuing investment to maintain and extend its accuracy and coverage. The data contained within this paper have been generated exclusively with AllerCatPro 2.0. Clearly, there is the intention to extend the scope of this model and to refine further its performance. It is possible, therefore that, in the future, there might be some changes to the data if the same experiments were repeated exactly with a new version of AllerCatPro. However, it must be emphasized that the objective of the studies described here was to develop a paradigm linking AllerCatPro with proteomics for the purposes of evaluating the allergenic potential of complex mixtures of proteins. The results reported here demonstrate that such an approach is viable and effective - and there is no reason to believe that this would be any less viable and effective (and possibly even improved) with subsequent refinements of AllerCatPro. The principle will remain the same and provide a suitable means of hazard evaluation of complex mixtures.
It is proposed here that the approach using proteomic analysis aligned with AllerCatPro 2.0 as described here has the potential to provide a level of detailed information on the presence and relative abundance of allergens and therefore an improved understanding of allergen exposure. Taken together with previously-published understanding of proteins of low allergenic potential, this approach has a potential to play an important role in identifying potential allergenic hazards in complex protein mixtures for the purposes of safety assessments.
Supplemental Material
Download MS Excel (4.6 MB)Acknowledgements
The authors gratefully acknowledge valuable discussions with reviewers at Procter & Gamble. Minh N. Nguyen would like to thank A*STAR Joint Council Office (JCO) Career Development Award/Fund (222D800029) and HBMS Domain Industry Alignment Fund Pre-Positioning (IAF-PP), A*STAR (H2001a0P14) for funding. Vachiranee Limviphuvadh would like to thank the National Research Foundation, Singapore and A*STAR under the Singapore Food Story R&D Programme (W22W3D0003) and Industry Alignment Fund BMRC, A*STAR/P&G (APG2013/096) for funding.
Disclosure statement
Authors GFG and IK received financial compensation from P&G for their time spent in the preparation of this publication. This article was prepared during the normal course of the authors’ affiliations or employment shown on the first page of the paper. The authors declare that the research was conducted in the absence of any commercial or financial relationships that could be construed as a potential conflict of interest. None of these authors has participated in legal or regulatory proceedings on the subject of this paper during the last 5 years.
The authors have sole responsibility for the preparation and content of this manuscript.
Additional information
Funding
References
- Bredehorst R, David K. 2001. What establishes a protein as an allergen? J Chromatogr B Biomed Sci Appl. 756(1–2):33–40. doi:10.1016/s0378-4347(01)00069-x.
- Cabanillas B, Jappe U, Novak N. 2018. Allergy to peanut, soybean, and other legumes: recent advances in allergen characterization, stability to processing and IgE cross-reactivity. Mol Nutr Food Res. 62(1):1700446. doi:10.1002/mnfr.201700446.
- Castro AJ, Lima-Cabello E, Alché JDD. 2020. Identification of seed storage proteins as the major constituents of the extra virgin olive oil proteome. Food Chem X. 7:100099. doi:10.1016/j.fochx.2020.100099.
- Craig R, Cortens J, Beavis R. 2004. Open source system for analyzing, validating, and storing protein identification data. J Proteome Res. 3(6):1234–1242. doi:10.1021/pr049882h.
- Eigenmann P, Burks A, Bannon G, Sampson H. 1996. Identification of unique peanut and soy allergens in sera adsorbed with cross-reacting antibodies. J Allergy Clin Immunol. 98(5):969–978. doi:10.1016/s0091-6749(96)80014-5.
- Hoopmann M, Winget J, Mendoza L, Moritz R. 2018. StPeter: seamless label-free quanti-fication with the trans-proteomic pipeline. J Proteome Res. 17(3):1314–1320. doi:10.1021/acs.jproteome.7b00786.
- Huby R, Dearman R, Kimber I. 2000. Why are some proteins allergens? Toxicol Sci. 55(2):235–246. doi:10.1093/toxsci/55.2.235.
- Johnson P, Sayers R, Gethings L, Balasundaram A, Marsh J, Langridge J, Mills E. 2016. Quantitative proteomic profiling of peanut allergens in food ingredients used for oral food challenges. Anal Chem. 88(11):5689–5695. doi:10.1021/acs.analchem.5b04466.
- Kim M, Lee K, Hong J, Kim K, Kim K, Sohn M, Park J. 2016. IgE cross-reactivity of peanut with walnut and soybean in children with food allergy. Allergol Immunopathol (Madr). 44(6):524–530. doi:10.1016/j.aller.2016.04.012.
- Kimber I, Dearman R. 2002. Factors affecting the development of food allergy. Proc Nutr Soc. 61(4):435–439. doi:10.1079/pns2002184.
- Kobayashi T, Iijima K, Dent AL, Kita H. 2017. Follicular helper T cells mediate IgE antibody response to airborne allergens. J Allergy Clin Immunol. 139(1):300–313 e307. doi:10.1016/j.jaci.2016.04.021.
- Koppelman S, Vlooswijk R, Knippels L, Hessing M, Knol E, van Reijsen F, Bruijnzeel-Koomen C. 2001. Quantification of major peanut allergens Ara h 1 and Ara h 2 in the peanut varieties Runner, Spanish, Virginia, and Valencia, bred in different parts of the world. Allergy. 56(2):132–137. doi:10.1034/j.1398-9995.2001.056002132.x.
- Krutz N, Kimber I, Maurer-Stroh S, Gerberick G. 2020. Determination of the relative allergenic potency of proteins: hurdles and opportunities. Crit Rev Toxicol. 50(6):521–530. doi:10.1080/10408444.2020.1793895.
- Krutz N, Kimber I, Winget J, Nguyen M, Limviphuvadh V, Maurer-Stroh S, Mahony C, Gerberick G. 2023. Application of AllerCatPro 2.0 for protein safety assessments of consumer products. Front Allergy. 4:1209495. doi:10.3389/falgy.2023.1209495.
- Krutz N, Winget J, Ryan C, Wimalasena R, Maurer-Stroh S, Dearman R, Kimber I, Gerberick G. 2019. Proteomic and bioinformatic analyses for the identification of proteins with low allergenic potential for hazard assessment. Toxicol Sci. 170(1):210–222. doi:10.1093/toxsci/kfz078.
- Maleki S, Teuber S, Cheng H, Chen D, Comstock S, Ruan S, Schein C. 2011. Computa-tionally-predicted IgE epitopes of walnut allergens contribute to cross-reactivity with peanuts. Allergy. 66(12):1522–1529. doi:10.1111/j.1398-9995.2011.02692.x.
- Maurer-Stroh S, Krutz N, Kern P, Gunalan V, Nguyen M, Limviphuvadh V, Eisenhaber F, Gerberick G. 2019. AllerCatPro-prediction of protein allergenicity potential from the protein sequence. Bioinformatics. 35(17):3020–3027. doi:10.1093/bioinformatics/btz029.
- Nguyen M, Krutz N, Limviphuvadh V, Lopata A, Gerberick G, Maurer-Stroh S. 2022. AllerCatPro 2.0: a web server for predicting protein allergenicity potential. Nucleic Acids Res. 50(W1):W36–W43. doi:10.1093/nar/gkac446.
- Sahiner UM, Layhadi JA, Golebski K, István Komlósi Z, Peng Y, Sekerel B, Durham SR, Brough H, Morita H, Akdis M, et al. 2021. Innate lymphoid cells: the missing part of a puzzle in food allergy. Allergy. 76(7):2002–2016. doi:10.1111/all.14776.
- San Segundo-Acosta P, Oeo-Santos C, Benedé S, de Los Ríos V, Navas A, Ruiz-Leon B, Moreno C, Pastor-Vargas C, Jurado A, Villalba M, et al. 2019. Delineation of the olive pollen proteome and its allergenome unmasks cyclophilin as a relevant cross-reactive allergen. J Proteome Res. 18(8):3052–3066. doi:10.1021/acs.jproteome.9b00167.
- Sardiu M, Washburn M. 2010. Enriching quantitative proteomics with SI(N). Nat Biotechnol. 28(1):40–42. doi:10.1038/nbt0110-40.
- Scheurer S, Toda M, Vieths S. 2015. What makes an allergen? Clin Exp Allergy. 45(7):1150–1161. doi:10.1111/cea.12571.
- Schocker F, Scharf A, Kull S, Jappe U. 2017. Detection of the peanut allergens Ara h 2 and Ara h 6 in human breast milk: development of two sensitive and specific Sandwich ELISA assays. Int Arch Allergy Immunol. 174(1):17–25. doi:10.1159/000479388.
- Sudharson S, Kalic T, Hafner C, Breiteneder H. 2021. Newly defined allergens in the WHO/IUIS allergen nomenclature database during 01/2019-03/2021. Allergy. 76(11):3359–3373. doi:10.1111/all.15021.
- Suzek B, Wang Y, Huang H, McGarvey P, Wu C, UniProt Consortium. 2015. UniRef clusters: a comprehensive and scalable alternative for improving sequence similarity searches. Bioinformatics. 31(6):926–932. doi:10.1093/bioinformatics/btu739.
- Wang W, Tai F, Hu X. 2010. Chapter 3. Current initiatives in proteomics of the olive tree. In: Preedy V and Watson R, Editors. Olives and olive oil in health and disease prevention. San Diego (CA): Academic Press; p. 25–32.
- Zhang Y, Du W, Fan Y, Yi J, Lyu S, Nadeau K, Thomas A, McHugh T. 2017. Purification and characterization of a black walnut (Juglans nigra) Allergen, Jug n 4. J Agric Food Chem. 65(2):454–462. doi:10.1021/acs.jafc.6b04387.