
 ?Mathematical formulae have been encoded as MathML and are displayed in this HTML version using MathJax in order to improve their display. Uncheck the box to turn MathJax off. This feature requires Javascript. Click on a formula to zoom.
ABSTRACT
This article concerns discomfort due to sources of glare in the peripheral visual field. A visual task is needed to maintain foveal fixation at a known location, and in past studies the tasks have ranged from a simple fixation mark to a task requiring greater cognitive attention such as reading. It was hypothesized that these different approaches to control visual attention would influence the evaluation of discomfort. This article reports an experiment that compared evaluations of discomfort when using the two visual tasks, a simple circle and a pseudo-text reading task, and two procedures, category rating and luminance adjustment. The results from both procedures confirmed the hypothesis: a lower degree of discomfort was expressed in the pseudo-text trials than in trials with the circular fixation mark.
1. Introduction
Glare is generally associated with a luminance or luminance contrast within the visual field of an observer that is sufficiently greater than that to which the eyes are able to adapt (CIE Citation2016). Discomfort glare is a psychological sensation of discomfort but is not necessarily linked to any measureable changes to visual performance.
This article considers the discomfort caused by glare sources in the peripheral visual field. In the context of an office worker, when looking toward one’s desk surface or PC screen, light sources on the ceiling are potential sources of peripheral glare.
In laboratory experiments of peripheral glare, the experimenter requires that the glare source be located at a known position in the visual field to be able to report precisely its position. To do this, test participants are required to look toward a specific location. Some past studies asked test participants to focus upon a simple fixation mark (for example, a crosshair) (for example, Berman et al. Citation1994; Kent et al. Citation2017a; Luckiesh and Guth Citation1949; Paul and Einhorn Citation1999; Petherbridge and Hopkinson Citation1950; Stone and Harker Citation1973). With this approach, the experimenter must assume that the participant maintained his or her attention upon the mark, because there is no mechanism with which to ascertain the degree to which fixation was maintained. Other studies have taken a more active approach, asking participants to focus upon a task requiring a greater degree of cognitive attention, such as reading alphanumeric characters in rows of pseudo-text (for example, Altomonte et al.; Citation2016; Kent et al. Citation2017b; Osterhaus and Bailey Citation1992; Wienold and Christoffersen Citation2006). Similarly, Sivak et al. (Citation1989) had observers identify gaps of different sizes. Checking the accuracy with which such a task was performed provides the experimenter with some information about the degree to which fixation was maintained during the evaluation. In the current article, the device used to maintain fixation is known as a visual task.
We hypothesize that changes in the visual task will affect the discomfort evaluation. It is of interest to lighting designers to test such a hypothesis. For example, if the degree of discomfort is reduced when engaged in a work-like task, then glare thresholds established using experiments with a simple fixation mark may lead to design conditions which are unnecessarily conservative.
A demonstration of the likely influence of visual task on discomfort evaluations can be gained by comparing the results of Iwata et al. (Citation1992), with those from Petherbridge and Hopkinson (Citation1950), although in both studies the sources of glare were directly fixated rather than being peripheral. Both studies used a small artificial source (0.026 sr (Iwata et al. Citation1992) and ~0.027 sr (Petherbridge and Hopkinson Citation1950)) and the same set of glare criteria. In Iwata et al. (Citation1992), foveal attention was maintained using a visual task requiring cognitive attention (that is, a textbook on a desk) and then, after 2 min, observers provided their evaluation of discomfort (Iwata et al. Citation1992). The second study, by Petherbridge and Hopkinson (Citation1950), did not use a visual task. shows discomfort sensations on the multiple-criterion scale, as calculated by Iwata et al. (Citation1992) from their results and those of the previous study. For a given degree of discomfort, the Daylight Glare Index determined by Iwata and others is higher than that determined by Petherbridge and Hopkinson: in other words, when engaged in the task requiring a greater level of cognitive attention, test participants tolerated a higher glare luminance.
Table 1. Comparison of discomfort sensations as reported by Petherbridge and Hopkinson (Citation1950) and the daylight glare index reported by Iwata et al. (1992).a
Two reasons why the visual task might affect discomfort evaluations are that they differ in the degree of cognitive attention required and the degree to which they encourage foveal fixation to be maintained.
At any given time, the human sensory system receives multiple signals from different stimuli (for example, thermal, visual, acoustic) within the local environment (Vuilleumier Citation2005). The brain, however, has a limited capacity to simultaneously process multiple signals and employs various mechanisms to filter information based on its relative importance (Vuilleumier Citation2005). For visual information, such mechanisms include emotional valance (that is, sensations that vary from pleasure to displeasure) and arousal (that is, sensations that range from calm to exciting), which are known to modulate sustained attention (Lane et al. Citation1999; Matthews et al. Citation1990; Yao et al. Citation2016). Both valence and arousal represent imperative parameters that form a close relationship with motivational direction (that is, the motivation to engage or avoid stimuli) (Lang et al. Citation1993). When multiple stimuli are present at the same time, the most important signal (that is, visual tasks requiring cognitive attention) may be selected for further processing by passing through a sensory barrier to the visual cortex (that is, selective attention) (Broadbent Citation1958). Conversely, less important signals (for example, the glare source) might not pass (or pass with a delay) through the sensory barrier and will remain unattended (Driver Citation2001). We hypothesize that visual tasks requiring more cognitive attention would provide more distraction from sources of discomfort and hence increase the tolerance to glare.
An alternative hypothesis is that, when using a simple fixation mark, observers may not maintain fixation to the same degree as with a more demanding visual task. Instead, a greater tendency to look toward the glare source reduces the peripheral angle, as characterized by the position index, and with smaller peripheral angles the degree of discomfort increases.
We therefore hypothesized that instructing participants to focus attention on a visual task demanding a greater degree of cognitive attention (for example, reading lines of randomized pseudo-text) will lead to lower evaluations of discomfort due to glare than when instructed to focus attention toward a simple fixation mark (for example, an abstract circle containing no distinguishable features). In this article, we report experiments carried out to test this hypothesis using two visual tasks: a circle and a set of pseudo-text reading tasks. The experiment was repeated under two procedures commonly used in past studies, luminance adjustment and category rating, to enable validation by concurrent assessment.
2. Method
2.1. Experimental Setting
An experiment was conducted to compare evaluations of discomfort due to glare when visual attention was focused toward either a simple fixation mark or a pseudo-text reading task. The apparatus used is shown in . The participant sat in front of a lighting chamber that was semi-hexagonal in plan, with a rear wall of 0.92 m width and 2.7 m height, and that occupied the full field of view. The interior surfaces were painted matte white. Within the chamber, a flat visual display unit (VDU) monitor (17-in. Viglen TS700 liquid crystal display, mean self-luminance = 65 cd/m2) was placed on a matte white desk surface. The frame and mount of the VDU were both matte white, thus reducing contrast between the VDU and the background surfaces. The connection cables that ran along the back of the desk toward the floor were covered with matte white tape, as were the corners of the chamber where the side walls met the rear wall. A wireless mouse was used to navigate the cursor on the VDU.
Fig. 1. Plan layout and photograph of the lighting chamber used in this study. Note that extraneous laboratory lighting (switched on for this photograph) was switched off during the tests, meaning that the room was dark other than the glare source, the VDU, and its surround.
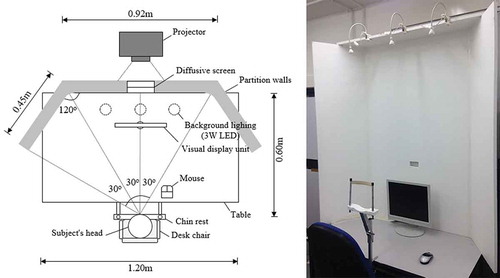
Background lighting was produced from three 3-W light emitting diode lamps located above the chamber. Luminance measurements were taken from the location of a test participant’s head position using a Minolta LS-100 luminance meter mounted on a tripod. From this position, the mean background luminance was calculated from 16 separate measurements taken on a regular grid extending across the width of the cubicle and an additional measurement was taken that included the luminance of the VDU. The mean luminance of the background was held at a constant 65 cd/m2 throughout the experiment, because this falls within the range commonly found in interior spaces (Chartered Institution of Building Services Engineers Citation1994). These background luminances were checked before each test session. Both the VDU and background lighting produced a correlated color temperature of 4000 K as measured from the viewing position with a Minolta CL-200a chromameter. The luminance meter and the chromameter were both calibrated to the national standard within the previous 12 months.
The glare source was a small diffusive screen (0.08 × 0.04 m) made from three sheets of translucent paper, back-lit by a projector. From the observation position, the glare source subtended a solid angle at the eye of 0.009 sr, similar to previous studies (Luckiesh and Guth Citation1949; Petherbridge and Hopkinson Citation1950), and was 20° above the center of the VDU. Each sheet of paper had a visible transmittance τ = 0.56 and reflectance ρ = 0.81. The paper was flush with the surface of the partition wall, meaning that changes in glare source luminance did not affect the remainder of the background surface luminance. Using a laptop connected to a projector, a uniform image was projected onto the diffusive screen via Photoshop, a widely used image editing program. The brightness function of Photoshop has a range of −100 to + 100 units, and this range was calibrated to the glare source luminance (see ). The glare source could thus be set to luminances from 200 cd/m2 to 32,000 cd/m2.
Fig. 2. Relationship between relative brightness function of the adjustment software and glare source luminance as measured from the location of the test participant using a Minolta LS-100 luminance meter.
The aim of this experiment was to evaluate discomfort from a peripheral source of glare, which requires that foveal attention is maintained on a known location. To do this, participants were instructed to look toward a visual task on the VDU, located below the glare source (see Section 2.2). The two visual tasks were alternately presented at the center of the screen (20° below the center of the glare source) with a chin rest used to maintain a constant viewing position.
To simplify this experiment, two of the parameters known to affect discomfort glare were held constant; that is, background luminance and glare source area. The degree to which a third parameter was held constant (that is, the position of the glare source in the field of vision of the participant) differed depending on the type of visual task. Only the luminance of the glare source was purposefully varied. Extraneous sources of light within the laboratory were masked from the experimental setting.
Twenty-four participants were recruited for this experiment via an online advertisement addressed to all postgraduate students in the Department of Architecture and Built Environment, University of Nottingham. The sample consisted of 13 females and 11 males, with a mean age of 29.50 years (SD = 3.7). Thirteen participants wore their normal corrective lenses during the tests, and all self-certified as having no other health or eye problems. Of those wearing corrective lenses, 10 participants wore glasses and 3 wore contact lenses.
Two experimental procedures were used: luminance adjustment, in which the glare source luminance was adjusted while the background luminance was held constant (as previously used by, for example, Hopkinson and Bradley Citation1960; Tuaycharoen and Tregenza Citation2005) and category rating, in which evaluations of visual discomfort were given with the glare source set to a series of fixed luminances (as previously used by, for example, Altomonte et al. Citation2016; De Boer and Schreuder Citation1967). A repeated measures design was used, whereby participants conducted trials with both procedures in a balanced order.
2.2. Visual Tasks
In both procedures, test participants were required to direct their visual focus toward a visual task on the VDU. Two tasks were used: a circle, expected to require a low degree of cognitive attention, and a row of pseudo-text (), expected to demand a higher degree of cognitive attention. Though these tasks were intended to attract foveal fixation, we did not measure gaze behavior to confirm this as might be done using eye-tracking glasses. If the visual task does not maintain foveal fixation, this changes the peripheral location of the glare source, which may affect the degree of discomfort. Though this question has been addressed in the context of target detection (Fotios et al. Citation2016), further work is needed to investigate this in the context of discomfort evaluation.
Fig. 3. Examples of the visual tasks used in trials: (a) a circle and (b) an example row of pseudo-text. Note: these illustrations are not to scale.
The circle had a diameter of 12 mm and was positioned at the center of the VDU. At the participant’s eye this subtended an angle of approximately 1.72°. The circle outline was black, with a one-point line width. When seen against the white background of the screen, the circle contrast was C = −0.77 according to the Weber formula (Boyce Citation2014).
The pseudo-text consisted of a row of 16 randomly chosen alphanumeric characters, displayed with 14-point Calibri font. Each character was 8 mm high and subtended an angle of approximately 1.15° at the participant’s eye. There was a double space between each character. The characters were black and subtended a luminance contrast of C = −0.77 against the background. Twenty rows of pseudo-text were created, with only one row visible at a time on the VDU; successive rows were revealed by the test participant using a scroll bar. Though task difficulty and hence cognitive attention might be influenced by the size of font used, this was not explored in the current work. Participants were instructed to read aloud each of the pseudo-text characters, from left to right, and were informed that both speed and accuracy were important. Responses were recorded to enable accuracy to be checked.
2.3. Photometric Conditions
Settings of glare source luminance (that is, the starting luminance used in the adjustment procedure and the luminance settings in the category rating procedure) were determined using the IES Glare Index (IES-GI, (1)). To use this equation required the position index: because the glare source was located above the visual task, we used the Luckiesh and Guth (Citation1949) formula (2) as recommended (IESNA Citation2011).
where Ls is the source luminance (cd/m2), ωs is the solid angle subtended by the glare source (sr), Lb is the background luminance (cd/m2), and P is the Position Index.
where α is the angle from the vertical plane containing the glare source and the line of sight (°) and β is the angle between the line of sight and the line from the observer to the glare source (°).
2.4. Procedure 1: Luminance Adjustment
At the start of the experiment, participants adjusted the chair so that they were seated comfortably with their head on the chin rest. The instructions were then provided, including a definition of discomfort glare, the meaning of the four discomfort sensations (see Appendix), and a description of the experimental procedures.
For the luminance adjustment procedure, participants were asked to indicate when the glare source luminance resembled each of four discomfort sensations: just imperceptible, just acceptable, just uncomfortable, and just intolerable. To help clarify the meanings of these terms, each criterion was linked to Hopkinson’s detailed protocol as published in MacGowan (Citation2010) and to time span descriptors (Velds Citation2002) (see Appendix). This process follows Hopkinson’s multiple-criterion technique (Hopkinson and Bradley Citation1960; Petherbridge and Hopkinson Citation1950), which is the basis of the Unified Glare Rating (CIE Citation1995). Though different response scales may lead to different outcomes (Gellatly and Weintraub Citation1990), that was not the focus of the current study.
At the start of each block of four trials (one for each glare criterion), the glare source was set to a standard luminance (2354 cd/m2) corresponding to a glare index of 18.5 (the Borderline between Comfort and Discomfort [BCD]) according to the IES-GI (1).
The glare source luminance was adjusted by the experimenter under command from the test participant (participants were asked whether they would like the experimenter to increase, decrease, or keep constant the brightness of the glare source). Adjustment was achieved by changing the luminance in steps of one unit on the relative brightness scale (see ). When altering the luminance of the source to the next sensation of discomfort, the experimenter used key presses to create the adjustment in the direction (for example, increase or decrease) indicated by the participant.
After making a setting, the trial continued with adjustment to the next level of discomfort. Luminances set using an adjustment task are likely to be affected by anchors (Kent et al. Citation2017a; Logadottir et al. Citation2011, Citation2013; Pulpitlova and Detkova Citation1993), the initial setting of the independent variable at the outset of each adjustment, and hence also the order in which the four discomfort sensations were set. Therefore, starting from the standard initial luminance (intended to represent the BCD according to the IES-GI), the four discomfort sensations were evaluated in a random order. This procedure differs slightly from Hopkinson’s multiple-criterion technique (Hopkinson and Bradley Citation1960; Petherbridge and Hopkinson Citation1950), which originally instructed observers to make glare settings in a strict ascending sequence (that is, starting with just imperceptible and then to the others in increased order of discomfort). The effect of this order is discussed elsewhere (Kent et al. Citation2018).
Once a particular discomfort criterion was reached, the luminance of the glare source was recorded. After evaluating discomfort for all four discomfort sensations with one focus of visual attention (the circle or the pseudo-text), the trial was repeated (after a 2-min break) using the second focus of attention; this order was counterbalanced across test participants.
2.5. Procedure 2: Category Rating
In the category rating procedure, the magnitude of discomfort due to glare was evaluated at four different levels of glare source luminance in a random order. These luminances were chosen to provide the four levels of discomfort based on Hopkinson’s multiple-criterion scale (Hopkinson Citation1960) as shown in . Evaluations of discomfort under the four different glare source luminances were carried out for one focus of attention (that is, the circle or the pseudo-text) before repeating the procedure with the second focus of attention, which were used in a counterbalanced order across test participants.
Table 2. Source luminance settings at which category rating evaluations were given.
The glare evaluation was reported by placing a mark on a continuous scale () as previously used by others (Altomonte et al. Citation2016; Tuaycharoen and Tregenza Citation2007). This scale features Hopkinson’s original borderline criteria (for example, just imperceptible) above the scale and absolute criteria (for example, perceptible) underneath the scale (Hopkinson Citation1972). In those trials where the visual task was the circle, participants were required to wait for 10 s after the luminance was set before making their evaluation. In those trials where the visual task was the pseudo-text, the evaluation of discomfort was made immediately after reading the 16 characters.
Fig. 4. Continuous scale used to evaluate the magnitude of discomfort due to glare. The descriptors above the line are those from Hopkinson’s multiple-criterion scale.
To compare results from the category rating procedure (a position along the response scale) with conventional glare indices, the glare evaluations given on the continuous scale were scaled to equivalent glare index values following the method proposed by Altomonte et al. (Citation2016). This allowed measurements (in centimeters) on the continuous scale—indicating perceived levels of discomfort—to be converted into an equivalent glare index. Utilising the data found in (Hopkinson Citation1960, Citation1972) that relate each of the four discomfort sensations to corresponding values of IES-GI, glare response votes scaled to the IES-GI (Glare Response Vote (GRV) (IES-GI)), suitable for assessing glare sensation from small artificial light sources were obtained. In this study, GRV (IES-GI) values were calculated according to (3) and (4) (Altomonte et al. Citation2016):
where marker (cm) indicates the distance from the left-hand end of the scale as indicated by the participant on the continuous scale.
The two procedures were conducted in a balanced order. Before either trial was conducted, a practice session was performed to establish familiarity with the four discomfort sensations; this was done only using the adjustment procedure. These settings were not recorded.
3. Results
3.1. Discomfort Evaluations
and show the results from the luminance adjustment and category rating procedures, respectively. For the adjustment procedure, shows the mean luminance to which the glare source was set for each of the four discomfort sensations and for the two visual tasks. These data indicate (as expected) that higher luminances were set for the glare criteria of higher discomfort than for glare criteria of lower discomfort. For each of the four discomfort sensations, the mean luminance appears to be slightly higher for the pseudo-text than for the circle, and this difference increases for discomfort of greater magnitude. For each glare setting, a higher mean luminance indicates that there was a greater tolerance for discomfort. also reveals a high degree of variance about the mean.
Fig. 5. Mean luminance at each discomfort sensation as determined using the luminance adjustment procedure. Error bars show the standard deviation.
Fig. 6. Mean GRV (IES-GI) and standard deviation for glare evaluations using the category rating procedure. Error bars show the standard deviation.
For the category rating procedure, plots the mean GRV for the four set luminances for the two visual tasks. For evaluations at higher luminances, the glare ratings increased in the expected manner. For evaluations at the four luminances used in trials, mean GRV (IES-GI) values were consistently lower when participants focused their attention onto the pseudo-text than when focused on the circle. In other words, they were more tolerant to glare with the pseudo-text, as was also displayed by the results of the luminance adjustment procedure.
Results from both procedures reveal a large standard deviation. Because discomfort glare is often characterized by large individual differences (Boyce Citation2014), large standard deviations about the mean were expected. The contributions to these differences are vast and usually linked to an unknown number of variables (that is, stimulus range bias, anchoring effects, et cetera) that cannot be easily experimentally controlled.
Null hypothesis significance testing (NHST) was performed to determine whether the differences between the groups of data were statistically significant. The emphasis of the inferential analysis was placed on the effect size, a standardized measure of the magnitude of the differences detected (Ellis Citation2010), and not only on the statistical significance (Aarts et al. Citation2014) (which, in cases of small or uneven sample sizes, could confound the outcome) (Cohen Citation1965).
The purpose of this analysis is to compare, for a given degree of discomfort, the difference in discomfort evaluation for the two visual tasks. The analysis was carried out using paired sample t-tests to compare the dependent variables (source luminance and GRV (IES-GI)) for each independent variable (discomfort sensations and luminance setting) across the two different visual tasks. The Shapiro-Wilk test suggested departures from normality in distributions of these data in four of the eight conditions ().
Table 3. Results of the Shapiro-Wilk test used to assess normality of data distributions. These data were the differences in evaluations between the two visual tasks.
Therefore, to relax the assumption of normality required for a paired sample t-test, a bias-corrected and accelerated bootstrap was performed for both descriptive (difference in mean and their 95% upper and lower confidence intervals) and statistical (standard error and P-value) parameters (DiCiccio and Efron Citation1996; Efron Citation1987; Field and Wilcox Citation2017). Effect size was calculated by making use of equivalence between the observed differences and Pearson’s coefficient, r (5) (Field Citation2013).
where t is the test statistic extracted from the t-test and df is the degrees of freedom.
The interpretation of the outcome was derived from the tables provided by Ferguson (Citation2009), where conventional values have been proposed as benchmarks for small (recommended minimum effect size representing a practically relevant effect), moderate, and strong effect sizes (Pearson’s r ≥ 0.20, 0.50, 0.80, respectively). Values below 0.20 were considered negligible and not substantive (that is, not practically relevant effects).
presents the results of the paired sample t-tests, providing the four discomfort sensations (luminance adjustment procedure) and luminance settings (category rating), the means and standard deviations (M and SD) from the pairwise comparison for both visual tasks, the mean differences (ΔM), the interpretation of their statistical significance (NHST) and their 95% lower (CIL) and upper (CIU) confidence intervals, and the effect size (r).
Table 4. Bias-corrected and accelerated bootstrapped paired sample t-tests and effect sizes.a
For luminances set using the adjustment procedure, inspection of the descriptive and inferential statistics shows that the mean differences (ΔM) and effect sizes are negative, signaling that higher luminances were set when the participant’s focus was directed onto the pseudo-text than when on the circle. The magnitude of the differences increases for higher levels of discomfort. That is, the effect of visual focus increases when participants experienced more discomfort glare. The differences detected are significant for just intolerable glare, weakly significant for just uncomfortable glare, and not significant for just imperceptible and just acceptable glare. The effect sizes indicate that, in general, the differences detected have, in their absolute value, a small yet substantive magnitude (r > 0.20).
For the category rating, in all comparisons displayed, the results demonstrate that the differences in mean GRV (IES-GI) are consistently positive. This suggests that, at each luminance setting, participants expressed lower degrees of discomfort when their attention was focused on the pseudo-text task. The differences are significant under the just intolerable setting, weakly significant under the just acceptable and just uncomfortable settings, and not significant under the just imperceptible setting. The effect sizes indicate that, in all cases, the differences detected are above the recommended minimum value representing a substantive effect (r > 0.20).
Although the effect sizes in this study are mostly defined as small according to Ferguson’s (Citation2009) conservative thresholds and denominations, they are all of a substantive magnitude; that is, they denote a difference of practical relevance. Therefore, their importance should not be understated; even small effects can accumulate into larger practical outcomes (Ellis Citation2010). For example, a small effect in the perception of visual discomfort—due to differences in visual focus—could lead to large implications in terms of blind operation, artificial lighting loads, energy usage, etc.
The current work suggests that one aspect of experimental design when evaluating discomfort matters; that is, the degree of cognitive attention demanded by the visual task used as a target for visual fixation. This finding extends that of Sivak et al. (Citation1989), who found that discomfort evaluations were affected by changes in the visual size of the task, and by Altomonte et al. (Citation2016), who found similar results when investigating both the size and contrast of the visual target.
3.2. Pseudo-Text Reading Accuracy
The number of pseudo-text characters correctly identified provides one measure of how well fixation was maintained on this task, with the assumption that a lower error rate means a greater degree of fixation. The number of errors, number of characters read, and percentage of errors (%) are reported in .
Table 5. Errors in reading the pseudo-text.
In those trials using the category rating procedure, participants were required to read two rows of 16 pseudo-text characters prior to making each evaluation. Thus, for each of the four luminance settings at which discomfort was evaluated, 768 characters were read by the 24 test participants. Across the four luminances, only 69 (2.2%) were incorrectly identified. Within the luminance adjustment procedure, participants were able to provide adjustment instructions to the experimenter at any time, which resulted in a different number of characters attempted on each trial. In further work, we would suggest a requirement for a certain number of characters to be read before giving each adjustment instruction. Overall there were 39 incorrectly identified characters from a total of 2226 attempted, an error rate of 1.8%. The low error rate in both procedures suggests that fixation was maintained upon the pseudo-text.
In both procedures, the percentage of errors increased progressively as the degree of discomfort also increased, as might be expected if the higher glare source luminance also caused disability. The rate of increase agrees with that reported by Osterhaus and Bailey (Citation1992), who revealed a decrease of approximately 3% in visual task efficiency (including increased error rates) under high levels of discomfort due to glare.
4. Conclusions
This article investigated discomfort due to glare in the peripheral visual field. To study peripheral glare in laboratory experiments requires that a visual task is given to hold visual fixation. Past studies have used different visual tasks, varying in cognitive load, and it was hypothesized that this would affect the discomfort evaluation.
Discomfort due to peripheral glare was therefore evaluated using two procedures (luminance adjustment and category rating) with two visual tasks, a circle (a simple fixation mark) or a series of pseudo-text (a task demanding a greater degree of cognitive attention). The results demonstrate that the visual task influenced the evaluation of discomfort. When engaged in the pseudo-text task, participants were more tolerant to glare, seen as settings of higher luminance in the adjustment task and lower ratings of discomfort in the category rating task. The differences are statistically significant with a small, yet practically relevant, effect size. This change in discomfort may be due to differences in the degree of cognitive attention demanded by the visual task or to the ability of the task to maintain fixation and reduce glances toward the glare source.
There are three applications for these results. For experimenters planning further studies, these data show that the visual task matters and therefore requires some consideration. For those reading past studies, these data show that interpretation of the results should give consideration to the visual task. For those applying the results to design practice, these data show the need to use results from experiments using a visual task that best resembles that of the application.
The current experiments used test participants from a younger age group only. For the aim of this experiment, to show that a specific change in experimental design has a significant effect on the outcome, the age range is not critical. To quantify the effect of any bias, and hence to establish the influence on past results, the current experiments should be repeated with test participants of a broader range of ages.
Disclosure statement
The authors have no interests to declare.
Additional information
Funding
References
- Aarts S, Van De Akker M, Winkens B. 2014. The importance of effect sizes. Eur J Gen Pract. 20:61–64.
- Altomonte S, Kent MG, Tregenza PR, Wilson R. 2016. Visual task difficulty and temporal influences in glare response. Build Environ. 95:209–26.
- Berman SM, Bullimore MA, Jacobs RJ, Bailey IL, Gandhi N. 1994. An objective measure of discomfort glare. J Illum Eng Soc. 23:40–49.
- Boyce PR. 2014. Human factors in lighting. 3rd ed. Boca Raton (FL): CRC Press.
- Broadbent DE. 1958. Perception and communication. Applied Psychology Unit of the Medical Research Council, Cambridge. London (UK): Pergamon Press.
- [CIBSE] Chartered Institution of Building Services Engineers. 1994. Code for interior lighting. London (UK): CIBSE.
- [CIE] Commission International de L’Eclairage. 1995. Discomfort glare in interior lighting. CIE. Publication No. CIE 117-1995. Vienna, Austria.
- [CIE] Commission International de L’Eclairage. 2016. ILV: international lighting vocabulary. 2nd ed. CIE. Publication No. DIS 017/E: 2016. Vienna, Austria.
- Cohen J. 1965. Some statistical issues in psychological research. In: Wolman BB, Editor. Handbook of clinical psychology. New York (NY): McGraw-Hill.
- De Boer JB, Schreuder DA. 1967. Glare as a criterion for quality in street lighting. IESTrans. 32(2):117–35.
- DiCiccio EB. 1996. Bootstrap confidence intervals. Stat Sci. 11(3):189–228.
- Driver J. 2001. A selective review of selective attention research from the past century. Br J Psychol. 92:53–78.
- Efron B. 1987. Better bootstrap confidence intervals. J Am Stat Assoc. 82(397):171–85.
- Ellis PD. 2010. The essential guide to effect sizes: statistical power, meta-analysis, and the interpretation of research results. Cambridge (UK): Cambridge University Press.
- Ferguson CJ. 2009. An effect size primer: a guide for clinicians and researchers. Prof Psychol Res Pr. 40(5):532–38.
- Field A. 2013. Discovering statistics using IBM SPSS statistics. 4th ed. London (UK): Sage.
- Field A, Wilcox RR. 2017. Robust statistical methods: A primer for clinical psychologists and experimental psychopathology researchers. Behav Res Ther. 98:19–38.
- Fotios S, Uttley J, Cheal C. 2016. Research note: maintaining foveal fixation during a peripheral detection task. Lighting Res Technol. 48(7):898–909.
- Gellatly AW, Weintraub DJ. 1990. User reconfigurations of the de Boer rating scale for discomfort glare. Ann Arbor (MI): The University of Michigan: Transportation Research Institute. UMTRI-90-20.
- Hopkinson RG. 1960. A note on the use of indices of glare discomfort for a code of lighting. IESTrans. 25(3):135–38.
- Hopkinson RG. 1972. Glare from daylighting in buildings. Appl Ergon. 3(4):206–15.
- Hopkinson RG, Bradley RC. 1960. A study of glare from very large sources. Illum Eng. 55(5):288–94.
- [IESNA] Illuminating Engineering Society of North America. 2011. Tenth edition. New York (NY): IESNA.
- Iwata T, Shukuya M, Somekawa N, Kimura K. 1992. Experimental study on discomfort glare caused by windows: subjective response to glare from a simulated window. Journal Archit Plann Environ Engng. 432:21–33.
- Kent MG, Altomonte S, Wilson R, Tregenza PR. 2017b. Temporal effects on glare response from daylight. Build Environ. 113:49–64.
- Kent MG, Fotios S, Altomonte S. 2017a. Discomfort glare evaluation: the influence of anchor bias in luminance adjustments. Lighting Res Technol. doi:10.1177/1477153517734280
- Kent MG, Fotios S, Altomonte S. 2018. Order effects when using Hopkinson’s multiple criterion scale of discomfort due to glare. Build Environ. 136:54–61.
- Lane RD, Chua PML, Dolan RJ. 1999. Common effects of emotional valence, arousal and attention on neural activation during visual processing of pictures. Neuropsychologia. 37:989–97.
- Lang PJ, Greenwald MK, Bradley MM, Hamm AO. 1993. Looking at pictures: affective, facial, visceral, and behavioural reactions. Psychophysiology. 30:261–73.
- Logadóttir A, Christoffersen J, Fotios S. 2011. Investigating the use of an adjustment task to set the preferred illuminance in a workspace environment. Lighting Res Technol. 43:403–22.
- Logadóttir A, Fotios S, Christoffersen J, Hansen SS, Corell DD, Dam-Hansen C. 2013. Investigating the use of adjustment task to set preferred colour of ambient illumination. Color Res Appl. 38(1):46–57.
- Luckiesh M, Guth SK. 1949. Brightnesses in visual field at borderline between comfort and discomfort (BCD). Illumin Eng. 44:650–70.
- MacGowan D. 2010. Correspondence. Lighting Res Technol. 42:121.
- Matthews G, Davies DR, Holley PJ. 1990. Extravision, arousal and visual sustained attention: the role of resource availability. Pers Individ Dif. 11(11):1159–73.
- Osterhaus WKE, Bailey IL 1992. Large area glare sources and their effect on discomfort and visual performance at computer workstations. Proceedings of the 1992 IEEE Industry Applications Society Annual Meeting; Houston, Texas, October 4–9. p. 1825–29.
- Paul BM, Einhorn HD. 1999. Discomfort glare from small light sources. Lighting Res Technol. 31(4):139–44.
- Petherbridge P, Hopkinson RG. 1950. Discomfort glare and the lighting of buildings. IESTrans. XV(2):39–79.
- Pulpitlova J, Detkova P. 1993. Impact of the cultural and social background on the visual perception in living and working perception. Proceedings of the International Symposium: Design of Amenity; Fukuoka, Japan, October 5–8. p. 92–95.
- Sivak M, Flannagan M, Ensing M, Simmons CJ. 1989. Discomfort glare is task dependent. Report No: UMTRI-89-27. Ann Arbor (MI): The University of Michigan.
- Stone PT, Harker SDP. 1973. Individual and group differences in discomfort glare responses. Lighting Res Technol. 5(1):41–49.
- Tuaycharoen N, Tregenza PR. 2005. Discomfort glare from interesting images. Lighting Res Technol. 37(4):329–41.
- Tuaycharoen N, Tregenza PR. 2007. View and discomfort glare from windows. Lighting Res Technol. 39(2):185–200.
- Velds M. 2002. User acceptance studies to evaluate discomfort glare in daylit rooms. Solar Energy. 73(2):95–103.
- Vuilleumier P. 2005. How brains beware: neural mechanism of emotional attention. Trends Cogn Sci. 9(12):585–94.
- Wienold J, Christoffersen J. 2006. Evaluation methods and development of a new glare prediction model for daylight environments with the use of CCD cameras. Energ Buildings. 38:743–57.
- Yao Z, Yu D, Wang L, Zhu X, Guo J, Wang Z. 2016. Effects of valance and arousal on emotional word processing are modulated by concreteness: behavioural and EPR evidence from a lexical decision task. Int J Psychophysiol. 110:231–42.
Appendix: Definitions OF Discomfort as Given to Test Participants
In this experiment, you will be asked to express your own perceived level of discomfort glare when presented to a small diffusive screen, using four threshold criteria of glare sensation votes (GSVs): just imperceptible, just acceptable, just uncomfortable, and just intolerable.
These are described below:
Just Imperceptible: when the source of the light becomes quite bright without necessarily giving a sensation of glare. As the light source is being adjusted, for a moment while performing the visual task, the source would be something that attracts your attention.
Just Acceptable: this corresponds to a glare sensation that could be tolerated for approximately one day when working in this room. If you had to work under this lighting condition at your own workstation, you may want to use blinds or other measures to decrease the perceived discomfort.
Just Uncomfortable: this corresponds to a glare sensation that could be tolerated for approximately 15 to 30 min; for example if finishing a certain task would take this amount of time. After this, adjustments to the lighting conditions would be made, if the same degree of discomfort would be present over time.
Just Intolerable: this corresponds to the point where you would no longer be able to work under these lighting conditions for any amount of time and would immediately intervene to change them.