
ABSTRACT
This work examined the processing yields, physico-chemical characteristics, and bioactive properties of Canadian organic cranberry and blueberry pomace and phenolic-enriched extractives. The ethanol extracts from each berry contained three to four times the soluble solids and sugar contents compared to the pomace. The lipid content of organic cranberry pomace (4.44%), cranberry ethanol extractives (3.86%), and blueberry ethanol extractives (4.44%) were significantly lower than the lipid content of the organic blueberry pomace (5.42%). The organic blueberry pomace showed higher protein content (8.41%) than organic cranberry pomace (5.76%); however, both organic cranberry and blueberry ethanol extracts showed similarly low protein contents. Significant differences were observed in the mineral and elemental contents of both pomaces and their extractives. Total phenolics, tartaric esters, flavonols, anthocyanins, and antioxidant activities were increased by two to three times in both organic cranberry and blueberry ethanol extracts compared to their respective pomaces. The major anthocyanins detected in organic blueberry pomace and ethanol extracts were peonidin 3-glucoside, malvidin 3-galactoside, malvidin 3-glucoside, and cyanidin 3-arabinoside. Peonidin 3-galactoside, cyanidin 3-galactoside, cyanidin 3-arabinoside, and peonidin 3-arabinside were the major anthocyanins in the organic cranberry and ethanol extacts. Results indicated that cranberry and blueberry pomace could be used to develop bioactives with antioxidant activity for potential health benefit and/or bioenergy production.
Introduction
Both blueberry and cranberry are crops that are economically important in Canada. The major production areas for cranberry (Vaccinium macrocarpon) are British Columbia (1562 hectares) and Quebec (1087 hectares; AAFC, Citation2008). Key value-added cranberry products include: juice, cranberry sauces, and dried cranberries, with juice being the major value added cranberry product (British Columbia Cranberry Marketing Commission, Citation2011). The blueberry industry is made up of two distinct sectors: high bush and low bush blueberries (AAFC, Citation2012). In Canada, the type of high bush blueberries grown, often referred to as cultivated blueberries, are Vaccinium corymbosum and the majority are produced in British Columbia (5952 hectares), which are sold in the fresh market (AAFC, Citation2011, Citation2012). Rabbiteye blueberry (Vaccinium virgatum, also known as Vaccinium ashei) also falls under the category of highbush variety (Routray and Orsat, Citation2011). Low bush blueberries (Vaccinium angustifolium) are commonly known as “wild” blueberries and the majority of these berries are grown in Quebec and the Atlantic Provinces accounting for 24.9 hectares of land use (AAFC, Citation2012). Only a small percentage of the low bush blueberries produced are sold to fresh markets and the majority are frozen or processed into jams, syrups, purees, or blueberry juice (AAFC, Citation2011).
Solid waste, termed fruit residue or pomace, is the major by-product of fruit processing industries. Pomaces are generally a good source of carbohydrates and other functionally-important bioactive molecules, such as proteins, vitamins, minerals, and polyphenolics (Bhushan et al., Citation2008), yet fruit pomace typically contains high moisture content (70–75%; Gassara et al., Citation2011), which has implications for storage. In general, fruit processing results in nearly 38.1 million metric tonnes (Mt) of fruit waste being produced annually (Djilas et al., Citation2009). Fruit processing results in 20–40% fruit waste (Bhushan et al., Citation2008), so there is need to explore fruit residue/pomace as a resource for different value-added applications.
Phenolics are a major group of bioactive compounds present in fruits and fruit pomace. Phenolic compounds include: flavonoids (such as anthocyanins and flavonols), stilbenes, tannins, and simple phenolic acids. Many of these compounds have been reported to exhibit a wide range of biological effects, including antioxidant, antimicrobial, anti-inflammatory, and vasodilatory activities (Biswas et al., Citation2012; Gross Citation2004; Harrison et al., Citation2013). Fruit residues/pomace represent a potentially useful resource to be explored in the development of new healthy food ingredients, medical compounds, and pharmaceuticals (Cavanagh et al., Citation2003; Nohynek et al., Citation2006). There is interest in using pomace as a source of value-added phenolic compounds as functional food ingredients (Ajila et al., Citation2011) or as antimicrobial agents (Vattem et al., Citation2004). Therefore, assessment of the total phenolics content along with anthocyanin content, composition, and antioxidant activity of different types of berry pomace is important from a human health perspective and for the food and pharmaceutical industries (Bunea et al., Citation2013; Espin et al., Citation2007).
There has been interest in using agricultural waste and residues as a potential source of bioenergy (Kretzschmar et al., Citation2012) or a soil amendment/biochar to increase organic matter content, and improve agricultural productivity through its effect on soil structure, microflora, and nutrient availability (Winsley, Citation2007). Fruit residue/pomace may also serve these purposes. However, producing molecules of economic value from agricultural residues is a significant technological challenge. Therefore, thermochemical conversions (i.e., torrefaction, hydrothermal carbonization, pyrolysis, gasification, and combustion) are receiving increasing interest and utility as a sustainable, second generation method to produce bioenergy, biochar, biochemical, and other bio-based materials (Libra et al., Citation2011; Ross and Godfrey, Citation2012). The initial step in harnessing fruit residue/pomace as a potential bioenergy and/or biochar source is the fundamental characterization of the residue in terms of chemical constituents, as it is the inherent properties of the biomass source that determines both the choice of conversion process and the form of energy to be produced (McKendry, Citation2002). Ultimate analysis provides measurements of the carbon (C), hydrogen (H), nitrogen (N), and oxygen (O) contents along with an indication of the heating value of the material (Kalderis et al., Citation2014). This information is useful in promoting the use of fruit residue/pomace as a potential bioenergy source as little knowledge exists on the use of cranberry and blueberry pomace for the production of bioenergy and/or biochar.
This study explored the pilot scale processing of organically-grown Canadian cranberries and blueberries to obtain a fruit residue/pomace product and phenolic-rich extracts that may be representative of fruit by-products obtained in an industrial setting. The processing methodology utilized was documented to determine overall recoveries and provide a basis for process optimization. The physico-chemical and bioactive contents of the organic berry residues and phenolic-rich ethanolic extracts were characterized to provide information necessary to facilitate their utilization as novel value-added organic products with beneficial health-promoting properties or as an energy source or soil amendment.
Methods and materials
Large-scale processing pomace/fruit residue
In Sept. 2014, approximately 600 kg (1322.7 lbs) of organic frozen lowbush blueberries (Grade A Certified by Ecocert Canada CA-BIO-154) and 600 kg (1322.7 lbs) of organic frozen cranberries (Grade A Product #11E01005-40, Lot: B13 338 CCEX, Certified by Ecocert Canada CA-ORG-006) were delivered from Fruit d’Or (Quebec, PC, Canada) to Agriculture and Agri-Food Canada, Summerland Research and Development Centre, Summerland, BC. Large-scale production of pomace was initiated by thawing the fruit over a 2-day period at room temperature. Once thawed, fruits were stored at 5 °C until pressed, which was within a day. The berries were not milled as they were broken up by the freeze/thaw process. For juice pressing/juice removal, a hydraulic rack and cloth press was used. Thawed berries were added to each rack in amounts of 13.6 kg (30 lbs). Three to four racks were stacked under the press and this was considered one press batch; each batch was pressed in stages of 1000, 2000, and 3000 psi and multiple batches were pressed. The pomace was transferred from racks/press cloths. At this point a small sub-sample of pomace was taken and subjected to moisture content analysis and the remaining pomace was transferred to large plastic bags for freeze drying. Upon completion of freeze drying, the dried pomace yields were calculated. Then the freeze-dried pomace was broken up by hand and then ground through a 2-mm mesh screen using a cutting mill (SM 2000 Retsch, Haan, Germany). For each berry type, pomace was ground in batches and the batches were combined to make a composite sample. The pomace was then divided into approximately half—half for physico-chemical and bioactivity testing and half for 80% ethanol extraction—to obtain a phenolic-rich 80% ethanol soluble extractives product.
Large-scale ethanol extraction of pomace/fruit residue
For the large-scale production of organic blueberry and cranberry ethanol soluble extractives, 12 kg each of organic blueberry and cranberry pomace were subjected to extractions with 80% ethanol. The 80% ethanol was added to pomace at 1:5 (w/v) substrate to solvent ratio in a large mixing bowl. The suspension was vigorously mixed with a mixer (Lightnin, Rochester, NY, USA) and extracted for 1 h. Filtration was used to separate the ethanol soluble extractives from the insoluble solid residues. The mixture was placed in a nylon filter bag (25-µm pore size, 76 cm in length × 18 cm in diameter) which was inserted into a felt filter bag (50-µm pore size, 76 cm in length × 18 cm in diameter) for support. The ethanol soluble extractives were expressed using a 40-L bladder press (Hydropress, Bosa Grape Winery Supplies, Burnaby, BC, Canada). The filtrate was obtained and ethanol was removed with a rotary evaporator (Buchi rotavapor R, Brinkmann Instruments, Mississauga, ON, Canada) set at a temperature of 40 °C at full vacuum. As 80% ethanol was used as the extraction solvent, water was still present in the concentrated extract. The concentrated extract was freeze dried to obtain a dry ethanol soluble extractives final product. Due to high solids contents, prior to freeze drying the filtrate/supernatant was diluted with water to 5 °Brix in order to obtain a free flowing dry product upon completion of freeze drying. For freeze drying, large plastic bags were filled with solutions of 5 °Brix extractives and were then frozen at –20 °C. The bags were slit on top with a razor blade and placed in a freeze drier where they were frozen at –45 °C for several hours. The vacuum was then turned on and freezing conditions continued for approximately 1 h. The condenser temperature was set at approximately –90 °C and shelf temp was set at –25 °C for approximately 7 days. During the freeze drying process, the sample temperature was approximately –30 °C. Drying continued until the sample temperature matched the shelf temperature. When the sample temperature increased to –25 °C, the shelf temperature was increased to 60 °C overnight for a final drying. Upon completion of the drying process the sample was carefully removed from the drier and allowed to cool to room temperature. The entire freeze-drying process took 10–11 days per batch. The samples were protected from moisture until it was cryomilled (Cryomill, SpexCerti Prep, Model 6800-115, Metuchen, NJ, USA). Upon completion of the cryomilling, the ethanol soluble extractives for each berry type were pooled to obtain a composite and representative sample. After cryomilling, the samples were placed in polyethylene bags and stored at –20 °C until physico-chemical and bioactivity analyses.
Physico-chemical characterization
Soluble solids content, titratable acidity, and pH
The soluble solids content (°Brix), pH, and titratable acidity (%TA) was performed on the organic cranberry and blueberry pomace/fruit residues along with the corresponding ethanol soluble extractives that had been freeze dried. The freeze-dried samples (10 g) were dissolved in 90 ml of distilled water, shaken at ~800 RPM on a shaker (VWR 3500 analog shaker, Mississauga, ON, Canada) for 2 h and centrifuged at 10,000× g (~9600 rpm) for 15 min. The supernatant was filtered under vacuum through Whatman No. 41 paper on a Buchner funnel into a 125-mL filtering flask. The resulting supernatant was tested for soluble solids (°Brix), titratable acidity (%), and pH. For soluble solids determination, the refractive indices of the solutions were observed in °Brix temperature-corrected mode on a digital refractometer (Mettler-Toledo, Refracto 30PX, 13/02, LXC13237, Mississauga, ON, Canada). The pH of samples were recorded on a pH meter (VWR International, West Chester, PA, USA) after a 3-point calibration with pH 7.01, 4.01, and 10.01 buffers. An automated titrator (Metrohm 848 Tritrino Plus; Mississauga, ON, Canada) was used to measure titratable acidity (TA%) of 10 mL of the extracts with 60 mL of distilled water to an endpoint of 8.1 with 0.1N NaOH. All analyses were performed in triplicate.
Proximate and ultimate analysis
As noted above, moisture content of the organic cranberry and blueberry pomace/fruit residues obtained after juice pressing was determined. For moisture content determination, ~15 g of pomace was placed into aluminum weighing dishes and placed in a vacuum oven at 70 °C for 24 h. The lipid content of the freeze-dried organic cranberry and blueberry residues/pomace and the corresponding ethanol soluble extractives was determined by the Soxhlet extraction method according to the Association of Official Analytical Chemists International (AOAC) procedure (AOAC, Citation2005). Ash content was assessed using thermogravimetric analysis and performed on freeze-dried material. Thermogravimetric experiments were performed using a thermogravimetric analyzer (SDT Q600, TA Instruments, New Castle, DE, USA). Approximately 5–10 mg of representative samples were evenly distributed into 90-μl alumina sample cups (TA Instruments, New Castle, DE, USA), loaded onto a balance beam into the furnace, and heated in five steps using a method adapted from Donahue and Rais (Citation2009). All heating steps were performed using air gas. The procedure was as follows: (1) heat from 25 °C to 110 °C at 20 °C/min; (2) hold at 110 °C for 5 min; (3) heat from 110 to 1000 °C at 20 °C/min; and (4) hold for 10 min at 1000 °C. All experiments were performed in triplicate. Thermogravimetric (TG) mass loss curves were generated and data were analyzed with the TA Universal Analysis program (version 2000, New Castle, DE, USA) to obtain ash content. Ash content was calculated as the mass remaining after combustion, which occurs when the sample is heated at 1000 °C. It should also be noted that the ash content does not directly correspond to the mineral content of the sample because minerals may undergo thermal decomposition or chemical changes (Donahue and Rais, Citation2009).
Ultimate analysis was performed to obtain the carbon (C), hydrogen, (H), oxygen (O), and nitrogen (N) content. Freeze dried pomace and ethanol soluble extractives samples were analyzed. Values for C, H, N, and O analysis were obtained using a CHN analyzer (Leco CHN628 analyzer, Saint Joseph, MI, USA) equipped with an oxygen add-on module for determination of oxygen content. Approximately 0.15 g of dried sample was weighed into tin foil cups for the Leco CHN628 analyzer to determine C, H, and N content. Ethylenediaminetetraacetic acid (EDTA) was used as the standard at various weights (0.05, 0.1, 0.15, 0.2, 0.23 g). The temperatures of the combustion tube, afterburner, and reduction heater tube were 950, 850, and 700 °C, respectively. For micro oxygen analysis, approximately 2-mg samples were weighed into tin capsules and analyzed in the micro-oxygen add-on of the CHN analyzer. Benzoic acid was used as the standard. Protein content was estimated by multiplying the nitrogen content (%) by a factor of 6.25. All analyses were performed in duplicate and all results are expressed on a dry weight basis.
Bioactives characterization
Preparation of methanol extracts
Total phenolics content was assessed using both the Folin Ciocalteu and Glories methods. The use of the Glories method also allowed for the determination of levels of total tartaric esters, flavonols, and anthocyanins. Extracts used for testing in these methods were obtained using a procedure based on the work of Velioglu et al. (Citation1998). An aliquot of 2.5-g sample (freeze dried berry residue/pomace and dried ethanol extractives) was weighed into a centrifuge tube and 25 mL of 70% MeOH was added to the tube (1:10 ratio). Tubes were vortexed to ensure wetting of all solids. Tubes were placed on a shaker (VWR 3500 analog shaker) and shaken for 60 min. The tubes were then centrifuged for 10 min at ~10,000× g for 10 min. The resulting supernatant was filtered under a vacuum through a Whatman No. 1 paper on a Buchner funnel into a 125-mL filtering flask. The supernatant was collected and the precipitate was extracted for a second time. An aliquot of 12.5 ml of 70% MeOH (1:5 ratio) was added to the precipitate. The system was vortexed, shaken, centrifuged, and filtered as described for the first extraction. The resulting supernatant was pooled with the supernatant from the first extraction. The precipitate was then extracted for a third time. Then, 70% MeOH was added to the precipitate in a 1:5 ratio and the system was vortexed, shaken, centrifuged, and filtered as described for the first and second extractions. The resulting supernatant was pooled with the supernatants from the first and second extractions. Samples were further diluted with 70% methanol if required to be within the standard curve.
Phenolics content: Total phenolics analyses
Measurement of total phenolics using the Folin-Ciocalteu colorimetric method was based on the procedure described by Singleton and Rossi (Citation1965). Briefly, 50 µl of sample extract or gallic acid standard was added to a test tube along with 150 µl MilliQ water. The system was vortexed to ensure adequate mixing and 1 mL of 1/30 Folin-Ciocalteu reagent was added. The system was vortexed and 0.8 mL of Na2CO3 solution (75 g/L) was added. The system was vortexed again to ensure adequate mixing and allowed to sit for 60 min before reading absorbance. Quantification was determined based on a standard curve for gallic acid by measuring absorbance at 765 nm on a spectrophotometer (Cary 50, Agilent Technologies, Mississauga, ON, Canada). The total amount of phenolic content was expressed as mg gallic acid equivalent per gram sample (mg GAE g–1 sample on a dry weight basis). Experiments were performed in duplicate.
Measurement of total phenolics, tartaric esters, flavonols, and anthocyanins using the Glories method was performed using a procedure based on the method provided by Harrison et al. (Citation2013). An aliquot of 0.1 mL of sample extract or standard was added to a test tube. Gallic acid, caffeic acid, quercetin, and cyanidin-3-glucoside were used as the standards for quantification of total phenolics, tartaric esters, flavonols, and anthocyanins, respectively. To the sample or standard, 0.1 ml of 0.1% HCl in 95% EtOH along with 1.82 ml of 2% HCl was added. The system was vortexed and allowed to sit for ~15 min before reading the absorbance. Quantification was determined based on a standard curve for each standard by measuring absorbance at 280 nm, 320 nm, 360 nm, and 520 nm on a spectrophotometer (Cary 50, Agilent Technologies, Mississauga, ON, Canada) for determination of total phenolics, tartaric esters, flavonols, and anthocyanins, respectively. The total amount of phenolic content was expressed at mg standard equivalent per gram sample (mg GAE g–1 sample on a dry weight basis). Experiments were performed in duplicate.
Tannin content
The Folin-Ciocalteu method involves the measurement of all phenolic compounds, including tannins and non-tannin phenolic compounds. Tannin content was determined by modification of the method of Ross et al. (Citation2010) using insoluble polyvinylpolypyrrolidone (PVPP) to remove/bind/precipitate tannins followed by total phenolics measurement using the Folin-Ciocalteu method. Aliquots of samples (1 ml) used for total phenolics measurements were mixed with 50 mg of PVPP and vortexed for 15 min. The tubes were then microfuged at 13,400 rpm for 5 min (Mini Spin Plus, Eppendorf, Hamburg, Germany). The clear supernatants (non-tannin phenolics) were analyzed for total phenolics using the Folin-Ciocalteu method with the tannin content calculated as the difference between total phenolics (containing tannins and non-tannin phenolics) and non-tannin phenolics. Experiments were performed in duplicate.
Antioxidant activity
The antioxidant activity of the samples was investigated by the ferric reducing antioxidant power (FRAP) assay and the ABTS∙+ radical scavenging assay, respectively. For both of these assays, based on total phenolics content results, 70% methanol extracts of samples were diluted to a starting concentration of 25–50 mg/l sample (freeze dried fruit residue/pomace and ethanol extractives) with 10% aqueous ethanol solution. Further dilutions of the 70% methanol extracts of samples at the starting concentration were made at the following levels: 0, 1/20, 1/10, 1/5, 2/5, 3/5, 4/5, and 5/5 with 10% aqueous ethanol.
A 50-mg/l stock solution of Trolox standard was prepared in 10% aqueous ethanol and then diluted at the following levels: 0, 1/20, 1/10, 1/5, 2/5, 3/5, 4/5, and 5/5 for testing.
ABTS∙+ radical scavenging activity: The radical scavenging activity of the samples was determined using the ABTS (2,2’-azino-bis(3-ethylbenzothiazoline-6-sulphonic acid) decolorization assay based on the method provided by Mateos-Aparicio et al. (Citation2010). The day before analysis, ABTS∙+ reagent was prepared by making up 7 mM ABTS in distilled deionized water (39.19 mg/10 ml) then adding 176 µL of 140 mM K2O8S2. The reagent was left to sit overnight in the dark. The ABTS∙+ solution was diluted by adding 30 mL of 80% ethanol with about 0.5 mL ABTS∙+ reagent. The absorbance of the ABTS∙+ solution was then adjusted with further dilution to 80% ethanol or more ABTS reagent to obtain an absorbance reading of 1.0. For analysis, 50 µL of standard and samples (performed in triplicate for each dilution) was added to wells on a 96-well plate. To each sample and/or standard in each well, 250 µl of the diluted ABTS∙+ solution was added. After incubating for 5 min at room temperature, the absorbance at 734 nm was measured using a plate reader (SpectraMax M2, Molecular Devices, Sunnyvale, CA, USA). The results were expressed as Trolox equivalents (TE)/g sample on a dry weight basis. Experiments were performed in duplicate.
Ferric reducing antioxidant power (FRAP): The antioxidant activity, in terms of ferric reducing antioxidant (FRAP), of the samples was evaluated using the method based on the work of Mateos-Aparicio et al. (Citation2010). Further, 10 mM 2,4,6-tripyridyl-s-triazine (TPTZ) was made up in 40 mM HCl. The FRAP working solution was prepare by adding 10 parts of 300 mM of acetate buffer (pH 3.6) with 1 part of 10 mM TPTZ and 1 part of 20 mM FeCl3. For analysis, 50 µL of the sample or standard (performed in triplicate for each dilution) was added to a well on a 96-well plate. To each sample in each well, 250 µL of FRAP was added. After incubating at 5 min at room temperature the absorbance at 593 nm was measured using a plate reader (SpectraMax M2, Molecular Devices, Sunnyvale, CA, USA). The results were expressed as TE/g sample on a dry weight basis. Experiments were performed in duplicate.
Anthocyanins identification and quantification of identified compounds
Identification and quantification of anthocyanins was performed on the same samples used for total phenolics determinations. Anthocyanin content was determined by high performance liquid chromatography (HPLC) on an Agilent system (Agilent 1100 series, Mississauga, ON, Canada) using a photodiode array detector. Chromatography utilized an ACE 3 C8 column (Cat No ACE-112-1503, 150 × 3.0 mm ID, Aberdeen, Scotland) equipped with a guard column containing a guard cartridge (ACE 3 C8, 3-µm guard cartridge for 3.0/4.0/4.6 mm ID, Cat No ACE-112-0103GD) at a flow rate of 0.4 ml min-1 and an injection volume of 5 µL with a column temperature of 35 °C. The solvents used were: eluent (A1) 7% formic acid in methanol and eluent (B1) 7% formic acid in acetonitrile with the following modified gradient: 0–4 min, 100% A1; 4–46 min, 90% A1 and 10% B1; 46–57 min, 100% B1; 57–100 min, 100% A1. Peak identification was based on comparison of retention times with those of external standards and published data (Chang et al., Citation2011; Gao and Mazza, Citation1994; Kalt et al., Citation1999; Lee, Citation2013). The following external standards were used: Delphinidin 3-galactoside (Extrasynthese, Genay, France); Delphinidin 3-glucoside/Myrtillin (Extrasynthese, Genay, France); Cyanidin 3-galactoside/Ideain (Extrasynthese, Genay, France); Cyanidin 3-arabinoside (Extrasynthese, Genay, France); Peonidin 3-glucoside (Fluka-Sigma Aldrich, Oakville, ON, Canada); Malvidin 3-galactoside/Primulin (Extrasynthese, Genay, France); Malvidin 3-glucoside/Oenin (Extrasynthese, Genay, France); and Cyanidin 3-glucoside/Kuromanin chloride (Extrasynthese, Genay, France). All peaks were quantified based on their peak areas as cyanidin 3-glucoside equivalents on a dry weight basis. Total anthocyanin content was calculated from the sum of the detected peaks integrated using consistent integration parameters. Experiments were performed in triplicate.
Mineral content
The freeze dried fruit residue/pomace samples and 80% ethanol soluble extractives samples were vacuum dried overnight and weighed in to crucibles (0.500 ± 0.002 g). Lids were put on the crucibles and the crucibles were ashed in a programmable muffle furnace. The samples were ashed at 525 °C for 8 h. To the ashed crucibles, 10 mL of 1.2 N HCl was added and allowed to sit for 60 min. Samples were analyzed for Ca, Mg, K, P, B, Zn, Fe, Mn, and Cu using an ICP-OES spectrophotometer (Spectroblue TI, Spectro, Kleve, Germany). Experiments were performed in duplicate.
Statistical analysis
The data, obtained from experimental replicates as noted, were recorded as means ± standard deviation. Further statistical analysis was conducted using SAS Institute Inc. Software, version 9.1. Data were subjected to analysis of variance (ANOVA) using the SAS PROC GLM procedure followed by least significant difference (LSD) Fisher’s test at 5% significance level.
Results and discussion
Physico-chemical characterization
Soluble solids content, pH, titratable acidity, and yield
The quality parameters and yields of the organic cranberry and organic blueberry pomace and their ethanol soluble extractives are presented in . The sugar content, pH, and acidity levels are important criteria for assessing fruit quality (Reque et al., Citation2014). The results indicate that sugar was present in the organic cranberry and blueberry pomace along with their corresponding ethanol soluble extractives. Both the organic cranberry pomace and cranberry ethanol soluble extractives exhibited significantly lower (p ≤ 0.05) sugar content (~2.5 and 8.8 °Brix, respectively) compared to the organic blueberry pomace and blueberry ethanol soluble extractives (~2.7 and 10 °Brix, respectively). Reque et al. (Citation2014) reported a value of 10.5 °Brix for Rabbiteye blueberry (Vaccinium ashei) pomace, which was comparable to the value obtained for the organic blueberry pomace (10 °Brix) in the present work. Also, the literature has reported that cranberry fruits contain lower levels of sugars than blueberry fruits (Forney et al., Citation2012), which our work agrees with. Notably, the organic cranberry and blueberry ethanol soluble extractives contained a large amount of sugar as indicated by the high °Brix values and sugar content of the cranberry and blueberry ethanol extractives were calculated to be ~78% and 90% on a dry weight basis, respectively. This result indicated that the 80% ethanol extraction removed large amounts of low molecular weight sugars. These results are in agreement with the work of Harrison et al. (Citation2013), which reported that the °Brix of ethanol extractives obtained from non-organic cranberry juice processing waste to be ~8.5–9.5 °Brix. In terms of obtaining a phenolic enriched extract with minimal sugar content, a water extraction step performed on the cranberry and blueberry pomace prior to the ethanol extraction would likely help to remove water soluble sugars along with organic acids. Also, the ethanol extract that was obtained may be subjected to a clean-up step to remove sugars along with organic acids. The dried ethanolic extracts may be re-dissolved in water and loaded onto a Diaion HP-20 resin column (Sigma-Aldrich, Oakville, ON, Canada), which will selectively bind/retain phenolic compounds (Soto et al., Citation2012). A water wash would remove the sugars and organic acids from the resin while retaining phenolics, which could be eluted from the resin with ethanol, yielding a purified ethanol soluble phenolics fraction (Soto et al., Citation2012).
Table 1. Quality parameters and yields of organic cranberry and blueberry pomace and ethanol soluble extractives.
The organic blueberry pomace samples had a higher pH value (~3.6) compared to the pH value determined for the organic cranberry pomace sample (~2.7) indicating the acidy characteristic of both these pomaces. Rabbiteye blueberry pomace has a pH of 2.94 and the pH of other high bush blueberries was reported to range from 2.8–3.2 (Reque et al., Citation2014). The pH of non-organic cranberry juice was reported to range from 2.47–2.53 (Harrison et al., Citation2013). The organic cranberry ethanol extractives demonstrated a pH value (2.28) lower than the organic blueberry ethanol extractives (2.81). Harrison et al. (Citation2013) indicated that the pH of non-organic cranberry ethanol extractives ranged from 2.36–2.47. Also, the ethanol soluble extractives had lower pH values compared to the pH levels determined for the corresponding pomace samples. This seems to indicate that the organic acids responsible for acidity were extracted into the 80% ethanol from the pomace. Low pH values are of relevance in terms of preservation. Also, the pH of the pomace is important with respect to potential use as a bioenergy source and/or biochar soil amendment. Anouti et al. (Citation2016) studied the hydrothermal liquefaction conversion of black currant pomace into a bio-oil energy product and noted that pH of the reaction mixture, as affected by pomace pH, may influence the physico-chemical properties of the resulting bio-oil. Soil pH determines nutrient bioavailability and hence fruit growth, yield, and quality (Liu et al., Citation2014) and as such, the pH of material being applied as a soil amendment is important.
Literature has indicated that the key organic acids present in lowbush blueberry fruits are citric and malic acid (Kalt and McDonald, Citation1996) and the main organic acids present in cranberry fruits have been reported to be citric, malic, and quinic acid (Forney et al., Citation2012). As such the TA values for the organic cranberry and blueberry pomace along with corresponding ethanol extractives were presented in terms of citric acid and malic acid as the main organic acids. The type and amount of acids present may impact sensory properties as malic acid alone or in combination with citric acid has been noted to be sour (Kalt and McDonald, Citation1996). With regards to titratable acidity (TA), the organic cranberry pomace had higher levels (0.558% citric acid and 0.623% malic acid) compared to the organic blueberry pomace (0.072% citric acid and 0.069% malic acid). The TA values obtained for the ethanol soluble extractives displayed the same trend that was also observed with the pH values in that the ethanol extractives contained higher TA levels compared to the corresponding values obtained for the pomace.
The yields of the pomace obtained from pilot scale juice processing of the organic cranberries and blueberries were 14.47% and 14.16%, respectively, which was calculated as pomace mass/fresh berry weight × 100%. The yields of the organic cranberry and blueberry ethanol extractive obtained from pilot scale ethanol extraction were 0.699% and 0.751%, respectively, which were calculated as dried ethanol extractives/fresh berry mass × 100%. Laroze et al. (Citation2010) examined the extraction of phenolic compounds from commercially obtained blueberry, cranberry, and raspberry pomace using conventional extraction with methanol on a laboratory scale. For an extraction time of 1 h and a particle size of ≤1 mm, which was comparable to the extraction time and substrate particle size used in this work, extract yields of ~2.5% from blueberry pomace and ~5.5% from cranberry pomace were reported. The yields of ethanol soluble extractives from the organic blueberry pomace and organic cranberry pomace obtained from the present work provided on a pomace basis were 5.3% and 4.83%, respectively. Overall, the yields of extractives obtained from organic cranberry pomace are in good agreement. The yields of extractives from the organic blueberry pomace were nearly two times the yield of extractives from the non-organic blueberry pomace reported by Laroze et al. (Citation2010).
Proximate analysis
The chemical composition of the organic cranberry and organic blueberry pomace along with corresponding ethanol soluble extractives is presented in . The moisture content of the cranberry and blueberry pomaces (fresh pressed, non-freeze dried material) were approximately 68% and 64%, respectively, which makes it susceptible to microbial decomposition and necessitates a drying step for utilization as an ingredient. It is noted here again that all other proximate values are expressed on a dry weight basis. The lipid content of the organic cranberry pomace, cranberry ethanol extractives, and blueberry ethanol extractives (4.41%, 3.86%, and 4.44%, respectively) was significantly lower than the lipid content of the organic blueberry pomace (5.43%). White et al. (Citation2010) reported the lipid levels of non-organic cranberry pomace to be 12% and the lipid levels were thought to be high due to oil from the cranberry seeds and wax present on the skins. This lipid value was substantially higher than the values reported in our work. Reque et al. (Citation2014) reported that the lipid content of blueberry pomace obtained from Rabbiteye blueberries was 0.67%, while a value of 3% was reported for blueberry fiber (Marshal Ingredients, Citation2016), which is comparable to our results for blueberry pomace. The lipid content of whole wild (organic) frozen blueberries, raw blueberries (presumed non-organic), and cranberry (presumed non-organic) was reported by the USDA (Citation2016) to be 1.12%, 2.09%, and 1.03% (converted to be reported on a dry basis). These values are in line with those reported in the present work. The protein content of the organic cranberry pomace (~5.8%) was significantly lower than that of the organic blueberry pomace (~8.4%), while the protein content of the cranberry and blueberry ethanol extractives were minimal with levels of 0.6% and 0.45%, respectively. The work of White et al. (Citation2010) also reported the protein content of non-organic cranberry pomace to be 2.2%, while the USDA indicates that whole cranberry (presumed non-organic) was 3.6% (converted to be reported on a dry basis). Reque et al. (Citation2014) reported the protein content of blueberry pomace obtained from Rabbiteye blueberries to be 4.67%, while a value of 9.34% was reported for blueberry fiber (Marshal Ingredients, Citation2016), which is comparable to our results for blueberry pomace. The protein content of whole wild (organic) frozen blueberries, and raw blueberries (presumed non-organic) was reported by the USDA (Citation2016) to be 4.7% and 0% (converted to be reported on a dry basis). The protein content of fruits and consequently pomace can be affected by soil conditions, which may explain these differences (SARE, Citation2014; Worthington, Citation2001).
Table 2. Chemical composition of organic cranberry and blueberry pomace and ethanol soluble extractives.
The total carbohydrate content (on a wet matter basis) was calculated by difference using the following relationship: Total carbohydrates = 100% – [Moisture content (%) + Total lipids (wet basis, %) + Protein content (wet basis, %) + Ash (wet basis, %)]. For this equation, the values of total lipids, protein content, and ash presented on a dry mater basis in were recalculated to a wet basis. The carbohydrate value on a wet basis was then recalculated and reported on a dry basis in . The cranberry and blueberry ethanol soluble extractives exhibited high values of total carbohydrates, with levels of 94.75% and 93.95% being determined, respectively, while the cranberry and blueberry pomace presented lower values of total carbohydrates with levels of 88.78% and 84.91% being determined, respectively. The USDA (Citation2016) provided carbohydrate levels for whole wild (organic) frozen blueberries, raw blueberries (presumed non-organic), and cranberry (presumed non-organic) as 91.77%, 97.54%, and 94.40% (converted to be reported on a dry basis). The carbohydrate values obtained for the blueberry and cranberry pomaces are lower than those reported by the USDA, yet the USDA carbohydrate content values are for whole berries, which contain juice and simple sugars for which a higher level of carbohydrates would be expected.
Ultimate analysis provides measurements of elemental composition, which is an important property in biomass utilization (Shen et al., Citation2010) and results are presented in . With respect to elemental analysis, the carbon content of the organic cranberry pomace (~51%) and blueberry pomace (~51%) were the same and therefore not significantly different (p > 0.05), while the carbon content of the organic cranberry and blueberry ethanol extractives were significantly lower (p ≤ 0.05) with values of approximately 46% and 45% being measured, respectively. The hydrogen content ranged from 6.39% to 6.99% for all of the samples with the organic blueberry ethanol extractives presenting the highest values and the organic cranberry ethanol extractives presenting the lowest values. The hydrogen content of the organic cranberry pomace (6.88%) was significantly (p ≤ 0.05) higher than the hydrogen content of the organic blueberry pomace (6.62%). The oxygen content of the samples ranged from approximately 44% to 53% with the organic blueberry ethanol extractives presenting the highest oxygen content and the organic blueberry pomace presenting the lowest oxygen content. The organic cranberry ethanol extractives contained ~50% oxygen and the organic cranberry pomace contained about ~46% oxygen. The nitrogen content followed the same trend as the protein content and the nitrogen contents of the organic cranberry pomace (0.92%) was significantly lower than that of the organic blueberry pomace (1.35%), while the nitrogen content of the organic cranberry and blueberry ethanol extractives were minimal with levels of 0.1% and 0.07%, respectively. Elemental analysis also allowed for determination of the atomic ratio of H:C and O:C as these values are used in the construction of a Van Krevelen diagram, which provides an index of heating value (Ahmad and Subawi, Citation2013). The atomic H:C ratio for the organic cranberry pomace, blueberry pomace, cranberry ethanol extractives, and blueberry ethanol extractives was 1.62, 1.56, 1.65, and 1.86, respectively. The atomic O:C ratio for the organic cranberry pomace, blueberry pomace, cranberry ethanol extractives, and blueberry ethanol soluble extractives was 0.68, 0.65, 0.81, and 0.88, respectively. These values are comparable to that of biomass, such as wood and cellulose, which were reported to have an atomic H:C ratio of 1.4 and 1.7, respectively, and an atomic O:C ratio of 0.6 and 0.8, respectively (McKendry, Citation2002). With respect to these results and the high moisture content (64–68%) there is promise for berry pomace to be subjected to hydrothermal conversion technologies to increase the atomic H:C and O:C ratio and thereby enhance the heating value (Anouti et al., Citation2016; Yan et al., Citation2009, Citation2010).
Table 3. Ultimate analysis and mineral content of organic cranberry and blueberry pomace and ethanol soluble extractives.
Bioactives characterization
Mineral content
Minerals play an important role in numerous biochemical and physiological processes in the body and adequate intake of certain minerals relates to the prevention of some diseases (Mahood et al., Citation2012). The mineral content of organic cranberry and organic blueberry pomace along with the corresponding ethanol soluble extractives are presented in . For all minerals analyzed, except for potassium (K), the organic cranberry and organic blueberry pomaces presented significantly different levels of minerals and for all minerals analyzed, except for Ca, P, and Mn, the corresponding ethanol soluble extractives contained significantly different (p ≤ 0.05) levels of minerals. For calcium (Ca), the organic blueberry pomace contained at least five times more Ca (~0.25%) than the organic cranberry pomace, cranberry ethanol soluble extractives, and blueberry ethanol soluble extractives. The calcium content of whole wild (organic) frozen blueberries, raw blueberries (presumed non-organic), and cranberry (presumed non-organic) was reported by the USDA (Citation2016) to be 0.119%, 0.038%, and 0.063% (converted to be reported on a dry basis). These results indicate the organic blueberries contain significant amounts of Ca. The magnesium (Mg) levels ranged from 0.004% to 0.04% with the highest amounts being measured in the cranberry pomace. The magnesium content of whole wild (organic) frozen blueberries, raw blueberries (presumed non-organic), and cranberry (presumed non-organic) was reported by the USDA (Citation2016) to be 0.049%, 0.038%, and 0.047% (converted to be reported on a dry basis). The blueberry ethanol soluble extractives contained ~0.09% potassium, which was substantially lower compared to the levels measured in the other samples (0.212–0.246%). The potassium content of whole wild (organic) frozen blueberries, raw blueberries (presumed non-organic), and cranberry (presumed non-organic) was reported by the USDA (Citation2016) to be 0.48%, 0.48%, and 0.63% (converted to be reported on a dry basis). The phosphorus (P) levels in the organic cranberry and blueberry pomace (0.135% and 0.147%, respectively) were slightly higher than levels detected in the corresponding ethanol soluble extractives (0.097% and 0.094%, respectively). The organic blueberry pomace contained boron (B), zinc (Zn), and iron (Fe) in the highest levels of 11.088, 10.418, and 20.663 ppm, respectively, compared to the organic cranberry pomace samples, which presented 6.528, 6.212, and 15.479 ppm of B, Zn, and Fe, respectively. The iron content of whole wild (organic) frozen blueberries, raw blueberries (presumed non-organic), and cranberry (presumed non-organic) was reported by the USDA (Citation2016) to be 40.85, 17.73, and 18.14 ppm (converted to be reported on a dry basis). The zinc content of whole wild (organic) frozen blueberries, raw blueberries (presumed non-organic), and cranberry (presumed non-organic) was reported by the USDA (Citation2016) to be 47.2, 10.13, and 7.1 ppm (converted to be reported on a dry basis). The organic cranberry and blueberry ethanol soluble extractives contained lower amounts of boron (1.017 and 2.078 ppm), zinc (2.735 and 2.160 ppm), and iron (3.124 and 7.209 ppm), respectively. The blueberry pomace contained remarkably high amounts of manganese (Mn) with ~291 ppm being measured. This was nearly 15 times higher than the level determined for the cranberry pomace (~19 ppm). The organic blueberry ethanol soluble extractives did contain more manganese (~11 ppm) than the organic cranberry ethanol soluble extractives (~5 ppm). Only the manganese content for raw blueberries (presumed non-organic) was reported by the USDA (Citation2016) as 21.28 ppm (converted to be reported on a dry basis). Due to the very high levels of Mn measured in the organic blueberry pomace, non-organic blueberry pomace from the British Columbia lower mainland was obtained and Mn levels were measured. Pomace from non-organically grown blueberries from the British Columbia lower mainland was determined to have an Mn level of 27.9 ppm (not shown in ). The results seem to indicate that manganese is higher in organically grown low bush blueberries compared to non-organic high bush blueberries. From a health perspective, manganese is important for bone health and serving as a co-enzyme to assist metabolic activity in the human body (Health Canada, Citation1979). Copper (Cu) was the only mineral that was present in greater amounts in the cranberry and blueberry ethanol soluble extractives (27.82 and 24.18 ppm, respectively) compared to the corresponding cranberry and blueberry pomaces (5.376 and 7.703 ppm, respectively). Overall, mineral composition of fruit materials depends on species, cultivars, and growing conditions (soil, weather conditions, and geographic region; Mahood et al., Citation2012), which may explain these differences in levels of minerals.
Phenolics content
The phenolics content of the organic cranberry and organic blueberry pomace along with the corresponding ethanol soluble extractives are presented in . The total phenolics content was determined using both the Folin-Ciocalteu and Glories methods, which are both based on colorimetric reactions and are widely used UV/VIS spectrophotometric methods (Blainski et al., Citation2013). While both the Folin-Ciocalteu and Glories methods provide measurements of total phenolics, the Glories method allows for the determination of levels of specific types of phenolic compounds, tartaric esters, flavonols, and anthocyanins, by measuring absorbance values at different wavelengths: 320, 360, and 520 nm, respectively. Using the Folin-Ciocalteu method the organic blueberry pomace contained significantly higher levels of total phenolics (~31 mg gallic acid equivalents/g) compared to the organic cranberry pomace (~25 mg gallic acid equivalents/g). Although the values of total phenolic determined using the Glories method were not the same as those obtained for total phenolics using the Folin Ciocalteu method, the same trend was observed with total phenolics levels obtained using the Glories methods for organic blueberry and cranberry pomace being reported as approximately 24 and 13 mg gallic acid equivalents/g, respectively. Although the total phenolics values determined for the ethanol extractive samples were significantly higher compared to values measured in the pomace samples, the same trend was observed with total phenolics levels of approximately 72 and 54 mg gallic acid equivalents/g for the organic blueberry and cranberry ethanol soluble extractives, respectively, being determined using the Folin-Ciocalteu method and approximately 56 and 36 mg gallic acid equivalents/g for the organic blueberry and cranberry ethanol soluble extractives, respectively, being determined using the Glories method. With respect to the levels of tartaric esters, flavonols, and anthocyanins, the organic cranberry pomace, blueberry pomace, cranberry ethanol extractives, and blueberry ethanol extractives all contained significantly different levels of these compounds yet the levels of these values followed the same trend of the total phenolics. The organic blueberry ethanol soluble extractives contained the highest amounts of tartaric esters (15.03 mg caffeic acid eq/g), flavonols (18.34 mg quercetin eq/g), and anthocyanins (38.53 mg cyaniding-3-glucoside eq/g), while the organic cranberry ethanol soluble extractives contained the second highest amounts of tartaric esters (10.29 mg caffeic acid eq/g), flavonols (11.74 mg quercetin eq/g), and anthocyanins (11.14 mg cyaniding-3-glucoside eq/g). The organic blueberry and cranberry pomace samples contained 5.35 and 2.77 mg caffeic acid eq/g of tartaric esters, 6.17 and 3.08 mg quercetin eq/g of flavonols, and 17.41 and 4.46 mg cyaniding-3-glucoside eq/g anthocyanins, respectively. Harrison et al. (Citation2013) reported data on the phenolics content, tartaric esters, flavonols, and anthocyanins as determined with the Glories method for an ethanol extract obtained from non-organic cranberry pomace. The results of the current work are in agreement with values provided by Harrison et al. (Citation2013) except for the total phenolics content, which was nearly 10 times higher. Interestingly, the work by Harrison et al. (Citation2013) also noted that the phenolic content of the cranberry juice examined in their work was higher than previously reported in the literature. Laroze et al. (Citation2010) examined the extraction of phenolic compounds from commercially obtained blueberry, cranberry, and raspberry pomace using conventional extraction with methanol on a laboratory scale. For an extraction time of 1 h and a particle size of ≤1 mm, which was comparable to the extraction time and substrate particle size used in this work, they reported total phenolics content of the extract, using the Folin Ciocalteu method, to be 10 g gallic acid eq./100 g extract for both the blueberry and cranberry extracts. The phenolics content of the organic blueberry and cranberry extracts obtained from the present work reported on a per 100 g extract basis were 7.2 and 5.4 gallic acid eq./100 g extract, respectively.
Table 4. Phenolic composition and antioxidant activity of organic cranberry and blueberry pomace and ethanol soluble extractives.*
Tannin content
The tannin content of the samples is presented in . The levels of tannins in the samples followed the same trend as the total phenolics levels. The organic blueberry ethanol extractives contained the highest levels of tannins (58.78 mg gallic acid eq/g), which accounted for ~82% of the phenolic compounds measured. The organic cranberry ethanol extractives contained 48.09 mg gallic acid eq/g, which accounted for ~89% of the phenolic compounds determined. The organic blueberry and cranberry pomace contained tannins at levels of 24.24 and 21.86 mg gallic acid eq/g, which accounted for approximately 78% and 88% of the phenolic compounds present, respectively. Although the levels of tannins are highest in the blueberry samples compared to respective cranberry samples, the percentage values of the tannins is lower in the blueberry samples compared to the respective cranberry samples. This implies that there are relatively more tannins present in the cranberry samples compared to the blueberry samples. Tannins are typically classified as hydrolyzable tannins or condensed tannins. Hydrolyzable tannins and most condensed tannins are water soluble (Ashok and Upadhyay, Citation2012) and the measurement of tannin content is important as tannins have been implicated as having anti-nutritional properties in terms of decreasing growth, net metabolizable energy, protein digestibility, and iron absorption (Ashok and Upadhyay, Citation2012; Chung et al., Citation1998). However, reports have shown that tannins possess beneficial properties, such as antioxidant, anticarcinogenic, antimutagenic, antihemorrhoidal, immunomodulating antimicrobial activities along with blood clot promoting activity (Ashok and Upadhyay, Citation2012; Chung et al., Citation1998).
Antioxidant activity
Samples of the antioxidant activity levels, with values generated by both the ABTS and FRAP methods, are presented in . Antioxidant activity reduces oxidative stress, which has been implicated in the origin of many diseases and conditions, including atherosclerosis, diabetes, stroke, arthritis, chronic inflammation, cancer, and aging (Willcox et al., Citation2004). Therefore, assessment of antioxidant activity levels will demonstrate the utility of berry pomace as materials for developing novel products with potential health benefits. For all samples, the antioxidant activity values obtained using the ABTS method were at least 1.3 times higher than the antioxidant activity values obtained using the FRAP method, however, the trend was the same for both methods. The antioxidant activity levels determined for the organic blueberry and cranberry ethanol soluble extractives were the highest (p ≤ 0.05), with values of approximately 469 and 307 µmol/Trolox eq. per g being measured with the ABTS method and values of approximately 372 and 244 µmol/Trolox eq. per g being measured with the FRAP method, respectively. The antioxidant activity levels determined for the organic blueberry and cranberry pomace were determined to be approximately 222 and 144 µmol/Trolox eq. per g being measured with the ABTS method and values of approximately 157 and 105 µmol/Trolox eq. per g being measured with the FRAP method, respectively. The organic blueberry ethanol soluble extractives and organic blueberry pomace samples demonstrated higher levels of antioxidant activity (p ≤ 0.05) compared to the corresponding organic cranberry ethanol soluble extractives and organic cranberry pomace samples. The results for antioxidant activity levels followed the same trend as total phenolics data. It has been reported that there is a positive relationship between total phenolics content and antioxidant activity (Nagarajaiah and Prakash, Citation2016). Also, results for antioxidant activity as determined with ABTS for the organic blueberry pomace were in agreement with the results of pomace obtained from Rabbiteye blueberry, which was reported as ~127 uM Trolox eq. per g (Reque et al., Citation2014).
Anthocyanins: Identification and quantification of compounds
provides a summary of the anthocyanins present in the organic cranberry and blueberry pomace and ethanol soluble extractives as determined by HPLC. Anthocyanins identified from peaks from HPLC data followed by values in parentheses are retention times of the anthocyanin standards that were run to confirm peak identification. – show representative HPLC chromatograms for the organic cranberry and blueberry pomace and ethanol soluble extractive samples. The peaks without standards were tentatively identified based on chromatograms in the literature. The work of Lee (Citation2013) and Chang et al. (Citation2011) were used to determine other anthocyanins present in the organic cranberry based samples and the work of Kalt et al. (Citation1999) and Gao and Mazza (Citation1994) were used to determine the anthocyanins present in the organic blueberry-based samples. For the organic blueberry-based samples, the following anthocyanin compounds were detected and quantified: Del 3-gal (Delphinidin 3-galactoside); Del 3-glu (Delphinidin 3-glucoside); Cy 3-gal (Cyanidin 3-galactoside); Del 3-ara (Delphinidin 3-arabinoside); Cy 3-glu (Cyanidin 3-glucoside); Pet 3-gal (Petunidin 3-galactoside); Cy 3-ara (Cyanidin 3-arabinoside); Pet 3-glu (Petunidin 3-glucoside); Peo 3-gal (Peonidin 3-galactoside); Pet 3-ara (Petunidin 3-arabinoside); Peo 3-glu (Peonidin 3-glucoside); Mal 3-gal (Malvidin 3-galactoside); Mal 3-glu (Malvidin 3-glucoside); Peo 3-ara (Peonidin 3-arabinoside); and Mal 3-ara (Malvidin 3-arabinoside). For the organic cranberry-based samples, the same anthocyanins were determined except Del 3-glu, Pet 3-glu, and Mal 3-glu were not detected in these samples. Results indicate that there were at least two peaks that contained anthocyanins that were co-eluting. From the works of Lee (Citation2013), Chang et al. (Citation2011), Kalt et al. (Citation1999), and Gao and Mazza (Citation1994) it was deduced that Cy 3-gal and Del 3-ara co-eluted with a retention time around 9.7 min and Peo 3-glu and Mal 3-gal co-eluted with a retention time around 11.4 min. It should also be noted that Reque et al. (Citation2014) reported that malvidin 3-glucoside co-eluted with delphinidin aglycone and cyanidin 3-glucoside co-eluted with malvidin 3,5-diglycoside. Co-elution has been reported to be common in reverse phase HPLC and due to the complex nature of anthocyanins, analysis with Liquid Chromatography-Mass Spectrometry (LC-MS) is required to detect and ascertain the identity of the compounds (Nicoué et al., Citation2007; Reque et al., Citation2014).
Table 5. Anthocyanins of organic cranberry and blueberry pomace and ethanol soluble extractives.
Figure 1. Representative HPLC chromatogram for the: organic blueberry pomace (A); organic blueberry ethanol soluble extractives (B); organic cranberry pomace (C); and organic cranberry ethanol soluble extractives (D). Peak numbers and corresponding anthocyanin identities are defined in .
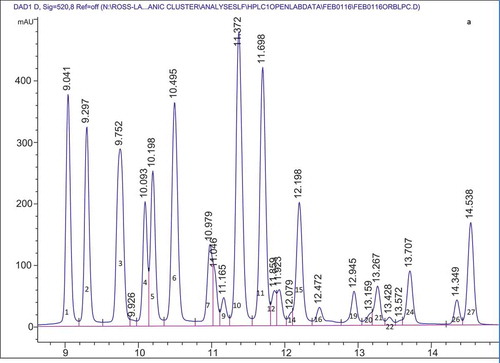
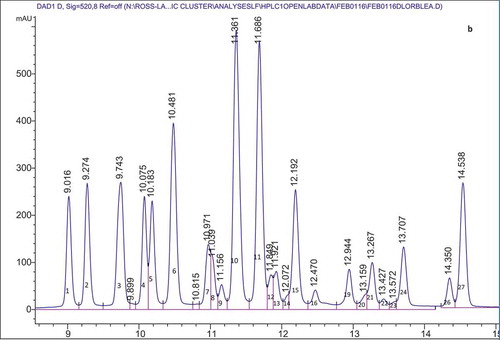
Figure 1. (Continued).
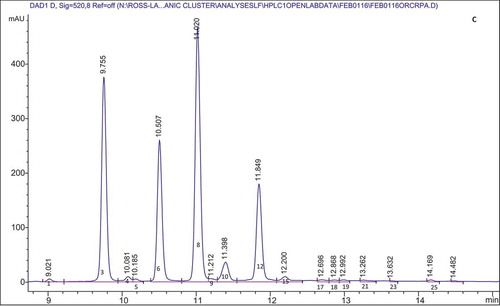
Figure 1. (Continued).
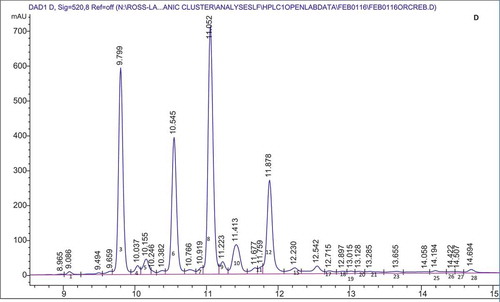
Anthocyanins comprising ≥5% of the total anthocyanins were the same in the organic blueberry 80% ethanol extractives and organic blueberry pomace samples, namely, Del 3-gal, Del 3-glu, Cy 3-gal/Del 3-ara, Pet 3-gal, Cy 3-ara, Peo 3-glu/Mal 3-gal, Mal 3-glu, and Mal 3-ara. Of these anthocyanins Peo 3-glu/Mal 3-gal, Mal 3-glu, and Cy 3-ara were present in the greatest proportion: 13.82–14.62%, 11.40–13.13%, and 9.74–10.36%, respectively. Most of the anthocyanins comprising ≥5% of the total anthocyanins were the same in the organic cranberry 80% ethanol extractives and cranberry pomace samples, namely, Peo 3-gal, Cy 3-gal/Del 3-ara, Cy 3-ara, Peo 3-glu/Mal-3 gal, and Peo-3 ara. It should be noted that Peo 3-glu/Mal-3 gal was the exception and present in the organic cranberry pomace samples at a level of <5% (3.53%) total anthocyanins. Of the main anthocyanins, Peo 3-gal, Cy 3-gal/Del 3-ara, Cy 3-ara, and Peo-3 ara were present in the greatest proportion: 29.71–33.24%, 22.13–25.31%, 15.80–17.90%, and 12.34–14.26%, respectively.
For the Cy 3-gal/Del 3-ara peak, by comparing against the external standard (Cy 3-gal) it was determined that for the organic blueberry samples the peak contained equal amounts of Cy 3-gal/Del 3-ara and peak for the organic cranberry sample mainly contained Cy 3-gal. For the Peo 3-glu/Mal 3-gal peak, by comparing against the external standard (Peo 3-glu) it was determined that for the organic blueberry-based samples the peak contains a proportion of Peo 3-glu and for organic cranberry-based samples the peak only contains Peo 3-glu. Unidentified peaks were present in the samples (Unknown A-O), and from the literature (Gao and Mazza, Citation1994; Kalt et al., Citation1999) it is possible that these peaks are acetylated anthocyanins. However, there were no standards for acetylated anthocyanins and the peaks that may be acetylated were termed unknown and noted with a number. Again, analysis with LC-MS is required to detect and ascertain the identity of the compounds (Nicoue et al., Citation2007; Reque et al., Citation2014).
Overall, for both the organic blueberry and cranberry samples, the 80% ethanol extractives contained nearly two times more anthocyanins than the pomace samples. The total anthocyanin content of the blueberry and cranberry 80% ethanol extractives was 37.6 and 9.27 mg/g (dry weight basis), respectively. The total anthocyanin content of the organic blueberry and cranberry pomace was 16.08 and 4.75 mg/g (dry weight basis), respectively. These results are in agreement with the literature as Reque et al. (Citation2014) reported that the total anthocyanin content of Rabbiteye blueberry (organic) pomace was ~15.7 mg/g (dry weight basis), which is a comparable value while White et al (Citation2010) reported that the total anthocyanin content of non-organic cranberry pomace ranged from 1.2–3.6 mg/g (dry weight basis), which is a lower level. Results from the present work and literature indicate that organically produced berries and consequently berry pomace have higher anthocyanin content than non-organic berries and pomace (Reque et al., Citation2014; Wang et al., Citation2008; White et al., Citation2010). Moreover, both the organic blueberry 80% ethanol extractives and blueberry pomace samples contained more anthocyanins than the corresponding organic cranberry 80% ethanol extractives and cranberry pomace samples (4.06 times and 3.38 times, respectively).
Conclusions
Pomace, a waste product of fruit processing, represents a resource for use as novel value-added organic products. The chemical composition and bioactive content of pilot scale processed Canadian organic cranberry and blueberry pomace and phenolic-enriched extracts was determined. Juice pressing of organic cranberries and blueberries yielded 14.47% and 14.14% pomace, respectively, and yields of phenolic enriched 80% ethanol soluble extractives obtained from the organic cranberry and blueberry pomace were 4.83% and 5.3%, respectively. The organic blueberry and cranberry pomace and corresponding phenolic enriched 80% ethanol soluble extractives all exhibited good levels of total phenolics, anthocyanins, and antioxidant activity, while levels of bioactives were higher in the phenolic enriched 80% ethanol soluble extractives compared to the pomace samples. Also, the organic blueberry pomace and 80% ethanol soluble extractive samples contained higher bioactive potential compared to corresponding organic cranberry samples. From this it can be noted that blueberry and cranberry pomace represent a source for phenolic compounds that may find use as functional food ingredients or as antimicrobial agents in food, pharmaceutical, and animal food industries. Proximate analysis of organic berry pomaces showed that they were a good source of protein. Mineral and elemental analysis of the organic berry pomace and 80% ethanol soluble extractives indicated that they were a good source of B, Zn, Fe, Mn, and Cu with the organic blueberry pomace presenting higher levels of Ca and Mn. As such, these organic berry pomaces may find use as human food and animal feed ingredients. Elemental analysis allowed for determination of the atomic ratio of H:C and O:C for the organic pomace and ethanol soluble extractives and the values obtained were comparable to that of biomass, such as wood and cellulose, which indicates there is promise for berry pomace to be subjected to thermal conversion technologies to enhance the heating value for use as a potential energy source and/or biochar. Overall, this work provides information necessary to facilitate utilization of organic berry pomace as a resource for the production of novel value-added organic products.
Funding
This work was supported by Agriculture and Agri-Food Canada under Canada’s Organic Science Cluster II.
Additional information
Funding
Literature cited
- AAFC. 2008. Crop profile for cranberry in Canada. AAFC No. 10803E. Agriculture and Agri-Food Canada, Ottawa, ON, Canada.
- AAFC. 2011. Canadian blueberries: A true taste of nature. AAFC No. 11509E. Agriculture and Agri-Food Canada, Ottawa, ON, Canada.
- AAFC. 2012. Statistical overview of the Canadian blueberry industry, 2010. AAFC No. 11743E. Agriculture and Agri-Food Canada, Ottawa, ON, Canada.
- Ahmad, M., and H. Subawi. 2013. New Van Krevelen diagram and its correlation with the heating value of biomass. Res. J. Agr. Environ. Manage. 2(10):295–301.
- Ajila, C.M., S.K. Brar, M. Verma, R.D. Tyagi, S. Godbout, and J.R. Valero. 2011. Extraction and analysis of polyphenols: recent trends. Crit. Rev. Biotechnol. 31:227–249.
- Anouti, S., G. Haarlemmer, M. Déniel, and A. Roubaud. 2016. Analysis of physicochemical properties of bio-oil from hydrothermal liquefaction of blackcurrant pomace. Energy Fuels 30:398−406.
- Ashok, P.K., and K. Upadhyay. 2012. Tannins are astringent. J. Pharmacogn. Phytochem. 1(3):45–50.
- Association of Official Analytical Chemists International (AOAC). 2005. Official method 2005.08. In: Official methods of analysis (18th ed.). AOAC, Gaithersburg, MD.
- Bhushan, S., K. Kalia, M. Sharma, B. Singh, and P.S. Ahuja. 2008. Processing of apple pomace for bioactive molecules. Crit. Rev. Biotechnol. 28(4):285–296
- Biswas, D., N.E. Wideman, C.A. O’Bryan, A. Muthaiyan. J.M. Lingbeck, P.G. Crandall, and S.C. Ricke. 2012. Pasteurized blueberry (Vaccinium corymbosum) juice inhibits growth of bacterial pathogens in milk but allows survival of probiotic bacteria. J. Food Saf. 32:204–209.
- Blainski, A., G.C. Lopes, and J.C. Palazzo de Mello. 2013. Application and analysis of the Folin Ciocalteu method for the determination of the total phenolic content from Limonium brasiliense L. Molecules 18:6852–6865.
- British Columbia Cranberry Marketing Commission. 2011. The British Columbia Cranberry Marketing Commission 2011–2016 Strategic Plan. StratPoint Solutions, Vernon, BC, Canada.
- Bunea, A., D. Rugina, Z. Sconta, R.M. Pop, A. Pintea, C. Socaciu, F. Tăbăran, C. Grootaert, K. Struijs, and J. Van Camp. 2013. Anthocyanin determination in blueberry extracts from various cultivars and their antiproliferative and apoptotic properties in B16–F10 metastatic murine melanoma cells. Phytochemistry 95:436–444.
- Cavanagh, H.M.A., M. Hipwell, and J.M. Wilkinson. 2003. Antibacterial activity of berry fruits used for culinary purposes. J. Med. Food 6:57–61.
- Chang, C.W-J., A.Z. Tulio, Jr., J. Jablonski, A. Kangath, K. Sandhya, I. Edirisinghe, R.K. Tadapaneni, K. White, B. Burton-Freeman, and L.S. Jackson. 2011. Effects of wild blueberry and cranberry fruit extracts on endothelial cell function. 5 May 2016. <http://sciencemission.com/site/index.php?page=news&type=view&id=posters%2Feffects-of-wild>.
- Chung, K-T., T.Y. Wong, C.-I. Wei, Y.-W. Huang, and Y. Lin. 1998. Tannins and human health: A review. Crit. Rev. Food Sci. 38(6):421–464.
- Djilas, S., J. Canadanovic-Brunet, and G. Cetkovic. 2009. By-products of fruits processing as a source of phytochemicals. Chem. Ind. Chem. Eng. Q. 15(4):191–202.
- Donahue, C.J., and E.A. Rais. 2009. Proximate analysis of coal. J. Chem. Educ. 86(2):222–224.
- Espin, J.C., M.T. Garcia-Conesa, and F.A. Tomas-Barberan. 2007. Nutraceuticals: Facts and fiction. Phytochemistry 68:2986–3008.
- Forney, C.F., W. Kalt, M.A. Jordan, M.R. Vinqvist-Tymchuk, and S.A.E. Fillmore. 2012. Blueberry and cranberry fruit composition during development. J. Berry Res. 2:169–177.
- Gassara, F., S.K. Brar, R.D. Tyagi, R.P. John, M. Verma, and J.R. Valero. 2011. Parameter optimization for production of ligninolytic enzymes using agro-industrial wastes by response surface method. Biotechnol. Bioprocess. Eng. 16:343−351.
- Gao, L., and G. Mazza. 1994. Quantitation and distribution of simple and acylated anthocyanins and other phenolics in blueberries. J. Food Sci. 59:1057–1059.
- Gross, M. 2004. Flavonoids and cardiovascular disease. Pharm. Biol. 42(Suppl. 1):21–35.
- Harrison, J.E., B.D. Oomah, M.S. Diarra, and C. Ibarra-Alvarado. 2013. Bioactivities of pilot scale extracted cranberry juice and pomace. J. Food Process. Preserv. 37:356–365.
- Health Canada. 1979. Guidelines for Canadian drinking water quality: Guideline technical document—Manganese. 5 May 2016. <http://healthycanadians.gc.ca/publications/healthy-living-vie-saine/water-manganese-eau/index-eng.php>.
- Kalderis, D., M.S. Kotti, A. Méndez, and G. Gascó. 2014. Characterization of hydrochars produced by hydrothermal carbonization of rice husk. Solid Earth 5:477–483.
- Kalt, W., and J.E. McDonald. 1996. Chemical composition of lowbush blueberry cultivars. J. Am. Soc. Hort. Sci. 121(1):142–146.
- Kalt, W., J.E. McDonald, R.D. Ricker, and X. Lu. 1999. Anthocyanin content and profile within and among blueberry species. Canadian J. Plant Sci. 79(4):617–623.
- Kretzschmar, J., S. Majer, and M. Kroeger. 2012. International overview on waste to biofuel options with a focus on waste potentials in Germany and funding incentives in the EC. Global NEST J. 14(2):183–191.
- Laroze, L.E., B.D. Díaz-Reinoso, A. Moure, M.E. Zuniga, and H. Dominguez. 2010. Extraction of antioxidants from several berries pressing wastes using conventional and supercritical solvents. Eur. Food Res. Technol. 231:669–677.
- Lee, J. 2013. Proanthocyanidin A2 purification and quantification of American cranberry (Vaccinium macrocarpon Ait.) products. J. Funct. Foods 5:144–153.
- Libra, J.A., S.R. Kyoung, C. Kammann, A. Funke, N.D. Berge, Y. Neubauer, M.-M. Titirici, C. Fühner, O. Bens, J. Kern, and K.H. Emmerich. 2011. Hydrothermal carbonization of biomass residuals: a comparative review of the chemistry, processes and applications of wet and dry pyrolysis. Biofuels 2(1):89–124.
- Liu, G., R. Mylavarapu, E. Hanlon, and W.C. Lee. 2014. Soil pH management for optimum commercial fruit production in Florida. 5 May 2016. <http://edis.ifas.ufl.edu/hs1234>.
- Mahood, T., F. Anwar, T. Iqbal, I.A. Bhatti, and M. Ashraf. 2012. Mineral composition of strawberry, mulberry, and cherry fruits at different ripening stages as analyzed by inductively coupled plasma-optical emission spectroscopy. J. Plant Nutr. 35(1):111–122.
- Marshal Ingredients. 2016. Dried Blueberry Fiber. 5 May 2016. <http://www.marshallingredients.com/blueberry-fiber>.
- Mateos-Aparicio, I., C. Mateos-Peinado, A. Jimenez-Escrig, and P. Ruperez. 2010. Multifunctional antioxidant activity of polysaccharide fractions from the soybean by-product Okara. Carbohydr. Polym. 82:245–250.
- McKendry, P. 2002. Energy production from biomass (part 1): Overview of biomass. Bioresour. Technol. 83:37–46.
- Nagarajaiah, S.B., and J. Prakash. 2016. Chemical composition and bioactivity of pomace from selected fruits. Intl. J. Fruit Sci. 16(4):423–443. DOI: 10.1080/15538362.2016.1143433.
- Nicoué, E.E., S. Savard, and K. Belkacemi. 2007. Anthocyanins in wild blueberries of Quebec: Extraction and identification. J. Agr. Food Chem. 55(14):5626–5635.
- Nohynek, L.J., H.L. Alakomi, M.P. Kähkönen, M. Heinonen, I.M. Helander, K.M. Oksman-Caldentey, and R.H. Puupponen-Pimiä. 2006. Berry phenolics: Antimicrobial properties and mechanisms of action against severe human pathogens. Nutr. Cancer 54:18–32.
- Reque, P.M., R.S. Steffens, A. Martins Da Silva, A. Jablonski, S.H. Flores, A.O. Rios, and E. Vogt de Jong. 2014. Characterization of blueberry fruits (Vaccinium spp.) and derived products. Food Sci. Technol. Campinas 34(4):773–779.
- Ross, K.A., and D. Godfrey. 2012. Effect of extractives on the thermal decomposition of wheat, triticale, and flax crop residues: A kinetic study. Intl. J. Biomass Renewables 1(1):19–31.
- Ross, K.A., L. Zhang, and S.D. Arntfield. 2010. Understanding water uptake from changes induced during processing: chemistry of pinto and navy bean seed coats. Intl. J. Food Prop. 13(3):631–647.
- Routray, W., and V. Orsat. 2011. Blueberries and their anthocyanins: Factors affecting biosynthesis and properties. Compr. Rev. Food Sci. Food Saf. 10:303–320.
- SARE. 2014. Berry soil and nutrient management—A guide for educators and growers. Northeast Sustainable Agriculture Research and Education. Cornell University, Ithaca, NY, USA.
- Shen, D.K., S. Gu, K.H. Luo, S.R. Wang, and M.X. Fang. 2010. The pyrolytic degradation of wood-derived lignin from pulping process. Bioresour. Technol. 101:6136–6146.
- Singleton, V.L., and J.A. Rossi. 1965. Colorimetry of total phenolics with phosphomolybdic–phosphotungstic acid reagents. Amer. J. Enol. Vitic. 16:144–158.
- Soto, M.L., E. Conde, N. González-López, M.J. Conde, A. Moure, J. Sineiro, E. Falqué, H. Domínguez, M.J. Núñez, and J. Carlos Parajó. 2012. Recovery and concentration of antioxidants from winery wastes. Molecules 17:3008–3024.
- USDA. 2016. 28. 5 May 2016. <https://ndb.nal.usda.gov/ndb/foods>.
- Vattem, D., Y. Lin, R. Labbe, and K. Shetty. 2004. Antimicrobial activity against select food-borne pathogens by phenolic antioxidants enriched in cranberry pomace by solid-state bioprocessing using the food grade fungus Rhizopus oligosporus. Process Biochem. 39: 1939–1946.
- Velioglu, Y.S., G. Mazza, L. Gao, and B.D. Oomah. 1998. Antioxidant activity and total phenolics in selected fruits, vegetables, and grain products. J. Agr. Food Chem. 46:4113–4117.
- Wang, S.Y., C.T. Chen, W. Sciarappa, C.Y. Wang, and M.J. Camp. 2008. Fruit quality, antioxidant capacity, and flavonoid content of organically and conventionally grown blueberries. J. Agr. Food Chem. 56(14):5788–5794.
- White, B.L., L.R. Howard, and R.L. Prior. 2010. Proximate and polyphenolic characterization of cranberry pomace. J. Agr. Food Chem. 58(7):4030–4036.
- Willcox, J.K., S.L. Ash, and G.L. Catigani. 2004. Antioxidants and prevention of chronic disease. Crit. Rev. Food Sci. 44(4):275–295.
- Winsley, P. 2007. Biochar and bioenergy production for climate change. New Zealand Sci. Rev. 64(1):5–10.
- Worthington, V. 2001. Nutritional quality of organic versus conventional fruits, vegetables, and grains. J. Altern. Complem. Med. 7:161–173.
- Yan, W., J.T. Hastings, T.C. Acharjee, C.J. Coronella, and V.R. Vasquez. 2010. Mass and energy balances of wet torrefaction of lignocellulosic biomass. Energy Fuels 24:4738–4742.
- Yan, W., T.C. Acharjee, C.J. Coronella, and V.R. Vasquez. 2009. Thermal pretreatment of lignocellulosic biomass. Environ. Prog. Sustainable Energy. 28(3):435–440.