
 ?Mathematical formulae have been encoded as MathML and are displayed in this HTML version using MathJax in order to improve their display. Uncheck the box to turn MathJax off. This feature requires Javascript. Click on a formula to zoom.
ABSTRACT
Cell-fate networks are traditionally studied within the framework of gene regulatory networks. This paradigm considers only interactions of genes through expressed transcription factors and does not incorporate chromatin modification processes. This paper introduces a mathematical model that seamlessly combines gene regulatory networks and DNA methylation (DNAm), with the goal of quantitatively characterizing the contribution of epigenetic regulation to gene silencing. The ‘Basin of Attraction percentage’ is introduced as a metric to quantify gene silencing abilities. As a case study, a computational and theoretical analysis is carried out for a model of the pluripotent stem cell circuit as well as a simplified self-activating gene model. The results confirm that the methodology quantitatively captures the key role that DNAm plays in enhancing the stability of the silenced gene state.
Introduction
Cell-fate determination in developmental biology is a multi-step biological process in which cellular functions are modified or specialized, ultimately resulting in a differentiated or proliferative state. A central role in this process is played by the dynamics of a core network of genes, often referred to as a cell-fate network (CFN). The expression levels of these genes can trigger a cascade of events that determine, in principle irreversibly, the fate of a given cell along a specific lineage. The metaphor of marbles rolling down a hill whose shape is shaped by a CFN (the Waddington landscape [Citation1,Citation2]) provides a way to visualize this process. Well-known examples of CFNs are the PU.1/GATA.1 gene regulatory network in haematopoietic progenitors [Citation3,Citation4], the pluripotent stem cell network [Citation4,Citation5], and a circuit including SNAIL, miR-34, ZEB1, and miR-200 that regulates epithelial-mesenchymal transitions in tumour metastasis [Citation6].
Phenotypes associated to CFNs had classically been seen as irreversible. However, in their pioneering work [Citation7], Takahashi and Yamanaka artificially induced a pluripotent state in mouse somatic cells through a process of overexpression of Oct3/4, Sox2, c-Myc, and Klf4. This success notwithstanding, simply overexpressing genes has been experimentally found to be grossly inefficient [Citation8]. Hence, there has been a great interest in obtaining a quantitative theoretical understanding of CFNs in order to guide the process of reprogramming and increase its efficiency [Citation9,Citation10]. Such a quantitative understanding could have a huge impact in the field of regenerative medicine and stem cell therapy [Citation11,Citation12].
Traditionally, CFNs have been modelled within the wider theoretical framework of Gene Regulatory Networks (GRNs) [Citation13,Citation14]. A GRN is defined as a set of genes, each expressing a protein. The expressed proteins can act as Transcription Factors (TFs) by binding to the various promoters in the network to inhibit or enhance expression of the corresponding genes [Citation15,Citation16]. When used to model a CFN, a GRN must be able to display multistability. This means that the long-term expression levels of genes can settle on multiple distinct steady state attractors, each corresponding to a distinct cell lineage. A well-known multistable GRN is the toggle switch [Citation17] whose architecture consists of two mutually inhibiting genes. Similar architectures can also give rise to multistability and have been subject of great interest [Citation2].
Despite their versatility and variety of applications, GRN models of CFNs do not typically account for epigenetic effects, such as DNA methylation, histone modifications, or chromatin remodelling. There have been both theoretical [Citation18–20] and experimental [Citation21] works aiming at the understanding of how epigenetic regulation and gene regulation interact. It is well known that CFNs employ epigenetic regulation as a mechanism to ensure the irreversibility of the cell lineage [Citation22]. DNA methylation (DNAm), in particular, has been well studied in the context of developmental CFNs [Citation23]. DNAm at the transcriptional start sites (TSSs) is a highly heritable, hard to reverse, and robust silencer of genes [Citation24–26]. In comparison to its well-known silencing function at the regulatory regions, less is known about DNAm’s role at intragenic regions [Citation27].
In this work, we develop mathematical models of GRNs that incorporate DNAm at TSSs, and thus can quantitatively explain its effect on gene silencing. As a metric to quantify the gene silencing abilities of DNAm, we consider the shift in the stability boundary of the basin of attraction (BoA) of the silenced steady state. More precisely, we define the BoA percentage (BoAp) of a steady state as the volume fraction of a predetermined region of the state space that is occupied by the BoA. Equipped with this metric, one can then computationally and theoretically study the sensitivity of the BoAp to parameters such as DNAm rates or the time scale of DNAm.
We carry out this program computationally, illustrating it with a three-gene model of the pluripotent stem cell network, and quantifying how DNAm effectively increases the BoAp compared to a standard GRN. In addition, and in order to gain understanding, we also consider an ideal single self-activating gene, for which a more theoretical study is possible. We view our work as a first step towards integrating epigenetic mechanisms into the standard GRN paradigm studied in systems biology. Furthermore, we envision our model (and its derivatives) as computational guides uncovering the possible behaviours of a network and evaluating the feasibility of the interventions that can be used for regulation. For instance, as we will discuss later, the DNAm rate in our model is proportional to the abundance of DNMT, and hence our mathematical framework can quantitatively predict the effect of DNMT on the relative stability of the silenced (methylated) and active steady states. This would allow our model to function as a computational aid to design the reprogramming protocol in the context of the PSCC. We will elaborate further on the biological implications of our model in the Discussion section.
Basic biological concepts and definitions
DNA methylation as epigenetic regulation
DNAm is one of the main epigenetic regulation mechanisms studied in modern molecular cell biology. Methylation plays a crucial role [Citation28] in understanding the dynamics of gene silencing. It is associated with methylation of Cytosine-Phosphate-Guanine (CpG) islands, which are regions of DNA with a high G +C content and a high frequency of CpG dinucleotides relative to the bulk genome [Citation29]. Methylation of promoter regions directly affects TF-promoter binding kinetics, and is often associated with transcriptional repression [Citation24–26,Citation30].
The current understanding of the DNAm cycle is shown in . As depicted, cytosines at DNA promoter regions are initially methylated by DNA methyltransferase (DNMT) to become 5-methylcytosine (5mC). The methylated gene promoter is further oxidized to 5-Hydroxy Methylcytosine (5hmC). The oxidized form of the cytosine can further be oxidized by the TET protein into the 5fC and 5caC forms. The cycle closes by a TET/TDG (thymine DNA glycosylase)/BER (base excision repair)-dependent pathway that restores the unmodified cytosine state [Citation31,Citation32].
Figure 1. The DNA methylation cycle as currently understood [Citation31,Citation32]. (a) The TET-mediated cytosine DNA demethylation cycle starts with transferring a methyl group onto the C5 position of the cytosine to form 5-methylcytosine (5mC) by the DNA (cytosine-5)-methyltransferase (mainly DNMT3A/B for de novo methylation). The 5mC is then further iteratively oxidized by TET enzymes to form 5hmC, 5fC, and 5caC. The 5fC and 5caC are then recognized by TDG that yields an abasic site that is repaired by BER and returns to the unmodified cytosine state. (b) A simplified de-methylation cycle for Oct4 in the PSCC. Due to the fact that 5mC and 5hmC are two leading abundant oxidized forms of cytosine, we can effectively reduce the full cycle to a three state model
![Figure 1. The DNA methylation cycle as currently understood [Citation31,Citation32]. (a) The TET-mediated cytosine DNA demethylation cycle starts with transferring a methyl group onto the C5 position of the cytosine to form 5-methylcytosine (5mC) by the DNA (cytosine-5)-methyltransferase (mainly DNMT3A/B for de novo methylation). The 5mC is then further iteratively oxidized by TET enzymes to form 5hmC, 5fC, and 5caC. The 5fC and 5caC are then recognized by TDG that yields an abasic site that is repaired by BER and returns to the unmodified cytosine state. (b) A simplified de-methylation cycle for Oct4 in the PSCC. Due to the fact that 5mC and 5hmC are two leading abundant oxidized forms of cytosine, we can effectively reduce the full cycle to a three state model](/cms/asset/58e2fee3-147f-46b8-9629-7a7367b51ba2/kepi_a_1805686_f0001_oc.jpg)
Experiments have shown that hydroxymethylation and formylation are relatively stable cytosine modifications in genomic DNA of both dividing and nondividing cells [Citation33,Citation34]. The 5hmC and 5fC forms in this enzymatic oxidation process are observed to be comparatively longer lived, though still transient, states. Moreover, it also has been shown [Citation31] that the pool size of the transient oxidized cytosine 5hmC is significantly larger than the other forms of oxidized cytosines (5fC, 5caC). Therefore, in this work, we further simplify the DNA demethylation cycle to the cycle in ) which consists of just three major steps, which we will refer to as the ‘triangle topology.’ The cycle starts with an initial de novo methylation on the unbounded gene promoter, which is followed by a TET oxidization enzymatic process oxidizing 5mC to 5hmC. The last stage corresponds to a replication-dependent dilution bringing 5hmC back to the unbound promoter state.
The underlying DNAm dynamics is crucial for understanding how epigenetics regulates CFNs. DNAm plays a central role not only in early embryogenesis, but also in maintaining the correct pattern of methylation along DNA in somatic cells. As a model system of great interest, we review next how the pluripotent stem cell circuit (PSCC) is affected by the DNAm cycle.
The pluripotent stem cell circuit (PSCC)
Some of the key Transcription Factors (TFs) that are identified as being crucial to the PSCC include Nanog, Oct4, Sox2, Klf4, and the TET protein family [Citation7,Citation31]. Many of such TFs are ‘pioneering’ transcription factors that are able to bind directly to the condensed chromatin. According to the induction experiments in [Citation7], the overexpression of the aforementioned TFs can lead to the induction of the pluripotent state. For the PSCC, the role of each TF in the GRN has been extensively studied [Citation35]. Much research has been devoted to elucidating the interplay between the Nanog, Oct4 and TeT1 proteins [Citation36,Citation37]. Oct4 is central to the pluripotency machinery, has been very well studied [Citation38], and it can by itself reprogram a differentiated cell into pluripotency [Citation39]. Other experiments regarding the induction of the pluripotent state in PSCCs have highly heterogeneous results [Citation8,Citation40]. More recent research [Citation41,Citation42] has shown that, at a mechanistic level, Nanog is able to guide TET protein to bind to a particular region of the methylated region on the chromatin via the formation of a Nang-TET compound that is actively involved in the DNA demethylation process.
Notably, DNAm of the Oct4 gene plays a key role in the regulation of the PSCC. In Yamanaka’s lab early works [Citation7,Citation43], it was observed that the promoters of Oct4 (and other pluripotency-related genes) are unmethylated in embryonic stems (ES) cells, while they are methylated in mouse embryonic fibroblasts. Furthermore, it was observed that Oct4 becomes demethylated just prior to reprogramming [Citation44], and that the differentiation of ES cells is associated with the silencing of Oct4 and de novo methylation of its regulatory region [Citation45,Citation46]. Hence, activation of the PSCC requires demethylation of the corresponding promoters [Citation47], which means that understanding DNAm is a prerequisite of understanding the PSCC. However, very few mathematical models have incorporated DNAm in their GRNs. In this work, we model the interplay between epigenetic regulation via the Nanog-guided TET-mediated active demethylation cycle and the role of pioneering transcription factors such as Oct4 and Nanog. A mechanistic view of this interplay helps one understand how emergent cell states can arise phenotypically from the underlying genotypic level interaction. Although the full modelling of epigenetic regulation at the molecular level would involve many additional epigenetic regulation mechanisms beyond methylation such as histone modifications [Citation31], DNAm plays a major role in the coarse grained picture of the process of the induction of the pluripotent state which we are mostly interested in.
Basin of attraction percentage (BoAp)
Using high-dimensional attractors, and specifically stable steady states, to represent cell fates in the epigenetic landscape is a widely used paradigm for studying cell fate [Citation14,Citation48]. In a biological context, a steady state attractor corresponds to an observable phenotype, e.g., a somatic state with a silenced Oct4 promoter. In the dynamical cellular environment, perturbations can temporarily change the expression levels away from steady-state. Intuitively, the GRN should be able to return to its attractor (phenotype) for a sufficiently small perturbation, while there is a risk of jumping to another attractor (phenotype) for a large perturbation. By ‘perturbation’ we mean an abrupt change in the levels of the dynamical variables of interest such as TF abundances and DNAm levels. An attractor that can withstand a large perturbation is more ’stable’. Hence, to characterize the stability boundary of such attractors we use the concept of Basin of Attraction (BoA). The BoA of a given attractor (phenotype) is the set of all perturbed levels that will return back eventually to the steady state attractor. illustrates these ideas.
Figure 2. A detailed diagram of the PSCC network showing N, T, O interactions. TET, Oct4, Nanog denote the unbound genes. *TET and *Oct4 denote NT binding to the respective promoter sites, TET* and Oct4* denote Oct4 bound to the respective promoter sites, and *TET*, *Oct4* denote both NT and Oct4 binding to the respective promoter sites. The black dashed line indicates binding locations of the Nanog-guided TET protein complex NT, while the blue dashed line indicates binding locations of Oct4. The coloured shaded area emphasizes the DNA demethylation cycle
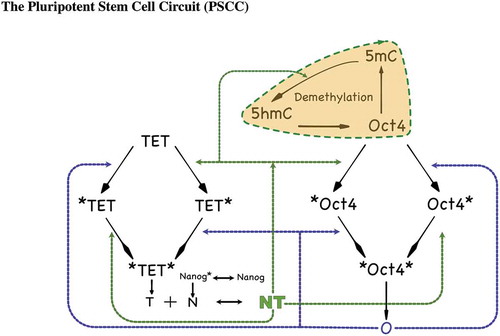
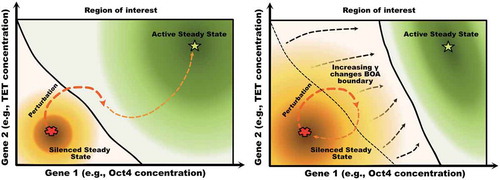
Figure 3. Graphical illustration of how a shift in the boundary separating two regions of attraction can result in phenotype switches under small perturbations. In the left panel, a perturbation of the silenced state leads to a transient configuration that belongs to the basin of attraction of the active steady state, resulting in a phenotype switch to the active steady state (i.e, the somatic state). In the right panel, the boundary has shifted, reflecting that fact that the relative sizes of the two basins of attraction have exchanged dominance. Now the same perturbation keeps the state in the domain of attraction of the silenced state, and the perturbed state eventually returns to that attractor. The shift in boundary could be due, for instance, to an increase in the methylation rate parameter
The concept of BoA has been frequently used by researchers and it is standard in dynamical systems when analysing multi-stable systems; moreover, it has recently been systematically used by the physics community in that context [Citation49]. In order to quantify the BoA of a given attractor, we propose to use the concept of BoA Percentage (BoAp), which is defined as the ratio of the ‘size’ of the BoA of interest to the total size of the space of interest. A larger BoAp for a given attractor means that its BoA is larger, and hence it is relatively more stable, while a smaller BoAp means that it is relatively less stable.
In our simulation analysis, we adopt this concept to quantify the stability boundary of the somatic cell state. In a bistable one-dimensional model, the BoAp of the smaller steady state can be defined as the distance between
and the unstable state relative to the length of a segment of interest. However, this is not an accurate measure for high-dimensional systems. Therefore, we adopt a volumetric definition for the BoA. We start by fixing a region of interest in the state space. With respect to such a region, BoAp can be defined as follows:
Equipped with this definition, we can study the effect of DNAm and demethylation constants on BoAp. The silenced steady state corresponds to a highly methylated promoter. Hence, as the methylation rate increases, the BoA of the silenced steady state expands. On the other hand, as the demethylation rate
increases, the BoA of the silenced steady state shrinks. Our subsequent results will show that the BoAp of the silenced steady state increases as the methylation rate increases, and decreases as demethylation rate increases. Note that we will use the term ‘steady state’ to mean a ‘steady state attractor’ from now on.
Results
The PSCC with epigenetic regulation
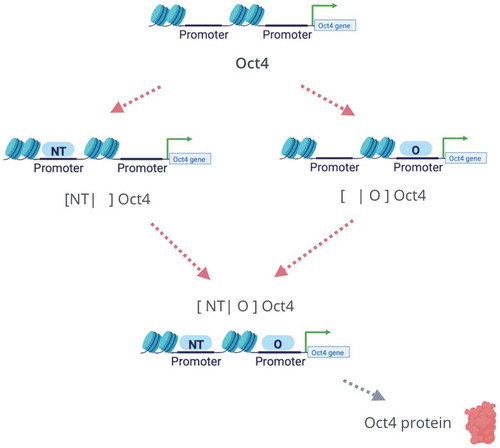
In our full model description of the PSCC, the network can be viewed as made up of two parts. The first part is the gene-TF regulatory network [Citation50] which is a core underlying network defining how TFs bind and unbind to DNA as shown in without the shaded area. The main regulatory sub-network for the activation of the Oct4 and Nanog genes is depicted within the two-pathway activation scheme in . Both the Oct4 and the TET gene promoter binding mechanisms will follow such scheme, which has two pathways that lead to the activation of the gene. Oct4 protein self-binds to the first site while the Nanog-guided TET protein complex binds to the second site. The promoter is active only when both sites are occupied. In this GRN, the Nanog gene is activated by the Oct4 gene. Furthermore, Nanog and TET form a heterodimer which models TET guiding Nanog to the target promoters.
Figure 4. The two-pathway activation scheme for TF-gene binding. In the full model, such an activation scheme describes the promoter binding activation for both Oct4 and TET genes. Considering Oct4 as an example, there are two pathways for the activation of its promoter. Each of NT and Oct4 can independently bind to the promoter of Oct4. When both NT and Oct4 bind to the promoter region of the Oct4 gene, it will be activated
The GRN with DNA demethylation is summarized in . The DNA demethylation cycle with the triangle topology can be further simplified into two states, which are shown in . The parameter is thought of as the effective methylation rate and the parameter
as the effective demethylation rate. The CRN for the PSCC with a two-state methylation cycle can be written as in . (For simplicity, we omit explicit variables for mRNA and other intermediate steps such as protein maturation and post-translation modifications.) We model this network deterministically through a system of ODEs. The variables in this system can be thought of as mean numbers for the various species in a population. The full model is described in the Methods section.
Figure 5. The diagram on the left shows how the triangle topology can be further simplified into a two-species CRN. Since the 5hmC methylation state has a slower dynamics compared to the 5mC methylation state, one may employ a quasi-steady states approximation to reduce the triangle topology to the two-state model depicted on the right
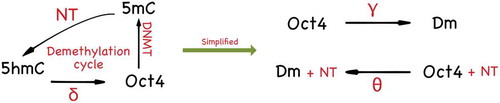
Table 1. The CRN model of the PSCC. Reactions have been grouped into eight modules and labelled from R1 to R18
Model reduction via quasi-steady state approximation
The full model CRN is computationally intensive to simulate, and it is conceptually difficult to interpret its dynamical behaviour. Hence, we perform a quasi-steady state approximation by distinguishing between two time-scales: the ‘fast’ time-scale of TF-promoter kinetics (binding/unbinding), and the ‘slow’ time-scale of protein expression/decay and DNA methylation kinetics. Note that the methylation cycle in our model is a phenomenological reduction of the cycle depicted in , which includes a dilution step as well as the coordinated action of many TFs and enzymes. Hence, the methylation cycle is not faster than protein kinetics, which are known to be much slower than TF-promoter kinetics [Citation15]. This is also supported by experimental evidence, as the re-establishment of methylation patterns can take up to 20 minutes [Citation51], and de novo methylation kinetics take days which are even slower than protein kinetics as has been observed in various de novo methylation studies [Citation52,Citation53]. It can be noted also that inherited methylation patterns have very slow kinetics in general [Citation54,Citation55].
Therefore, we assume that the reaction rates of the promoter-TF binding and unbinding dynamics are faster than the other reaction rates in the CRN . By applying time scale separation or quasi-steady state approximation, we reduce the full dynamical system model from a 17-dimensional state space to a 4-dimensional state space. The full model ODEs are given in the Methods section. The reduced dynamical system’s ODEs can be written as below:
Effect of methylation rate
For the full model, displays how the BoAp changes as one changes the epigenetic reaction rate . Each plot in the figure corresponds to one set of parameters, sampled from a wide range. The parameter set for the full model contains the following rates:
,
,
,
,
,
,
,
,
,
,
,
,
,
and
. Biologically speaking, changing the reaction rate
is equivalent to changing the effective methylation rate. Our subsequent study of the single gene model will display the same trend of BoAp’s dependence on
.
Figure 6. The relative stability (measured by BoAp) of the silenced steady state increases with respect to the DNAm rate (). We show simulations for a representative set of different rates for the full model, where extensive simulations are shown in SI-
1.1. Each curve in the figure correspond to a particular set of parameters. Each curve ends when bistability is lost and BoAp jumps to 100%. This behaviour is illustrated in SI-
2.1. The simulations also show that, at small
region, the BoAp exhibits a sudden slowing down at around
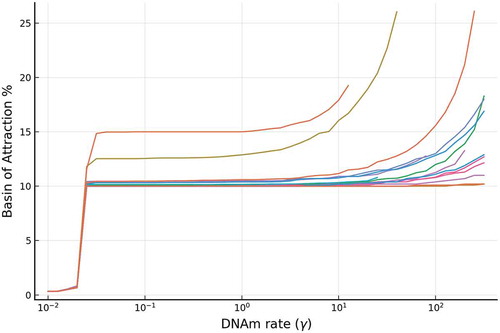
The phenotypic somatic state is characterized [Citation36] by low expression of Oct4, Nanog, TET, and methylated promoters. With simulations performed over 6200 parameter sets as shown in Supplementary Figure 1(a), the BoAp vs. plot shows that the BoAp is monotonically increasing with respect to
. In , we show a representative sample of these curves. If
is increased beyond a certain threshold, then bistability is lost and the BoAp of the silenced steady state becomes 100%. Note the different behaviour for intermediate values of
compared to low or larger values of
. Another interesting observation is that the BoAp is bounded below by
for all parameter sets when
is greater than
.
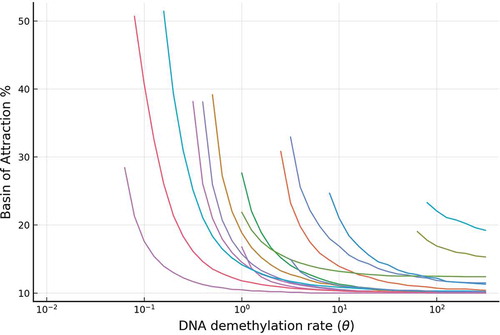
On the other hand, changing the reaction rate means changing the demethylation rate. As we reduced the triangle topology for the DNA demethylation cycle to a two-state cycle in the full model, the effective demethylation rate can be thought of as representing the combination effect of 5mC to 5hmC oxidation rate affected and the rate of oxidized 5hmC reverting to the unbound promoter state via either TDG-BER pathway or dilution via cell replication. In Supplementary Figure 1(b), the simulation shows that the BoAp is monotonically decreasing with respect to
. Over 6200 parameter sets have been simulated and we plot BoAp vs.
over 4 orders of magnitude to show the trend. In , we show a representative sample of these curves. We choose the value of the range for
to be the same as the range of
in the BoAp vs.
plot, which both are from
to
.
Figure 7. The relative stability (measured by BoAp) of the silenced state decreases with respect to the DNA demethylation rate (). Shown are a representative set of simulations for the full model, where extensive simulations are shown in SI-
1.1. Each curve in the figure corresponds to a particular set of parameters
These results confirm that our model captures the key role that methylation rate plays in enhancing the stability of the somatic steady state. The higher the effective methylation rate, the larger the BoAp. This means that it is more likely for the underlying dynamical system to stay at the somatic (silenced) steady state, which implies that it is relatively more stable. Furthermore, the methylation rate can be increased to the point of eliminating the existence of the active steady state (the pluripotent steady state) and making the silenced steady state immune to any abrupt perturbations. Note that the methylation rate is proportional to the abundance of DNMT, and hence all the conclusions above can be interpreted as applying to the DNMT abundances. We will elaborate on the practical implications of our model further in the Discussion section.
Effect of slow/fast methylation kinetics
To understand how the relative methylation rate affects the BoAp, we define the methylation association rate as R = .
The simulations in show that BoAp vs. across 4 orders of magnitude in
while
is increased so as to keep the ratio
constant with different ratios of
that span 3 orders of magnitude. Assuming a normalized protein decay rate (
), allows us to disentangle two effects: the methylation ratio (
) and the time-scale of the methylation cycle. The plots display a biphasic trend, i.e., the BoAp monotonically increases and then monotonically decreases. Therefore, there is a maximum value of the BoAp which occurs in the slow range
for various methylation ratios
, while the BoAp decreases as the methylation cycle becomes faster (which is consistent with the analytical picture to be shown in ). These results mean that the stability of the silenced state (or the efficiency of methylation) is maximized with a higher methylation ratio and a relatively slower methylation kinetics (roughly an order of magnitude slower than the protein decay rate).
Figure 8. The BoAp of the silenced state shows a biphasic behaviour when the methylation cycle transitions from slow to fast, where R defined as the methylation association rate R = . The plot shows the BoAp while
is increased with a fixed methylation ratio, i.e.,
is increased so as to keep the ratio R constant. The system loses bistability when R exceeds 30. The kinetic rate parameters used are:
= 0.3,
= 0.2,
= 0.1,
= 1,
= 100,
= 100,
= 1,
= 1,
= 1,
= 1,
,
![Figure 8. The BoAp of the silenced state shows a biphasic behaviour when the methylation cycle transitions from slow to fast, where R defined as the methylation association rate R = γθ. The plot shows the BoAp while γ is increased with a fixed methylation ratio, i.e., θ is increased so as to keep the ratio R constant. The system loses bistability when R exceeds 30. The kinetic rate parameters used are: KO = 0.3, Knt = 0.2, Kd = 0.1, a= 1, ant = 100, aO = 100, αT = 1, αO = 1, αN = 1, δ = 1, R∈{0.01,0.1,1,10,20,30}, γ∈[10−2,102]](/cms/asset/1529f0d0-e244-4512-b69b-a4bd384c99ab/kepi_a_1805686_f0008_oc.jpg)
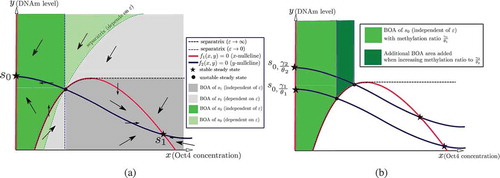
Figure 9. Phase plane analysis of the two-dimensional model (11). (a) The directions of the vector field and the BoAs in the case of bistability with stable steady states , where
denotes the silenced steady state and
denotes the active steady state. The arrows in each region denote the direction of the vector field. (b) The area of the
-independent BoA of the silenced steady state
increases when the methylation ratio increases. Recall that
denotes the case of a slow methylation kinetics (relative to protein kinetics), while
denotes the case of fast methylation kinetics
It should be noted that the biphasic nature of the trends is not a result of high-dimensional dynamics. Rather, the same behaviour can be observed in the single gene model (see SI- 1.2). Furthermore, the biphasic trend for the fixed ratio
can roughly be inferred from the PSCC simulations by varying each
and
independently. As per the trend we have shown in , the BoAp increasing rate exhibits a sudden slowing down at
around
, while there is no corresponding change for the demethylation rate
shown in . Therefore, it is not surprising that the methylation association ratio
has a biphasic behaviour.
Model of a single self-activating gene
In order to complement the numerical investigations in the previous sections, we consider next a simplified model which includes Oct4 only. Its interaction with the rest of the network is modelled as a self-activating loop. This model is more amenable to an analytical study as will be discussed below.
Our simplified model consists of a single self-activating gene. A CRN model for it can be written as follows:
where is the protein expressed from the active promoter state
and
is the inactive promoter state. (As earlier, we omit explicit variables for mRNA and other intermediate steps such as protein maturation and post-translation modifications.) To model self-activation, we assume that an
homodimer can bind to the inactive promoter site to activate the gene. The inactive promoter region can be methylated to a state that we denote by
. Reversely,
can be epigenetically modified back to the
state. We assume that protein
has degradation rate
. Our aim is to study the effect of the methylation ratio
on the dynamics.
Since the total concentration of promoters is conserved, the ODE model can be reduced by writing , where we scale the total number of promoters to 1. The system of ODEs that results is given as follows:
The steady states can be evaluated analytically to yield a cubic equation. There always exists a steady state in which (and also
). We call such a state the silenced steady state. It is easy to verify by linearization that this state is locally stable, for any parameter values. A bifurcation occurs and three steady states exist if and only if the following inequality holds:
where is (double) the dissociation ratio, and
and
are the production and methylation ratios, respectively. One of two additional steady states is always locally asymptotically stable and the other one is unstable (a saddle). We call the second stable steady state the active steady state. It follows from condition (9) that a sufficiently high methylation ratio renders the active steady state non-existent. Hence, a point attractor will coincide with the silenced steady state. This recapitulates our observation in that increasing the methylation ratio beyond a certain threshold will eliminate bistability, and hence the active (pluripotent) steady state disappears.
The model can be reduced further by utilizing the fact that transcription factor binding/unbinding is fast relative to protein expression and epigenetic modifications. We thus carry out a quasi-steady state (QSS) approximation, in which we set the state to:
Substituting this expression into the ODE system, we obtain a two-dimensional system whose two variables are the promoter methylated state and the protein
, as follows:
where is a parameter that represents the relative time-scale separation between protein and methylation kinetics. This system must be studied for
. We next analyse this reduced system.
Global behaviour
Observe that all solutions of the reduced system are bounded. Indeed, is bounded by definition, and
whenever
, so the rectangle
is an attractor.
The steady states of the reduced system are in a one-to-one correspondence with the states of the full system, in the sense that for each steady state there is a unique steady state
of the full system, where
and
is given by the expression in EquationEq. (10)
(10)
(10) . Thus, there are one or more steady states depending on condition (9). We may think of the system (11) as a ‘toggle switch’ in which
(the methylated promoter) represses
(protein), and conversely
represses
. If silencing is stronger, we expect the protein state to remain at zero, while if activation is stronger, we expect protein values to converge to a higher steady state.
In order to analyse the global behaviour of system (11), we first evaluate its Jacobian matrix:
Both off-diagonal entries are non-positive, which makes this system a monotone system, and specifically, a system that is cooperative with respect to the cone defined by the orthant, as discussed in [Citation56] (see also [Citation57] for exposition and biological applications). In [Citation58], M.W. Hirsch proved (Theorem 2.2) that every bounded solution of a planar cooperative system converges to an equilibrium; see also Theorem 2.2 in [Citation56]. Coupled from boundedness of solutions for our system, we conclude that every trajectory converges to an equilibrium (which depends on the initial conditions of the trajectory).
Phase plane analysis
Our two-dimensional reduced model can be analysed via nullclines. A summary of the analysis is depicted in for a bistable model. The nullclines and the steady states are independent of . On the other hand, the separatrix, which is the boundary between the BoAs, is
-dependent. It is shown that each BoA can be partitioned into
-dependent and
-independent regions ()) shows that the area of the
-independent BoA of
increases as the methylation ratio is increased. Hence, it can be argued that the BoAp of the silenced steady state increases as the methylation ratio increases, which recapitulates our observations for the full model. Furthermore, we have performed numerical simulations for the single-gene model and they show the same trends. Refer to SI-
1.2.
Slow methylation kinetics
We have argued previously that DNAm can be even slower than protein kinetics; hence, we focus on case in this subsection. shows that, in this limit, the BoA of
consists only of the
-independent region. Next, we analytically investigate the aforementioned limit.
Computing the asymptotic separatrix
Setting , we see that the
-nullcline consists of two components, which we call the silenced and active arcs, because the dynamics along each arc converge to the silenced and active steady states, respectively. The arcs can be written as follows:
1. Silenced/Somatic: The arc is , which gives the slow dynamics of
This is a linear system, and it has an asymptotically stable steady state at . Notice that the location of this steady state is an increasing function of the methylation ratio
.
2. Active/Pluripotent: The arc is given by the implicit equation: . Solving for
in terms of
:
The slow dynamics are given as (note for all
and any initial condition with
):
Hence, is the asymptotic steady state, which is proportional to the methylation ratio
.
Given an initial condition , we want to determine which arc will be representative of the dynamics. A necessary condition for the existence of the second arc (i.e., the chance to converge to the active steady state) is that the quantity under the square root in (12) is real. Hence, we have:
Hence, automatically implies that the silenced arc represents the dynamics regardless of the initial
. Furthermore, if the dissociation ratio is high compared to the protein production ratio (i.e.,
) then the dynamics are also represented solely by the silenced arc. Assuming the necessary condition is satisfied, we need also that
To summarize, if both (13), (14) are satisfied, then the second arc is representative of the dynamics; otherwise, the first arc represents the dynamics. This conclusion is summarized in the dark grey region in ).
A remark concerning reprogramming by over-expression of . Our global analysis allows us to intuitively understand the role of
in over-expression experiments (such as the ones carried out in Yamanaka’s lab [Citation7]). In this scenario, we assume that
, i.e., the initial condition is a silenced steady state. Over-expression means that a sudden dose of
will be injected to the system such that
, where
is a constant positive number. Our aim is to drive the system to the BoA of the active steady state.
It follows from the analysis above that
is necessary for reprogrammability. Hence, the expression ratio and the methylation ratio
must satisfy:
If both of these conditions are satisfied, then overexpression will steer the trajectory to the active arc if the following holds:
In a nutshell, Equationeqns. (15)(15)
(15) , (Equation16
(16)
(16) ) imply that we need a sufficiently high Oct4 expression ratio, a sufficiently high overexpression value (
), and a sufficiently low methylation ratio. This again underscores the importance of the methylation ratio.
Comparison of the two models. The results for the single gene model (presented analytically above, and numerically in SI- 1.2 parallel those for the four-dimensional model (which was, in turn, obtained through QSSA from the full 17-dimensional CRN)). For example, we see a qualitatively similar behaviour regarding the BoAp’s dependence on the (de)methylation rate in both models. In addition, the results in the reduced model with 4D state space again agree with those for the single gene model with 2D state space.
The full model has the advantage of incorporating all the regulation loops and displaying the effect of the methylation cycle on the steady-state values of the Nanog and TET proteins. However, the single gene model can be reduced to a 2D model which enables the analytical computation of the steady states and the application of phase plane methods. Basic trends in the BoAp can be intuitively read from the shift in the separatrix within the predefined cube. Unfortunately, performing similar analysis for the 4D model is intractable, but the numerical simulations have shown the same basic behaviour predicted by the single gene model.
The single gene model is not equipped with the additional regulation loops mediated by the NT heterodimer. Nevertheless, this model demonstrates that the trends displayed by the full model are intrinsic effects of the proposed methylation/demethylation cycle. In both cases, a slow epigenetic process – in our case, a methylation cycle – shifts the stability boundary of the underlying system consistently in the same direction.
Discussion
We have proposed a mathematical modelling paradigm to elucidate the role of DNAm in the activation and silencing of genes. This has been achieved by integrating DNAm into the standard paradigm of GRNs, which rely on TF-promoter binding/unbinding. Our model can be considered as an effective model which considers essential chemical reactions that are relevant to the core cell Oct4 reprogramming network. We have provided a quantitative model of the effect of methylation rates on gene silencing and activation, particularly in the context of ES cell reprogramming. We have shown that increasing the methylation rate increases the BoAp of the silenced state until the active state disappears and the silenced state becomes the only stable steady state. Since the methylation rate is directly proportional to the abundance of DNMT, our results predict that reducing DNMT abundances will lead to gene activation via the emergence of the new active steady state and the loss of stability of the silenced state by BoA shrinkage. Indeed, experimental evidence shows that the application of DNMT inhibitors leads to the reactivation of the associated genes in various contexts [Citation59–62]. In the context of the PSCC, repressing DNMT3B helps in generating pluripotent cells and underscores its role as a regulator of the circuit [Citation63]. Furthermore, downregulation of DNMT3a/b via miRNAs has been suggested as a mechanism for regulating pluripotency [Citation64,Citation65]. On the other hand, DNMTs 1/3a/3b genes can be eliminated without any negative impact on the pluripotent state [Citation66]. Similar results were reproduced in human ES cells with DNMT 3a/b knockout [Citation67]. These results are consistent with our prediction that a highly reduced methylation rate will consolidate the stability of the active steady state. As discussed in the introduction, a smaller basin of attraction of the silenced state means that natural perturbations in the cell environment will have a greater chance of leading to a state transition to the active state.
Since DNAm and demethylation rates can be changed dynamically during the developmental process, the model can be applied at different stages. Also, it can be used to predict the intervention needed (for instance in terms of DNMT up- or down-regulation) to activate or silence a gene of interest. The relative stability of a certain phenotype (measured by the BoAp) can be also estimated which correlates with the average time (e.g., number of days) needed to transition between different phenotypes. Hence, our model can be used as a quantitative guide to design the reprogramming protocol in the context of the PSCC. Furthermore, the DNAm rate can be measured directly. Experimental tools have been developed to trace the dynamic changes of DNAm at single base resolution [Citation68]. In principle, a time series of the DNAm density at the TSS over the course of the developmental process can be constructed from such data, and the methylation rate can be determined accordingly. Such time-series data have been used in a recent experiment [Citation53], which studied the reprogramming of B cells to induced pluripotent cells. That paper showed that the last stage of the successful pluripotency induction displays successive waves of hydroxymethylation associated with a decrease in DNA methylation and active demethylation. Although such techniques are in their infancy, we predict that our model can be used, in conjunction with more extensive data collection methods, to predict the likelihood of the activation of a gene based on the measurable methylation and demethylation rates.
Our model can also be used in conjunction with more direct experimental manipulation methods. In addition to DNMT inhibitors mentioned above, a recent intriguing technique in synthetic epigenetics is the newly developed synthetic read-write modules [Citation69] implemented in human cells via m6A DNA modification. Such synthetic epigenetic regulatory system can allow us, in principle, to regulate the DNAm patterns and influence the resulting phenotypes by controlling the (de)methylation rate. Using our model, the relative stability of a phenotype is reflected in the duration of the time that a cell takes to successfully reprogram to the pluripotent state due to the stochastic nature of the underlying processes. From an engineering perspective, with the help of synthetic epigenetic read-write modules, one can aim at re-engineering the DNAm patterns to explore how changes of (de)methylation rates affect the reprogramming time during the developmental process. In addition to directly manipulating the DNAm or demethylation rates, one can also think of indirect ways for interacting with DNAm. Evidence suggest that histone modifications like H3K4me1/3, H3K27me3, H3K27ac and the polycomb family of proteins are intricately interacting with DNAm and are playing key roles in recruiting some co-factors and interacting with enhancer regions [Citation70]. Therefore, one can experimentally engineer specific pathways for perturbing the DNAm rate through histone level interventions.
Along with the discovery of the role of TET protein in regulation of the DNA (de)methylation cycle, several theoretical models have been proposed to understand the underlying mechanistic picture of how TFs and DNA interact with each other, and additionally how epigenetic factors such as DNAm and histone modifications affect gene regulatory networks in various biological contexts. In the following, we discuss the relation between these models and ours. Many related core gene regulatory networks have been proposed at various levels of complexity. An early attempt using a probabilistic Boolean network that describes the interplay between gene expression, chromatin modifications, and DNAm has been proposed in [Citation19]. In addition to lacking mechanistic interpretations, Boolean models do not allow one to quantify the effect of DNAm on the stability boundary between the multiple phenotypes. As the role of the TET protein family in gene regulation became clearer [Citation31,Citation42,Citation71,Citation72], various CRN models and ODE models that have partially considered TET-mediated demethylation cycle [Citation36,Citation73] and core gene-TF regulatory mechanisms have been proposed. Notably in [Citation73], an ODE model for a core gene-TF regulatory network of the PSCC has been studied. The system involves Oct4, Sox2 and Nanog proteins and exhibits multistability under certain conditions. Regarding epigenetic regulation, that work modelled the DNAm cycle on top of Oct4 auto-activation. The model did not consider the interaction between Nanog and TET, nor how NT heterodimer regulates the DNA demethylation cycle. Despite the fact that the DNAm model in [Citation73] did not include a two-pathway activation-like mechanism for gene activation, it represented an early attempt to mechanistically link gene regulation and chromatin modifications. In [Citation36], a mechanism was proposed for the core gene-TF network without epigenetics, and then a two-state model without NT regulating the DNA demethylation process was investigated on top of this core network. However, the underlying chemical reaction model in [Citation36] was not spelled-out clearly. In addition to this, without the NT complex involved in the DNA demethylation process, the model in [Citation36] couples the core gene-TF network and DNA demethylation cycle, which does not reflect the experimental evidence of the role of NT in the regulation of DNA demethylation. Specifically, the model lacks the reaction in which NT complex binds to the 5hmC. In the recent experimental work [Citation74], four chromatin regulators, including DNMT3B which causes de novo methylation of cytosine-guanine dinucleotides (CpGs), have been studied. Though a descriptive three-state model was proposed in [Citation74] for explaining how each chromatin regulator affects the silencing and reactivation of gene expression, a detailed mechanism at a molecular level was not provided. In comparison with all these previous attempts, we model the underlying CFN with a detailed CRN model at a molecular level, and we clearly show how epigenetic regulation, specifically the DNA demethylation cycle, regulates the CFN by the Nanog-guided TET protein complex.
In [Citation75], a purely phenomenological model of how epigenetic feedback affects gene expression dynamics is proposed. The main idea is to represent the kinetic rate parameters by epigenetic variables that have their own dynamic equations. More recently, a similar idea has been employed in the context of epithelial-mesenchymal transition (EMT) and cancer metastasis [Citation18]. Such a view of epigenetic feedback regulation of kinetic rates is a valuable complementary perspective.
So far, we have explored a cell fate network combining gene-TF interactions and a TF-guided DNA demethylation process. For the CRN we proposed, we have considered how the TET-mediated demethylation cycle potentially affects the gene regulatory network, and subsequently affects the cell fate decision associated with the transcription factors. We have simplified the demethylation cycle into a two-state cycle. Our mechanistic modelling approach using CRN agrees with the intuition on how DNAm affects the cell fate network. The faster the methylation rate the more stable the silenced (somatic) state will be. However, in the detailed molecular picture of the cell fate network that involves Oct4, Nanog, TET and potentially many other transcription factors, there might exist all sorts of self or non-self interactions in the network. For example, if one adds Nanog protein self activation, one would expect such a model to potentially exhibit tristability. Although our model explored the simplest case in which the system gives rise to bistability, the basin of attraction boundary of other models with tristability can still be studied by the relative BoAp within a predefined hypercube.
DNAm’s role in gene silencing at transcriptional start sites has been well established where genomic maps have shown that regulatory genes are indeed active when they are unmethylated [Citation76]. Furthermore, its repressing roles have been documented in many specific cases such as that of the PSCC [Citation46], X-chromosome inactivation [Citation77], and in ageing and cancer [Citation78,Citation79]. However, it is worth mentioning that a full and universal understanding of its role across different genes and its effect on phenotypic variability is not completely achieved yet. This is since different epigenetic mechanisms at different scales are intricately related to DNAm pattern and dynamics. Additionally, its role can vary in different localized biological contexts [Citation76]. For example, although DNAm generally represses TF binding at transcriptional start sites, methylation in the gene body can have a different role [Citation25]. For instance, it has been shown recently that DNAm can indirectly facilitate TF binding in some special cases [Citation80]. Another issue for debate is whether DNAm is a master regulator or a by-product of the underlying GRN [Citation80,Citation81]. Therefore, the analysis provided in this paper is more predictive for the majority of cases in which DNAm plays a repressing role in a GRN. A future direction will be to develop a more encompassing framework for the various roles of DNAm.
As for future directions, even though the two-pathway activation is a mechanism-based model, it does not capture the full complexity of the whole picture of gene activation. The implicit assumption for this activation process is that genes are only activated by TFs binding to promoters. Hence, we are studying the extension of our methods to the analysis of more sophisticated transcriptional control mechanisms, such as the formation of super-enhancers [Citation82]. We are also interested in combining machine learning approaches with our CRN model so as to discover new mechanisms when the relevant data is available. Finally, when generalizing the BoAp to a stochastic setting, the effective landscape of the dynamical system and the mean first passage time between equilibria are the concepts which are most relevant to the analysis of the stochastic stability boundary. Furthermore, stochastic analysis via effective potentials can be used for defining the BoAp and exploring gene-TF interactions with epigenetic regulation.
Methods
Basic mathematical concepts and definitions
Mathematically, our model is initially described as a Chemical Reaction Network (CRN). CRNs provide a natural formalism for representing biological interactions, and in particular biochemical processes, and CRN descriptions map into systems of Ordinary Differential Equations (ODEs) using standard procedures.
Chemical reaction network (CRN) framework
It is essential for our study to keep track of promoter occupancy, since DNAm at the level of promoters is commonly understood as a slow process compared to TF binding/unbinding, and it can be even slower than protein kinetics. However, our main model assumes that DNAm and protein kinetics are in the same time-scale.
Following [Citation83], each gene is associated with promoter states and one or more a protein states.Footnote1 After the model is set up, we later reduce it by the substitution of quasi steady-state approximations of fast variables, based on appropriate relative time-scales.
We briefly review the general formalism, see, e.g., [Citation84,Citation85]. A CRN is specified by a set of species and a set of reactions
. A reaction
can be written as:
. The associated stoichiometry matrix
is defined elementwise as
. Each reaction
can occur with a rate function
. We assume that
takes the form of Mass-Action kinetics:
, where
is a kinetic constant. Letting
be the vector of species concentrations at time
, the associated ODE can be written as:
, where
.
The goal of our models is to grasp the essence and the most relevant dynamics that give rise to the CFN with bistability. Unfortunately, it is difficult to decide on appropriate ranges of kinetic parameters for such coarse grained level models. One restriction that we have imposed on parameters is to require bistability, meaning (for both the single gene and the full model) that there should be two stable attractors (and a saddle node) for the underlying dynamics. One stable attractor corresponds to the somatic (silenced) state, and the other one corresponds to the active (pluripotent) state.
Full model description
We grouped our CRN for the full model into eight modules with the reactions numbered from R1 to R18 as shown in .
1. Oct4 promoter module (R1-R4): This module contains four reactions. In our modelling context, we assume that the Oct4 gene has two binding sites. The first binding site is for Oct4 protein itself [Citation86,Citation87], and the second binding site is for Nanog-TET heterodimer complex [Citation42] as shown in the two-pathway activation scheme in . Although we have shown NT binding to the first site and Oct4 binding to the second site in , the cases of Oct4 binding to the first site and NT binding to the second site are the same for our modelling. Both cases are considered as a single-site occupancy and are denoted by in . As long as two sites are occupied, the corresponding gene will get activated. The parameter
is the forward rate for all reactions that involve NT binding to a promoter, and
is the dissociation rate for all reversible reactions associated with NT binding to a promoter. The parameter
is the forward rate for all reactions that involve Oct4 binding to a promoter, and
is the dissociation rate for all reversible reactions associated with Oct4 binding to a promoter.
2. TET promoter module (R5-R8): This module contains 4 reactions. Similar to the Oct4 promoter, the TET promoter region is also able to bind with the NT dimer and the Oct4 protein [Citation31,Citation36,Citation42]. For the reaction rate, we adopt the same rate parameter for TET as for Oct4.
3. Nanog promoter module (R9): This module describes the reversible reaction of Oct4 protein binding to the Nanog promoter [Citation87].
4. Nanog-TET module (R10): This module describes the fact that the TET-mediated DNA demethylation cycle is guided by the Nanog protein in the form of an NT complex [Citation53]. The parameters are the association and dissociation rates of the heterodimerization of Nanong and TET.
5. Protein decay and production module (R11-R13): In this module, we assume Nanog, TET, and Oct4 all have the same degradation rate . When each gene promoter has been fully occupied by TFs, the corresponding gene will be activated. The protein production rates for each activated promoter
,
,
are given by the reaction rates
,
and
.
6. Protein basal production module (R14-R16): In this module, we assume that TET protein has a basal production rate . The rates
(basal rate for Nanog) and
(basal rate for Oct4) are 0. We used the values of such basal protein production rates from [Citation36].
7. Oct4 promoter Methylation module (R17): This module describes the de novo methylation of the Oct4 gene promoter region with a methylation rate . We assume that the Oct4 promoter can be methylated only if its promoter is unbound. This is supported by experimental observations that show that Oct4 protects its promoter from methylation when it is bound to it [Citation88].
8. Nanog-guided TET demethylation module (R18): In this module, we assume that the triangle topology of DNA demethylation cycle has a slow dynamics on the 5hmC oxidized promoter state [Citation31]. Using a quasi-steady state approximation, we reduced the demethylation cycle from the triangle topology to a two-state CRN with the effective demethylation rate given by . (See )
In our model, the DNA methylation rate refers to the effective rate combining de novo methylation rate, mainly contributed by DNMT3a/b, and maintenance methylation (upon replication) contributed by both DNMT1 and DNMT3a/b [Citation89,Citation90]. DNMT3 is a family of DNA methyltransferases that can methylate hemimethylated and unmethylated CpGs at the same rate, while DNMT1 has the tendency to methylate hemimethylated DNA after replication [Citation90]. In our model of the DNA demethylation cycle, the 5mC state is considered as a fully methylated state, and our model is not affected by the gene methylation state being hemi-methylated state for a transient short period.
In order to understand the basic effects of DNAm on silencing, and to maintain the intelligibility and tractability of the model, we assume that the methylation status of a promoter is binary: it is either methylated or not. As we have illustrated in , this is a simplified representation of the real picture where methylation is a complex process. Recent results suggest that the methylation of individual cytosines can be important in certain cases [Citation91]. Furthermore, the methylation of Oct4 starts initially from two sites: the proximal enhancer and the distal promoter, spreading later to neighbouring regions [Citation45]. In addition, the average promoter methylation does not usually reach to either 0% or 100% [Citation92]. However, these intricate details are not relevant to our reduced model. For instance, if 80% methylation of Oct4 promoter is sufficient for silencing, and the cell is somatic at phenotypic level, we assume that an average DNAm level of 80% to be functionally equivalent to a fully methylated promoter.
ODE system for the full CRN model
The corresponding ODE model for the PSCC () is given below:
Steady state calculation
For the models defined above (the single gene model is (2)-(5), and the full model given by the CRN in ), we first calculate the number of steady states that the model admits given a certain set of parameters. We use a Homotopy Continuation (HC) method to find all possible steady state solutions for our dynamical system models. The Global HC method is currently the best candidate to find all steady states solution for the system [Citation93].
Sampling method
For the single gene model
We calculate the BoAp with various parameter sets that give rise to three steady states. Then, we calculate the BoAp against and
individually. Though the model contains four state variables
,
,
,
, it is essentially a three-dimensional model due to the conservation of the total concentration of promoters. For simplicity, we normalize total concentration of promoters to an arbitrary constant, say 5.
In order to calculate the BoAp, we need to specify a predefined volume of interest. We have defined the hyper-cube where
are 1.5 times the corresponding high steady state. Because the conservation law puts a constraint on the total concentration of promoters, for each
,
and
, their concentration should be all less than the total (in the simulation we choose the concentration total = 5). We sample the state space (with a given grid size) and count the number of points in the defined grided space that converges to the low steady state. We then plot BoAp with respect to
and
for various numbers of parameter sets and show that they display a consistent trend.
For the full model
Given the CRN from , we first calculate steady state solutions that show bistability. Then, we use quasi-steady steady approximation to reduce the full model from 17 dimensions to 4 dimensions and simulate the BoAp in 4D space with a predefined hypercube similar to the previous paragraph.
Parameters
The ‘free’ parameters below are constrained to the set which can give rise to bistability. The following ‘free’ parameters can be thought of as normalized constants that can be re-scaled to their experimental values when applied to a biological context.
In the single gene model, the kinetic rate parameters are: ,
,
,
,
,
. In the simulation of BoAp vs.
plot, we choose the parameter (
,
,
,
,
) values ranging from 0 to 5 with a step size of 0.5. For the simulation of BoAp vs
plot, the same range is used for
,
,
,
,
.
The range can be chosen to be , for any
. This is since the ODE (2)-(5) follows Mass-action kinetics and all the rates can be scaled to have values from 0 to
for the purpose of BOAp investigation.
In the full model, the kinetic rate parameters that define the system are: ,
,
,
,
,
,
,
,
,
,
,
,
,
and
as shown in . Although the values for the three dissociation parameters
,
,
were given in [Citation36], in our full model simulation results, we are varying
,
,
from 0 to 0.5 with 0.1 step size, and
from 1 to 5 with 0.5 step size, and the parameter
from 1 to 20 with a step size of 2. We set protein production rates
,
and
for Nanog, TET and Oct4 to be 1, the parameter
, and finally the parameters
and
are set to be 100. For those parameters that are set to be constants, we did extensive simulations that have shown that the BoAp is insensitive to large changes in their values. Hence, our presented simulations only contain parameter sets that have noticeable influence on the BoAp.
Methylation association rate ( )
)
In the single gene model, we choose the methylation association rate () to be from 0.2 to 1.3 so that it covers both the “
“ regime and the “
“ regime of the dynamics with a particular parameter set. In the full model, we choose the methylation association rate (
) to span across several orders of magnitude, as possible, ranging from 0.01 to 30. The values of
for each model depend on the parameter set we choose, but the qualitative trend for all the parameter sets we tested is the same and shows a biphasic trend. For the full model in we have chosen the following parameters:
,
,
,
,
,
,
,
,
,
,
, and with
spanning the range
. For those
values outside the range, the system does not exhibit bistability for this particular parameter set.
Code availability
The programming code that was used to analyze the raw data that supports the findings of this study is available from the corresponding author upon request.
Supplemental Material
Download PDF (11.3 MB)Disclosure statement
No potential conflict of interest was reported by the authors.
Supplementary material
Supplemental data for this article can be accessed here.
Additional information
Funding
Notes
1. We assume that transcription is fast enough that no explicit consideration of mRNA abundances is required, but it would be straightforward to add mRNA intermediates to the model.
References
- Waddington CH. The strategy of the genes. George Allen and Unwin; 1957. Oxon, UK.
- Zhou JX, Huang S. Understanding gene circuits at cell-fate branch points for rational cell reprogramming. Trends Genet. 2011;27(2):55–62.
- Burda P, Laslo P, Stopka T. The role of PU.1 and GATA-1 transcription factors during normal and leukemogenic hematopoiesis. Leukemia. 2010;24(7):1249–1257.
- Fisher RC, Scott EW. Role of PU.1 in hematopoiesis. Stem Cells. 1998;16(1):25–37.
- Chou ST, Khandros E, Bailey LC, et al. Graded repression of PU.1/Sfpi1 gene transcription by GATA factors regulates hematopoietic cell fate. Blood. 2009;114(5):983–994, 07.
- Mittal V. Epithelial mesenchymal transition in tumor metastasis. Annu Rev Pathol. 2018;13(1):395–412. PMID: 29414248.
- Takahashi K, Yamanaka S. Induction of pluripotent stem cells from mouse embryonic and adult fibroblast cultures by defined factors. Cell. 2006;126(4):663–676.
- Omole AE, Fakoya AOJ. Ten years of progress and promise of induced pluripotent stem cells: historical origins, characteristics, mechanisms, limitations, and potential applications. PeerJ. 2018;6:e4370.
- Li C, Wang J. Quantifying cell fate decisions for differentiation and reprogramming of a human stem cell network: landscape and biological paths. PLoS Comput Biol. 2013;9(8):e1003165.
- Del Vecchio D, Abdallah H, Qian Y, et al. A blueprint for a synthetic genetic feedback controller to reprogram cell fate. Cell Syst. 2017;4(1):109–120.
- Mahla RS. Stem cells applications in regenerative medicine and disease therapeutics. Int J Cell Biol. 2016;2016:6940283.
- Zakrzewski W, Dobrzyński M, Szymonowicz M, et al. Stem cells: past, present, and future. Stem Cell Res Ther. 2019;10(1):68.
- Hecker M, Lambeck S, Toepfer S, et al. Gene regulatory network inference: data integration in dynamic models – a review. Biosystems. 2009;96(1):86–103.
- Huang S, Eichler G, Bar-Yam Y, et al. Cell fates as high-dimensional attractor states of a complex gene regulatory network. Phys Rev Lett. 2005 Apr;94(12):128701.
- Alon U. An introduction to systems biology. Boca raton (FL): CRC press; 2006.
- Del Vecchio D, Murray RM. Biomolecular feedback systems. Princeton (NJ): Princeton Univ Press; 2015.
- Gardner TS, Cantor CR, Collins JJ. Construction of a genetic toggle switch in Escherichia coli. Nature. 2000;403(6767):339–342.
- Jia W, Deshmukh A, Mani SA, et al. A possible role for epigenetic feedback regulation in the dynamics of the epithelialmesenchymal transition (EMT). Phys Biol. 2019;16(6):66004.
- Flöttmann M, Scharp T, Klipp E. A stochastic model of epigenetic dynamics in somatic cell reprogramming. Front Physiol. 2012;3:216.
- Folguera-Blasco N, Pérez-Carrasco R, Cuyàs E, et al. A multiscale model of epigenetic heterogeneity-driven cell fate decision-making. PLoS Comput Biol. 2019;15(4):e1006592.
- Bintu L, Yong J, Antebi YE, et al. Dynamics of epigenetic regulation at the single-cell level. Science. 2016;351(6274):720–724.
- Takahashi K, Yamanaka S. A developmental framework for induced pluripotency. Development. 2015;142(19):3274–3285.
- Koh KP, Rao A. DNA methylation and methylcytosine oxidation in cell fate decisions. Curr Opin Cell Biol. 2013;25(2):152–161.
- Baylin SB. DNA methylation and gene silencing in cancer. Nature Clin Pract Oncol. 2005;2(S1):S4–S11.
- Jones PA. Functions of DNA methylation: islands, start sites, gene bodies and beyond. Nat Rev Genet. 2012;13(7):484–492.
- Dor Y, Cedar H. Principles of DNA methylation and their implications for biology and medicine. Lancet. 2018;392(10149):777–786.
- Luo C, Hajkova P, Ecker JR. Dynamic DNA methylation: in the right place at the right time. Science. 2018;361(6409):1336–1340.
- Curradi M, Izzo A, Badaracco G, et al. Molecular mechanisms of gene silencing mediated by DNA methylation. Mol Cell Biol. 2002;22(9):3157–3173, 05.
- Moore LD, Le T, Fan G. DNA methylation and its basic function. Neuropsychopharmacology. 2013;38:23–38, 01.
- Razin A, Cedar H. DNA methylation and gene expression. Microbiol Rev. 1991;55(3):451–458, 09.
- Kasper Dindler KH. Rasmussen, “Role of TET enzymes in DNA methylation, development, and cancer,”. Genes Dev. 2016;30(7):733–750.
- Wu X, Zhang Y. TET-mediated active DNA demethylation: mechanism, function and beyond. Nat Rev Genet. 2017;18(9):517.
- Bachman M, Uribe-Lewis S, Yang X, et al. 5-Formylcytosine can be a stable DNA modification in mammals. Nat Chem Biol. 2015;11(8):555.
- Bachman M, Uribe-Lewis S, Yang X, et al. 5-Hydroxymethylcytosine is a predominantly stable DNA modification. Nat Chem. 2014;6(12):1049.
- Li M, Belmonte JCI. Ground rules of the pluripotency gene regulatory network. Nat Rev Genet. 2017;18(3):180.
- Victor Olariu KS, Lvkvist C. Nanog, Oct4 and TET1 interplay in establishing pluripotency. Sci Rep. 2016;6(1):25438.
- Li D, Chen J, Pei D. The battle between TET proteins and DNA methylation for the right cell. Trends Cell Biol. 2018;28(12):973–975.
- Pesce M, Schöler HR. Oct-4: gatekeeper in the beginnings of mammalian development. Stem Cells. 2001;19(4):271–278.
- Kim JB, Sebastiano V, Wu G, et al. Oct4-induced pluripotency in adult neural stem cells. Cell. 2009;136(3):411–419. .
- Geng T, Zhang D, Jiang W. Epigenetic regulation of transition among different pluripotent States. Stem Cells. 2019;11:1372–1380.
- Costa Y, Ding J, Theunissen TW, et al. NANOG-dependent function of TET1 and TET2 in establishment of pluripotency. Nature. 2013;495(7441):370.
- Sardina JL, Collombet S, Tian TV, et al. Transcription factors drive TET2-mediated enhancer demethylation to reprogram cell fate. Cell Stem Cell. 2018;23(5):727–741.e9.
- Okita K, Ichisaka T, Yamanaka S. Generation of germline-competent induced pluripotent stem cells. Nature. 2007;448(7151):313–317.
- Polo JM, Anderssen E, Walsh RM, et al. A molecular roadmap of reprogramming somatic cells into iPS cells. Cell. 2012;151(7):1617–1632. .
- Athanasiadou R, de Sousa D, Myant K, et al. Targeting of de novo DNA methylation throughout the Oct- 4gene regulatory region in differentiating embryonic stem cells. PloS One. 2010;5(4):e9937.
- Smith ZD, Meer A. DNA methylation: roles in mammalian development. Nat Rev Genet. 2013;14(3):204–220.
- Lee D-S, Shin J-Y, Tonge PD, et al. An epigenomic roadmap to induced pluripotency reveals DNA methylation as a reprogramming modulator. Nat Commun. 2014;5(1):5619. .
- Lang AH, Li H, Collins JJ, et al. Epigenetic landscapes explain partially reprogrammed cells and identify key reprogramming genes. PLoS Comput Biol. 2014;10(8):e1003734.
- Menck PJ, Heitzig J, Marwan N, et al. How basin stability complements the linear-stability paradigm. Nat Phys. 2013;9(2):89–92.
- Ben-tabou de Leon S, Davidson EH. Modeling the dynamics of transcriptional gene regulatory networks for animal development. Dev Biol. 2009;325(2):317–328, 01.
- Xu C, Corces VG. Nascent DNA methylome mapping reveals inheritance of hemimethylation at CTCF/cohesin sites. Science. 2018;359(6380):1166–1170.
- Velicescu M, Weisenberger DJ, Gonzales FA, et al. Cell division is required for de novo methylation of CpG islands in bladder cancer cells. Cancer Res. 2002;62(8):2378–2384.
- Sardina JL, Collombet S, Tian TV, et al. Transcription factors drive Tet2-mediated enhancer demethylation to reprogram cell fate. Cell Stem Cell. 2018;23(5):727–741.
- Sasai M, Kawabata Y, Makishi K, et al. Time scales in epigenetic dynamics and phenotypic heterogeneity of embryonic stem cells. PLoS Comput Biol. 2013;9(12):e1003380.
- Zhou W, Dinh HQ, Ramjan Z, et al. DNA methylation loss in late-replicating domains is linked to mitotic cell division. Nat Genet. 2018;50(4):591–602.
- Smith H. Monotone Dynamical Systems. Providence, RI: AMS; 1995.
- Sontag ED. Monotone and near-monotone biochemical networks. Syst Synth Biol. 2007;1(2):59–87.
- Hirsch M. Systems of differential equations which are competitive or cooperative I: limit sets. SIAM J Appl Math. 1982;13(2):167–179.
- Foltz G, Yoon J-G, Lee H, et al. DNA methyltransferase-mediated transcriptional silencing in malignant glioma: a combined whole-genome microarray and promoter array analysis. Oncogene. 2009;28(29):2667–2677.
- Lund K, Cole JJ, VanderKraats ND, et al. DNMT inhibitors reverse a specific signature of aberrant promoter DNA methylation and associated gene silencing in AML. Genome Biol. 2014;15(7):406.
- Sin-Chan P, Huang A. DNMTs as potential therapeutic targets in high-risk pediatric embryonal brain tumors. Expert Opin Ther Targets. 2014;18(10):1103.
- Ziller MJ, Ortega JA, Quinlan KA, et al. Dissecting the functional consequences of de novo DNA methylation dynamics in human motor neuron differentiation and physiology. Cell Stem Cell. 2018;22(4):559–574. .
- Wongtrakoongate P, Li J, Andrews PW. DNMT3B inhibits the re-expression of genes associated with induced pluripotency. Exp Cell Res. 2014;321(2):231–239.
- Marson A, Levine SS, Cole MF, et al. Connecting microRNA genes to the core transcriptional regulatory circuitry of embryonic stem cells. Cell. 2008;134(3):521–533. .
- Horii T, Hatada I. Regulation of CpG methylation by DNMT and TET in pluripotent stem cells. J Reprod Dev. 2016;62(4):331–335.
- Tsumura A, Hayakawa T, Kumaki Y, et al. Maintenance of self-renewal ability of mouse embryonic stem cells in the absence of DNA methyltransferases DNMT1, DNMT3A and DNMT3B. Genes Cells. 2006;11(7):805–814. .
- Liao J, Karnik R, Gu H, et al. Targeted disruption of DNMT1, DNMT3A and DNMT3B in human embryonic stem cells. Nat Genet. 2015;47(5):469. .
- Stelzer Y, Shivalila CS, Soldner F, et al. Tracing dynamic changes of DNA methylation at single-cell resolution. Cell. 2015;163(1):218–229.
- Park M, Patel N, Keung AJ, et al. Engineering epigenetic regulation using synthetic read-write modules. Cell. 2019;176(1–2):227–238.
- Epsztejn-Litman S, Feldman N, Abu-Remaileh M, et al. De novo DNA methylation promoted by G9a prevents reprogramming of embryonically silenced genes. Nat Struct Mol Biol. 2008;15(11):1176. .
- Ito S, D’Alessio AC, Taranova OV, et al. Role of TET proteins in 5mC to 5hmC conversion, ES-cell self-renewal and inner cell mass specification. Nature. 2010;466(7310):1129.
- Rasmussen KD, Helin K. Role of TET enzymes in DNA methylation, development, and cancer. Genes Dev. 2016;30(7):733–750.
- Abdallah H, “The core mammalian pluripotency network in induced pluripotent stem cell (iPSC) formation: models for genetic and epigenetic reprogramming,” Master’s thesis, Massachusetts Institute of Technology, 2018.
- Elowitz MB, Leibler S. A synthetic oscillatory network of transcriptional regulators. Nature. 2000;403(6767):335.
- Miyamoto T, Furusawa C, Kaneko K. Pluripotency, differentiation, and reprogramming: a gene expression dynamics model with epigenetic feedback regulation. PLoS Comput Biol. 2015;11(8):e1004476.
- Schübeler D. Function and information content of DNA methylation. Nature. 2015;517(7534):321–326.
- Augui S, Nora EP, Heard E. Regulation of X-chromosome inactivation by the X-inactivation centre. Nat Rev Genet. 2011;12(6):429–442.
- Esteller M. CpG island hypermethylation and tumor suppressor genes: a booming present, a brighter future. Oncogene. 2002;21(35):5427–5440.
- Michalak EM, Burr ML, Bannister AJ, et al. The roles of DNA, RNA and histone methylation in ageing and cancer. Nat Rev Mol Cell Biol. 2019;20:573–589.
- Héberlé É, Bardet AF. Sensitivity of transcription factors to DNA methylation. Essays Biochem. 2019;63(6):727–741.
- Zhu H, Wang G, Qian J. Transcription factors as readers and effectors of DNA methylation. Nat Rev Genet. 2016;17(9):551–565.
- Hnisz D, Shrinivas K, Young RA, et al. A phase separation model for transcriptional control. Cell. 2017;169(1):13–23.
- Ali Al-Radhawi M, Del Vecchio D, Sontag ED. Multi-modality in gene regulatory networks with slow promoter kinetics. PLoS Comput Biol. 2019;15(2):e1006784.
- Érdi P, Tóth J. Mathematical models of chemical reactions: theory and applications of deterministic and stochastic models. Manchester (UK): Manchester University Press; 1989.
- Ali Al-Radhawi M, Angeli D, Sontag ED. A computational framework for a Lyapunov-enabled analysis of biochemical reaction networks. PLoS Comput Biol. 2020;16(2):e1007681.
- Wang J, Rao S, Chu J, et al. A protein interaction network for pluripotency of embryonic stem cells. Nature. 2006;444(7117):364.
- Hammachi F, Morrison GM, Sharov AA, et al. Transcriptional activation by Oct4 is sufficient for the maintenance and induction of pluripotency. Cell Rep. 2012;1(2):99–109.
- Shakya A, Callister C, Goren A, et al. Pluripotency transcription factor Oct4 mediates stepwise nucleosome demethylation and depletion. Mol Cell Biol. 2015;35(6):1014–1025.
- Chen T, Ueda Y, Dodge JE, et al. Establishment and maintenance of genomic methylation patterns in mouse embryonic stem cells by DNMT3A and DNMT3B. Mol Cell Biol. 2003;23(16):5594–5605.
- Hsieh C-L. The de novo methylation activity of Dnmt3a is distinctly different than that of Dnmt1. BMC Biochem. 2005;6(1):6.
- Medvedeva YA, Khamis AM, Kulakovskiy IV, et al. Effects of cytosine methylation on transcription factor binding sites. BMC Genomics. 2014;15(1):119.
- Hattori N, Nishino K, Ko Y-G, et al. Epigenetic control of mouse Oct-4gene expression in embryonic stem cells and trophoblast stem cells. J Biol Chem. 2004;279(17):17063–17069.
- Gritton KS, Seader J, Lin W-J. Global homotopy continuation procedures for seeking all roots of a nonlinear equation. Comput Chem Eng. 2001;25(7):1003–1019.