
 ?Mathematical formulae have been encoded as MathML and are displayed in this HTML version using MathJax in order to improve their display. Uncheck the box to turn MathJax off. This feature requires Javascript. Click on a formula to zoom.
Abstract
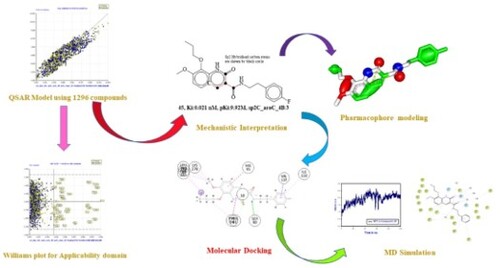
CB2R are fascinating targets for neuropathic pain and mood disorders because of their improved biological characteristics. Experimental data on 1296 cannabinoid-2 receptor inhibitors with different structural properties were used to develop a QSAR model following OECD guidelines. This study selected the best-predicted model (80:20 splitting ratio) with fitting parameters, such as R2:0.78; F:623.6, Internal validation parameters, such as Q2Loo:0.78; CCCcv: 0.87 and external validation parameters, such as R2ext:0.77; Q2F1:0.7730; Q2F2:0.7730; Q2F3:0.76; CCCext:0.87. Following this, another QSAR model was developed by using a 50:50 split ratio for thetraining and the prediction sets, which were then swapped to evaluate the robustness of the built QSAR model by the 50:50 ratio, which also gives a deeper understanding of the chemical space. In addition, we have confirmed the QSAR result with pharmacophore modelling, and supported by molecular docking, MD simulation, MMGBSA and ADME studies. Thus, this work may enable cannabinoid 2 receptor inhibsitor development.
GRAPHICAL ABSTRACT
Introduction
Marijuana, also known as Cannabis sativa L., has a long history of usage both in therapeutic contexts and as a recreational drug. Cannabinoids are a psychotropic substance class, including marijuana and its derivatives [Citation1]. G-protein-coupled receptors (GPCRs) like CB1R and CB2R are subtypes of the cannabinoid receptor superfamily. CB1R receptors are distributed throughout the central nervous system (CNS), where they regulate appetite and energy levels [Citation2]. This receptor is abundantly expressed in peripheral tissues, and it has been shown in animal experiments that cannabinoid receptor 2 (CB2R) agonists may alleviate inflammatory and neuropathic pain without causing euphoria [Citation3]. In treating immune-related diseases such as pain, necrosis, and osteoporosis, CB2R ligands have demonstrated encouraging outcomes in clinical studies [Citation2]. It has been hypothesized that the CB2R also has a role in controlling inflammatory and immunological responses. Several diseases and ailments, including cancer, AIDS, stroke, pain, obesity, cachexia, and neurodegenerative disorders including multiple sclerosis, Huntington's chorea, and Parkinson's disease, may respond favorably to CB treatment, as shown by pharmacological studies. In glaucoma patients, they may also help reduce blood pressure [Citation4]. Although CB2R is extensively expressed in immune system tissues such as the spleen, tonsils, and lymph nodes, its function in these organs remains unknown. CB2R receptors have been detected in many different types of cells, including neurons, astrocytes, cardiomyocytes, and endothelial cells [Citation5].
Numerous research has been conducted on WIN-55,212-2(WIN 55212-2 is an organic heterotricyclic compound that is 5-methyl-3-(morpholin-4-ylmethyl)-2,3-dihydro[1,4]oxazino[2,3,4-hi]indole substituted at position 6 by a 1-naphthylcarbonyl group), the first CB2R -selective ligand to be reported. The publicly available results for WIN-55,212-2's binding affinity at CB1R and CB2R receptors, thus, span a wide range [Citation1]. Richard Frederick Porter and his colleagues investigated the pharmacology of three new selective CB2R ligands that were chemically distinct from one another. These ligands were CB2R agonists, RO6871304 and RO6871085, as well as a CB2R inverse agonist, RO6851228 [Citation6]. Researchers found that RO6871304 and RO6871085 bound to the orthosteric location of CB2R by molecular docking. High-affinity binding to CB2R and selectivity for CB2R > CB1R were validated by binding studies and cell signalling tests with both RO6871304 and RO6871085 behaving as complete agonists in cAMP and ß-arrestin assays (EC50s in the low nM range) [Citation6]. Since then, various CB2R selective ligands have been developed, including cannabimimetic indoles like 1-(2,3-dichlorobenzoyl)−2-methyl-3-[2-[1-morpholino]ethyl]−5-methoxy indole (L768242) and 1-propyl-2-methyl-3-[1-naphthoyl]indole (JWH-015) [Citation7]. The selectivity of 146-fold for the CB2R receptor demonstrates that indole L768242 is highly selective for this receptor with the Ki value of 14 nM. Among the CB2R selective 1-deoxy and 1-methoxy-D8 -THC analogs synthesized by the Huffman group (Ki = 677-132 nM at CB1R and Ki = 3.4-1.0 nM at CB2 R), 1-deoxy3-(10,10 -dimethyl butyl)-D8 -THC (JWH-133) is one of the most selective agonists for the CBR 1-methoxy-3-(10,10-dimethylhexyl)-D8-THC (JWH-229) is another highly selective ligand with selectivity for the CB2R of more than 170:1 (Ki = 3134-110 nM at CB1R and Ki = 18-2 nM at CB2 R) [Citation8].
In toxicology, QSAR models may be found at the junction of chemistry, statistics, and biology. To design a new QSAR model, the following elements are essential: Three elements are necessary to identify and verify the relationship between the two data sets: (1) a dataset containing experimental measurements of biological activity or property for a group of experimentally tested compounds (the training set); (2) molecular structure and property data (i.e. the descriptors, or predictors); and (3) statistical techniques (often referred to as chemometric techniques) [Citation9]. QSAR, which stands for “QSAR,” describes the correlation between the biochemical activities of a class of compounds and their molecular blueprints. Regression or classification models may be used to find this connection. The discipline of rational drug-design relies greatly on this method for predicting the biological activities of novel pharmacological compounds [Citation10]. There has been a recent international trend towards using the QSAR approach by governments in place of costly and time-consuming animal testing of substances that could be hazardous [Citation11]. Whether or not QSAR models succeed depends on the validity of the dataset employed for developing them. PPB data are inherently heterogeneous due to the variety of methods used, experimental conditions, and endpoints manipulated. A wide range of computer simulation models exist, each with its own particular set of inputs and outputs [Citation10]. In silico approaches may be useful for screening huge quantities of compounds since they are efficient, quick, and inexpensive. Since its framework is enough, synthesis is not required; just analysis is required. In light of these benefits, we have made an effort in the current study to develop a QSAR model using a large dataset of compounds reported experimentally to inhibit cannabinoid 2 receptor (Ki).
The 3D-QSAR model developed by Robert Gunther and Culliges was based on an array of N-Aryl-oxadiazolyl-propionamides that are selective for cannabinoid 2 receptor. Their research, however, yielded no mechanically explicable results [Citation12]. Subsequently, Giuseppe Floresta and colleagues created two 3D 3D-QSAR models for predicting these ligands; these models have now proven to be an indispensable tool for the drug-design and optimization of CB1R and CB2R ligands [Citation13]. Critical interactions between CB1R and CB2R, and ligands may be better understood with the use of three-dimensional maps that depict hydrophobic, electrostatic, and shape-related characteristics. However, the significance of the discovery that inter-bonding distance is crucial to cannabinoid-2 receptor inhibition was minimized. Maria Fichera and coworkers also performed a 3D-QSAR investigation on the structural requirements for binding to CB1R and CB2R cannabinoid receptors and their selectivity [Citation14]. Despite the mechanical explanation offered by this work, it may not explain why hydrophobic and electrostatic atoms have such differing optimal bonding distances. However, the use of such QSAR models was severely constrained by the use of smaller data sets consisted of molecules with fewer scaffolds/pharmacophoric characteristics, hence limiting their usage in optimization to just a select few classes of compounds [Citation15–17].
When optimizing leads, it's helpful to do a QSAR analysis based on a more extensive dataset that includes a variety of scaffolds. Ideally, the larger dataset would have a good compromise between reasonable prediction ability and mechanistic interpretations. In light of these observations, we have conducted a QSAR analysis using a large dataset of 1296 experimentally reported compounds, and we have analyzed the critical structural and physicochemical factors for experimentally reported cannabinoid 2 receptor inhibitors. The purpose of this study is to develop a reliable QSAR model to identify the most important pharmacophoric feature for inhibiting cannabinoid type 2 receptors. We then performed molecular docking, MD, and MMGBSA studies once the QSAR model was developed.
Material and method
Modeling the link between a molecule's known characteristics (X) and its measured activity (Y) is at the heart of QSAR analysis. (OECD Principle 2, “unambiguous algorithms”) A model's algorithm is the link between molecular descriptors of the chemical structure and the biological activities [Citation9]. In this study, we searched the binding database to build the dataset for the QSAR analysis. Because of this, the data may be shown more precisely (https://www.binding.org/bind/chemsearch, retrieved on February 2, 2023) [Citation18]. This dataset included 1296 cannabinoid 2 receptor inhibitors with validated Ki values reported in nM. Bioactivity values were shown as Ki and span an extremely broad range (0.014–86980 nM) in this data set, making it both chemically and biologically distinct. shows five most active and five least active compounds from the dataset as an example. The experimentally reported Ki values obtained from binding database were first translated from nanomolar (nM) units to equivalent molar unit (M), using the formula pKi = -log Ki. See in Supplementary File T1 for the smile’s notation, Ki and, pKi values (See supplementary File S1 for binding database id, smiles, Ki, pKi value for 1296 dataset compounds).
Figure 1. Structural representations of the five cannabinoid 2 receptor inhibitors from the current dataset with the highest and lowest activity.
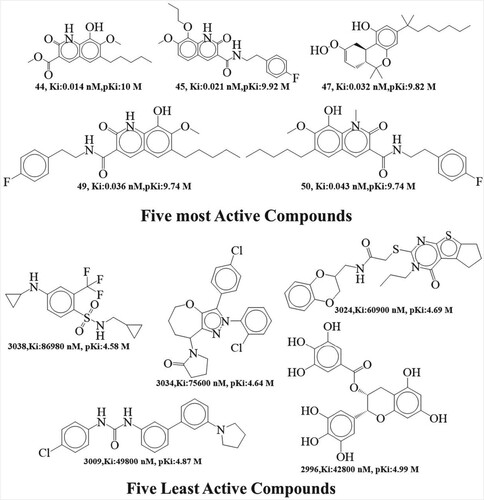
Table 1. Different molecular descriptors present in Model-A, Model-B, Model-C and their description.
ChemSketch was used to generate the 2D structures of all 1296 compounds, and the software programs open babel and open 3D align were used to transform the 2D structures into 3D structures [Citation19,Citation20]. PyDescriptor, a plugin for PyMOL's molecular modeling program, was then used to calculate the molecular descriptors for the geometry-optimized structures (See supplementary File S2 for the calculated molecular descriptor used in the QSAR model development) [Citation21].
PyDescriptor has a library of more than 40,000 chemical descriptors ranging from 1D to 3D. Data trimming is crucial when dealing with a large number of molecular descriptors. This was accomplished using Objective feature selection (OFS) in QSARINS v2.2.4 [Citation21]. The OFS method resulted in a limited collection of 1314 distinct molecular descriptors after removing duplicate and highly correlated ones (|R|> 0.90).
The entire dataset was split into two sets: a training set of 1037 compounds (80%) used to build a QSAR model and a prediction set of 259 compounds (20%) used to completely assess the accuracy and predictiveness of the developed QSAR models. This was done using the random splitting function of QSARINS v2.2.4. For subjective feature selection using the Q2LOO fitness parameter (SFS), QSARINS v2.2.4 uses genetic algorithm-assisted multiple-linear regression (GA-MLR) [Citation22,Citation23]. Several validation criteria, such as R2, leave-one-out (Q2LOO), and leave-many-out (Q2LMO), are used to assess the functionality of the developed QSAR models, which have been previously documented in the scientific literature. The intercorrelation between the characterizations might be reduced by using a QUIK (Q under the influence of K) value of 0.05. To test the data-fitting hypothesis, correlation coefficients are computed after 1000 iterations of the Y-axis [Citation24]. A single outlier may render a QSAR model less capable of making precise predictions. A measure of predictability is the degree of agreement between the predicted value and the expected or experimental value. We utilized such compounds in the Williams and In-subria plots to draw attention to the peculiarity of a very large residual value in GA-MLR QSAR models. By comparing the normal residual value with the predicted value, we could identify outlier compounds. We used the Williams plot to direct our database search for compounds with comparable structural properties. We have established the applicability domain of the developed QSAR model by combining leverage with the typical residuals.
The usage of a QSAR model that has undergone cross-validation, external validation, Y-randomization, and the applicability domain (Williams’ plot) for testing may be advantageous in future applications in virtual screening, molecular optimization, and decision-making [Citation25–28] (See Table 6 in Supplementary material file T1 for Golbraikh and Tropsha Acceptable Model Criteria). Moreover, the Table S3 of the Supplementary materials contains the formulae required to compute these descriptive statistics. The QSAR model's prospective utility (applicability domain) was also evaluated using Williams’ plots [Citation29–31]. Effective and validated QSAR modelling was accomplished via use of genetic functional algorithm and multiple linear regression. Researchers could make understand the pharmacophoric aspects that control particular biological activity and enable accurate prediction of biological activity of newly designed compounds (external) by applying this model. Accordingly, a state-of-the-art technique was implemented in which several models were built using just 20% of the prediction set and 80% of the training set. Researching the most precise prediction model is now possible. So, we used the original training set as our prediction set and tested a QSAR model with six distinct features
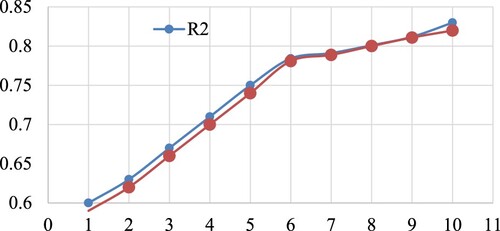
To prevent over- and underfitting, it is essential to include an adequate number of molecular descriptors in the QSAR model. Therefore, a simple graphical method was used to find the ideal number of descriptors for the model. When developing a multilinear regression (MLR) model, it is common to see a significant increase in the cross-validated coefficient of determination for leave-one-out (Q2LOO) when variables (molecular descriptors) are added in sequence [Citation32,Citation33]. The value of Q2LOO then slightly increases after that. As a result, it was found that the best number of molecular descriptors for building models was the number that matched the elevation point [Citation34] as shown in . Six chemical descriptions are represented by the last elevation point in . As a consequence, the heuristic search in the QSAR model employing multi regression analysis was limited to using just six chemical descriptors. In addition to employing Q2LOO as the fitness parameter and the genetic algorithm multilinear regression (hereafter GA-MLR) method using QSARINS-2.2.4, a set of molecular descriptors were created using the genetic algorithm as a feature selection strategy [Citation22].
Figure 2. Plot of the number of descriptors against leave-one-out coefficient of determination Q2LOO to identify the optimum number of descriptors.
Molecular docking analysis
The structure of the cannabinoid 2 receptor protein bound to the rationally designed AM10257 antagonist was obtained from the Protein Data Bank (https://www.rcsb.org/structure/5ZTY) and then loaded into an open-source molecular editor (Discovery Studio Visualizer 4.0) [Citation35]. Using a conjugate gradient of energy minimization method, the UCSF Chimera optimized the structure of 1296 molecules in the dataset.
By accessing the Protein Data Bank's structural database (https://www.rcsb.org/structure/5zty; retrieved on March 7, 2023), we have to retrieve a pdb file for cannabinoid 2 receptor protein. Pdb 5zty was chosen because of its higher X-ray resolution (2.8) and complete sequencing. Ramachandran's plot was generated to check the protein's stability before any docking simulations were performed. A docking study was performed on the optimized protein. The docking pose of the most active molecule, number 8, is given special attention in the mechanistic interpretation of QSAR, even though all 1296 compounds were docked. To validate the molecular docking protocol, we have redock the pdb:5zty ligand. To conduct the molecular docking study, the NRG Suite software was used. This open-source programme (NRG Suite) may be downloaded for free as an extension for PyMOL (www.pymol.org). FlexAID may be utilized in docking simulations to pinpoint protein binding sites and surface cavities [Citation36]. It gathers information on conformations using evolutionary techniques. In addition, it represents ligand and side chain flexibility and covalent binding. We optimized performance by using a versatile stiff docking strategy with the following NRGSuite settings by default: Structure of a Ligand. The conformity of a ligand is indicated by its assigned reference number. No restrictions are allowed. A 3D sphere of 5 Å provides binding sites, and the side chains are stiff. In the NRG suite, the active site is chosen by placing a sphere with its center in the active site's center (radius 5 in the current work). All residues within this sphere are automatically considered flexible by the software. Ligands’ adaptability is symbolized by a reference number. There isn't a cap. To shield water molecules, the HET group envelops them. Van der Wall's magnetic permeability was 1%. A population explosion reproduction model, a share fitness model, 1,000 generations, 1,000 chromosomes, five TOP complexes, and no information on the solvent are employed. Utilizing AM10257, a well-known cannabinoid 2 receptor inhibitor, as a test subject, molecular docking was confirmed.
ADMET and drug-likeness evaluation
Potential drugs ought to be safe and have good absorption, distribution, metabolism, and elimination (ADME) properties. SwissADME module available in SIB (Swiss Institute of Bioinformatics) webserver (https://www.sib.swiss) was used to assess the ADME profile of the five most active compounds from the QSAR dataset, including drug-likeness, partition coefficient, solubility, and several other parameters [Citation37–40].
Molecular Dynamics Simulation (MD-Simulation)
Using a dock complex for the cannabinoid 2 receptor protein (PDB ID: 5ZTY) and compound 8, MD simulations were run in triplicate on a Desmond 2020.1 from Schrodinger, LLC. To ensure that each MD run had consistent findings, several samples were obtained at the same times. The OPLS-1005 force field is combined with an explicit solvent model with SPC water molecules in this setup [Citation41]. To finish off the charge neutralization process, Na + ions were introduced. Physiological conditions were simulated by adding 0.15 M NaCl solutions system building. For the first 100 ns of retraining, an NVT ensemble has to acclimatize to the 8 combinations of protein and ligand. Following that, a 12-ns equilibration and reduction run was performed by an NPT ensemble. The Nose–Hoover chain coupling approach was used to build the NPT ensemble in all simulations, which were run at 27 °C, 1.0 ps relaxation time, and 1 bar pressure. A 2fs time step was chosen by consensus [Citation42]. Pressure was kept steady using the barostat technique, with a relaxation time constant of 2 ps [Citation43]. Particle mesh Ewald technique was used to simulate long-range electrostatic interactions with a radius of 9Å for the Coulomb interaction [Citation44]. The bonded forces for each trajectory were determined with the help of the RESPA integrator and a time step size of 2 fs. Multiple metrics, such as the number of hydrogen bonds (H-bonds), the root mean square deviation (RMSD), and the root mean square fluctuation (RMSF), were used to assess the reliability of the MD simulations. For a drug receptor complex, we used Geo measures version 0.872 to calculate the free energy landscape of protein folding [Citation45]. Using the MD trajectory, we visualized the root-mean-square-deviation (RMSD) and radius of gyration (Rg) energy profiles of folding in three dimensions using the Geo measurements function of the matplotlib Python package [Citation46].
Molecular mechanics generalized born and surface area (Mmgbsa) calculations
MD simulations of cannabinoid 2 receptor complexed with compound 8 were used to determine the binding free energy (Gbind) of the docked complexes. The generalized Born surface area (MM-GBSA) module in molecular mechanics is responsible for the current gold standard in sweeping. 2017-04-04. Schrodinger Suite, LLC., New York, New York. Using the VSGB solvent model and rotamer search methods, the binding free energy was determined with the help of the OPLS 1005 force field. The trajectories were recorded after the MD run at 10 ns intervals. The binding free energy was calculated using Equation 1:
Where, ΔGbind = binding free energy, Gcomplex = free energy of the complex, Gprotein = free energy of the target protein, and Gligand = free energy of the ligand.
Alterations to the MMGBSA result in trajectories that occurred after the dynamic phase were also studied.
Results
The purpose of this study was to develop a GA-MLR model that has robust interpretive methods and high predictive quality, as mentioned in the introduction. During the course of our investigation, we have uncovered some structural peculiarities. Here is the descriptor's meaning, the measured and predicted pKi value, and the statistical parameters used to validate the recently developed six-parameter model (See ). Creating QSAR models is the emphasis of this effort. Our earlier work [Citation47] describes how we utilized a randomly-divided dataset to build model B using MLR (Multilinear regression) models, and then tested those models on a separate dataset (the prediction set). By switching the training and prediction sets in model C, we were able to generate new multi-model ensembles and verify on the prediction set (which was previously the training set). In order to get the most out of the data and eliminate bias, we divided it down the middle. We've also created mode A, where the data set is split 80/20. (See Supplementary File S4 for the developed QSAR model A, B and C). In addition, the dataset splitting in model B & C was 50:50 to capture the maximum information and avoid any bias [Citation47,Citation48].
Model-A (80% training set (260 compounds) and 20% prediction/test set (1036 compounds))
pKi = 4.949 (± 0.099) + 2.813 (± 0.235) * acc_lipo_3Ac + 0.438 (± 0.024) * sp2C_aroC_4B + 0.186 (± 0.009) * sp3C_ringC_5B + 0.636 (± 0.049) * fringNsp3C5B + −0.505 (± 0.027) * famdNaroC6B + −0.8 (± 0.056) * plaN_don_9B.
Model-B (50% training set (648 compounds) and 50% prediction/test set (648 compounds))
pKi = 4.971 (± 0.125) + 2.765 (± 0.291) * acc_lipo_3Ac + 0.427 (± 0.03) * sp2C_aroC_4B + 0.182 (± 0.011) * sp3C_ringC_5B + 0.632 (± 0.061) * fringNsp3C5B + −0.492 (± 0.034) * famdNaroC6B + −0.783 (± 0.069) * plaN_don_9B +
Model-C (50% training set (648 compounds) and 50% prediction/test set(648 compounds)). In Model C, the training and prediction sets were swapped with each other. The dataset from model B was shifted from prediction to training set and training to prediction set in this model.
pKi = 4.988 (± 0.128) + 2.905 (± 0.27) * acc_lipo_3Ac + 0.443 (± 0.031) * sp2C_aroC_4B + 0.187 (± 0.012) * sp3C_ringC_5B + 0.636 (± 0.065) * fringNsp3C5B + −0.518 (± 0.036) * famdNaroC6B + −0.834 (± 0.075) * plaN_don_9B +
Statistical parameters associated with model-A
R2: 0.7842, R2adj: 0.7829, R2-R2adj: 0.0013, LOF: 0.2898, Kxx: 0.2869, Delta K: 0.0247, RMSEtr: 0.5321, MAEtr: 0.4461, RSStr: 293.6196, CCCtr: 0.8790, s: 0.5339, F: 623.6488, Q2loo: 0.7812, R2-Q2loo: 0.0030, RMSEcv: 0.5358, MAEcv: 0.4491, PRESScv: 297.6891, CCCcv: 0.8773, Q2LMO: 0.7809, R2Yscr: 0.0059, Q2Yscr:−0.0077, RMSE AVYscr: 1.1419, RMSEext: 0.5532, MAEext: 0.4781, PRESSext: 79.2655, R2ext: 0.7738, Q2-F1: 0.7737,Q2-F2: 0.7730,Q2-F3: 0.7667,CCC ext: 0.8748.
Statistical parameters associated with model-B
R2: 0.7833, R2adj: 0.7812, R2-R2adj: 0.0020, LOF: 0.2892, Kxx: 0.2811, Delta K: 0.0377, RMSEtr: 0.5278, MAEtr: 0.4427, RSStr:180.5247, CCCtr:0.878, s: 0.5307, F:386.0805. Q2loo: 0.7786, R2-Q2loo: 0.0047, RMSEcv: 0.5335, MAEcv: 0.4476, PRESScv:184.4442, CCCcv: 0.8758, Q2LMO: 0.7779, R2Yscr: 0.0093, Q2Yscr: −0.0125, RMSE AVYscr: 1.1284, RMSEext: 0.5468, MAEext: 0.4609, PRESSext: 193.7477, R2ext: 0.7799, Q2-F1: 0.7812, Q2-F2: 0.7772, Q2-F3: 0.7674, CCCext:0.8715.
Statistical parameters associated with model-C
R2: 0.7851, R2adj: 0.7831, R2-R2adj: 0.0020, LOF: 0.3057, Kxx: 0.2890, Delta K: 0.0234, MSEtr: 0.5427, MAEtr: 0.4593, RSStr: 191.4231, CCCtr: 0.8796, s: 0.5456, F: 391.4146, Q2loo: 0.7802, R2-Q2loo: 0.0049, RMSEcv: 0.5488, MAEcv: 0.4644, PRESScv:195.7845, CCCcv: 0.8768, Q2LMO: 0.7794, R2Yscr:0.0090, Q2Yscr: −0.0127, RMSE AV Yscr:1.1652, RMSEext: 0.5318, MAE ext: 0.4475, PRESS ext: 182.7116, R2ext: 0.7781, Q2-F1: 0.7794, Q2-F2: 0.7748, Q2-F3: 0.7936, CCCext:0.8783.
High values for a wide variety of statistical parameters, such as the coefficient of determination, the adjusted coefficient of determination(R2adj), the cross-validated coefficient of determination for leave-one-out (Q2LOO), the external coefficient of determination (R2ex), the number of replicates (Q2-Fn), the concordance correlation coefficient (CCCex), etc., show that models A, B, and C are statistically robust. As a result, model-A, B and C are capable of accurate extrapolation, has no false correlations, and fulfils established thresholds for its most crucial parameters. Using William's plot, we looked into the range of validity of the model's predictions. As such, it does all that the OECD recommends for a useful QSAR model. , and depicts a number of model-A, -B, and -C framework graphs.
Figure 3. Different graphs related to model-A (A) Experimental vs Predicted pKi values (the solid line represent the regression line); (B) Residual Plot for experimental vs residuals; (C) Williams’s plot for applicability domain (the vertical solid line represents h* = 0.020 and horizontal dashed lines represent the upper and lower boundaries for applicability domain); (D) In-Subira plot for the applicability domain analysis.
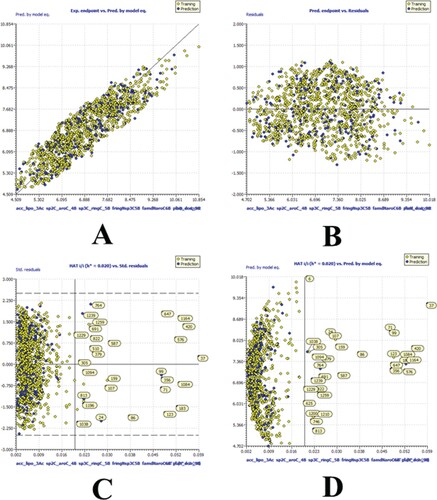
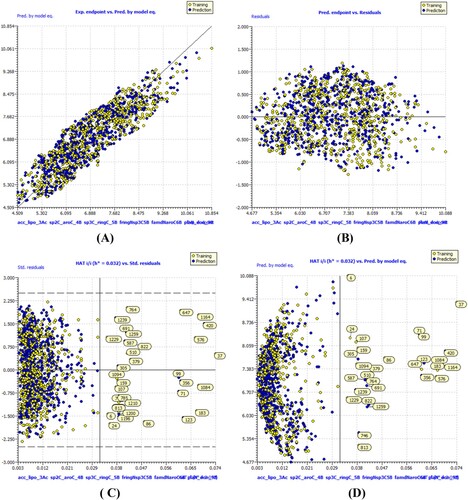
Figure 4. Different graphs related to model-B (A) Experimental vs Predicted pKi values (the solid line represent the regression line); (B) Residual Plot for experimental vs residuals; (C) Williams’s plot for applicability domain (the vertical solid line represents h* = 0.0320 and horizontal dashed lines represent the upper and lower boundaries for applicability domain); (D) In-Subira plot for the applicability domain analysis.
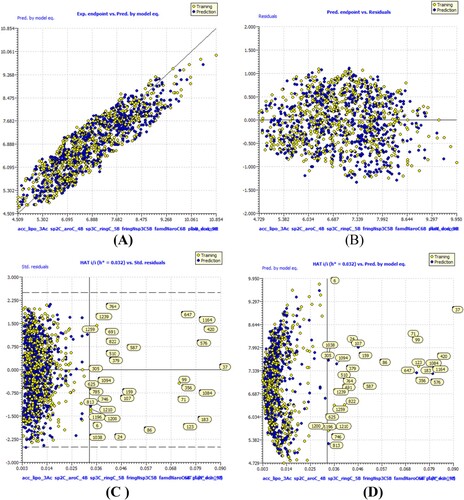
Figure 5. Different graphs related to model-C (A) Experimental vs Predicted pKi values (the solid line represent the regression line); (B) Residual Plot for experimental vs residuals; (C) Williams’s plot for applicability domain (the vertical solid line represents h* = 0.0320 and horizontal dashed lines represent the upper and lower boundaries for applicability domain); (D) In-Subira plot for the applicability domain analysis.
lists Model-A, B and C's six distinguishing features. In all the three developed QSAR models, raising the value of four of the six descriptors (acc_lipo_3Ac, sp2C_aroC_4B, sp3C_ringC_5B, and fringNsp3C5B) is associated with an increase in bioactivity. In contrast, the remaining two (famdNaroC6B and plaN_don_9B) have a negative coefficient. Each molecular descriptor, a quantitative representation of structural properties, is associated with many pharmacophoric variables that control the inhibitory profile. Not a single structural characteristic can be used to describe or characterize the final biological activity (Ki) of a molecule. The biological activity, Ki, etc., is the consequence of an interplay between several structural features and additional, as-yet-unknown factors. Some properties aid in the desired pharmacological effect, while others inhibit it. Two or more pharmacophoric groups may work together to provide a greater biological effect (a phenomenon called “Pharmacophore synergism”).
Table 2. Depiction of the Docking Score and RMSD values for pdb:5zty ligand and the top 10 most active compounds.
Correlation matrix
The inter-correlation coefficient cutoff in the existing QSAR model is set at 0.95 to minimize overfitting. Table 2, 3 and 4 in Supplementary File T1 shows that there is no correlation among any of the descriptors used in the current QSAR model.
Applicability Domain analysis
We assessed the generated QSAR model's applicability domain with regards to the whole 1296-sample dataset. In the Williams plot and in-subria plot, total of 1296 compounds, it was found that about 30 compounds fall outside the applicability domain, and were indicated as outliers. The overall HAT i/i h* = 0.03200 value for leverage was found to be rather low (D and D). Based on the findings, just a small percentage (2%) of the compounds in the present dataset fall outside of the applicable range (applicability domain). Therefore, the created QSAR model is accurate in its predictions and reliable in terms of its domain of applicability.
Molecular docking analysis
The molecular docking study was performed on the 1296 dataset compounds and the docking score for the pdb 5zty and the top 10 most active compounds are presented in . For the validation of molecular docking protocol, we have performed redocking of pdb:5zty ligand into the cannabinoid 2 receptor binding pocket. The docking score for entire 1296 compounds are given in Supplementary material File S5.
In CB2R receptor, helices I through VII form the 7TM bundle of CB2R, while helix VIII is an intracellular amphipathic helix. The CB2R receptor's extracellular loop and helices I through VI are mostly contacted hydrophobically and aromatically by the pdb:5zty ligand. The central pyrazole ring established pi-pi-T shaped contact with Phe183 and carbon hydrogen bond His95 residues of helices II, III, and VII. Later, the His95 and Phe94 residues of helices II and III made pi-alkyl and alkyl hydrophobic interactions with the 4-methyl substituent of the pyrazole ring. To add further, the N-pyrazole substituted 5-hydroxypentyl exhibited a Pi-hydrogen bond donor contact with Ser285 residue through its hydroxy group and one alkyl hydrophobic contact with Phe281 residue. Another terminal containing an adamantane ring entered into six hydrophobic alkyl and Pi-alkyl contacts with the Phe94, Ile110, Val113, and Phe106 residues that are a part of helices II and III, in addition to the terminal 5-phenyl substituent making two hydrophobic contacts with Lys287 and Ala282 residues.
Discussion
Mechanistic interpretation of molecular descriptor and molecular docking analysis
acc_lipo_3Ac indicate the sum of partial charges of lipophilic atoms within 3 A.U. from acceptor atoms. In the QSAR model that was built, this descriptor received a positive coefficient, which meant that its value grew and the cannabinoid receptor inhibitory impact also did. Use of a novel chemical descriptor, such as flipoacc3B (frequency of occurrence of acceptor atom exactly at 3 bonds from the lipophilic atoms), significantly improves the statistical performance (R:0.96) of the developed QSAR model. Binding affinity seems to be controlled simply by increasing the number of lipophilic atoms like carbon atoms. The optimal combination comprises an acceptor that is precisely three bonds away from lipophilic atoms, resulting in the maximum feasible amount of inhibition of cannabinoid 2 receptor protein. Moreover, the optimal bonding distance between an acceptor and a lipophilic atom is three bonds, as shown by recent research; this is especially crucial for maximizing the cannabinoid receptor inhibitory effect. This molecular descriptor can be demonstrated by comparing Compound 2 to Compound 255. This finding is supported by further pairs of compounds, including the following: 16 with 382, 597 with 1208, 1540 with 1583, 1804 with 2162, 219 with 304, 320 with 373, 382 with 383, and 483 with 537.
It is essential to note that the compound with the best activity profile had partial charges that were closer to zero (acc_lipo_3Ac). On the other hand, it was discovered that the molecule had a negative value for the molecular descriptor. The molecular pair 39 (Ki: 0.036 nM, pKi:10.44M, acc_lipo_3Ac:0.030) and 931 (Ki:15 nM, pKi: 7.58 M, acc_lipo_3Ac: −0.061) provide credence to this discovery (See ). This observation additionally showed that positively charged lipophilic atoms have a greater impact on the inhibition of cannabinoid 2 receptor inhibitory activity. Conforming to the pharmacophore model, a lipophilic atom is located precisely three bonds away from the acceptor atoms in the most active molecule, number 8. Thus, QSAR and pharmacophore modeling produced identical outcomes.
Figure 6. Depiction of the molecular descriptor acc_lipo_3Ac for the compounds 8 and 255 only. Presentation of the 2D interaction with CB2R and pharmacophore model for the compound 8.
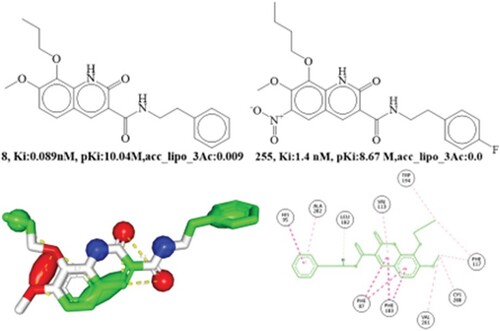
CB2R is gaining attention as a potential therapy for neuroinflammation, neurodegenerative diseases, neuropathic pain, and inflammatory and inflammatory pain. Recent studies have shown that CB2R antagonists may reduce renal fibrosis [Citation49] and that they may delay tumour growth [Citation50] as potential treatments for fibrotic illnesses and cancer. Consistent with previous reports, compound 8 adopts an orthostatic conformation in the cannabinoid 2 receptor binding pocket due to the abundance of electrons in binding pocket. In a molecular docking investigation, the active component, Compound 8, had a docking score of −7.60 kcal/mol (RMSD:1.40 Å), and binds to a cannabinoid 2 receptor protein via hydrophobic and aromatic contacts involving ECL2 residues and helices II, III, V, and V.
Additionally, through its central 1,2-dihydroquinoline ring, compound 2 forms five hydrophobic connections with Phe87, Phe183, and Val113. The dihydroquinoline ring extends very little towards the third and fifth helices. Two hydrophobic contacts were observed between the terminal phenyl ring and His95 and Ala282 in helices II and III. Four hydrophobic contacts were established between Trp194, Phe117, Cys288, and Val261 by the 7-methoxy and 8-propoxy moieties, which were aligned loosely with helices III and V. Similarly, to the pdb:5zty ligand, compound 8 was shown to have a favorable interaction with the CB2R protein in the docking investigation. The lipophilic atom was found to interact with both aromatic and hydrophobic groups in compound 8, supporting its importance in the QSAR. As a consequence, the outcomes of the molecular docking experiments support the QSAR and pharmacophore modeling findings.
The molecular descriptor sp2C_aroC_4B points out the, occurrence of number of sp2 hybridized carbon atom within 4 bonds from the aromatic carbon atoms. Adding more of these combinations into the model may increase the Ki value since the aforementioned molecular descriptor has a positive coefficient in the proposed model (R2: 0.006). This descriptior highlights the significance of aromatic and sp2 hybridized carbon. By comparing the compound 45 with 216 (See Figure ), this may be observed. Interestingly, Carbon in both locations infers a lipophilic character which is crucial for cannabinoid receptor inhibition. Thus, increase in the number of such aromatic carbon atoms and carbon atoms that have undergone sp2 hybridization are essential for cannabinoid 2 receptor inhibition. When the molecular descriptor sp2C_aroC_4B has been substituted with a comparable molecular descriptor such as faroCsp2C3B (frequency of occurrence of sp2 hybridized carbon atom exactly at 3 bonds from the aromatic carbon atom), the developed QSAR model's statistical performance (R:0.78) slightly decreases.
Figure 7. Presentation of molecular descriptor sp2C_aroC_4B for the compounds; 45 and 216. Depiction 2D interaction and Pharmacophore model for the compound 45.
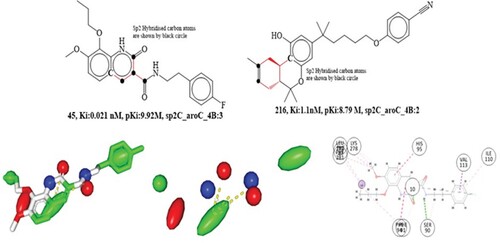
The statistical performance (R:0.92) of the proposed QSAR model has also been greatly enhanced by the replacing the molecular descriptor sp2C_aroC_4B with sp2C_aroC_9B (presence of aromatic carbon atom within 9 bonds from the sp2 hybridized carbon atoms). The findings demonstrate that increasing the bonding distance between sp2C and aroC to 5 or 6 greatly increases the inhibitory effects on cannabinoid 2 receptor. Additionally, the statistical performance suffers meaningfully (R:0.76) when the molecular descriptor sp2C_aroC_4B is altered to ringC_sp2C_1B (presence of sp2 hybridized carbon atom within 1 bond from the ring carbon atom). This observation reveals that the improved cannabinoid 2 receptor inhibition requires aromatic ring carbon atoms in addition to bonding distances higher than 4 bonds.
There are 150 of these active compounds in the dataset, and they all have pKi values between 10.85 and 8.03 M and a high value of the chemical descriptor sp2C_aroC_4B (between 4 and 6). This may explain why certain quinoline derivatives have better Ki values. Nashaat Turkman and coworkers described a variety of quinoline derivatives, underlining the role of the aromatic ring in the dramatic enhancement of quinoline's inhibitory effect on cannabinoid receptor. Cannabinoid receptor inhibitory activity is largely determined by the substitution at the C-8 position of the aromatic quinoline ring [Citation1]. QSAR data are presented in the form of a molecular descriptor, sp2C_aroC_4B, which captured the same aromatic carbon atom as well as the C-8 atom located within 4 bonds from the sp2 hybridized carbon atom, thus supporting the reported findings. We have also built a pharmacophore model for molecule 45 in which aromatic carbon atom from the QSAR model is modelled as a hydrophobic pharmacophore, while C-4 carbon atom, which is four bonds distant from the aromatic carbon in the 1,2-dihydroquinoline ring, were shown as a hydrophobic pharmacophore. Thus, revealing the congruence between the observation obtained by the QSAR and pharmacophore models. Additionally, the compound 45 performed well in molecular docking studies, with a docking score of −7.97 kcal/mol (RMSD:1.77Å). The primary modes of interaction between compound 45 and cannabinoid receptor were hydrophobic and hydrogen bonding interactions. Two hydrophobic contacts with Phe91 and His95 residues, pointing towards helices II and III of the cannabinoids 2 receptor protein, were formed by the 1,2-dihydroquinoline ring in compound 45, which includes an aromatic carbon atom and is sp2 hybridized. The observation of molecular docking studies matches with the QSAR investigation.
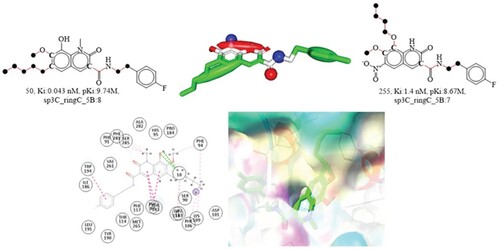
The molecular descriptor sp3C_ringC_5B represent the occurrence of number of sp3 hybridized carbon atoms within 5 bonds from the ring carbon atoms. In the developed QSAR model, this chemical descriptor has a positive coefficient of R2:0.01, suggesting that increased numbers of it may be used to boost the cannabinoid receptor inhibitory impact. The difference in bioactivity profile of the compounds 50 and 255 support this recent finding. Compound 50 has eight and compound 255 has seven of these ring carbon atoms, hence an increase of only one carbon atom increases the Ki value. This may explain why the compounds 50 and 255 has two distinct Ki values (See ). Addition of mere single carbon atom may increase the cannabinoid 2 receptor inhibitory effect. To elaborate, the cannabinoid receptor inhibitory efficacy is increased by around 11 times if the value of the molecular descriptor sp3C_ringC_5B for molecule 255 is raised from 7 to 8. Substituting the sp3C_ringC_5B molecular descriptor with the corresponding H_ringC_6B molecular descriptor (presence of ring carbon atom within 6 bonds from the hydrogen atoms) somewhat improves the statistical result (R:0.86). Supporting this, hydrogen atoms are more effective in increasing the activity of cannabinoid 2 receptor inhibitors than sp3 hybridized carbon. The finding also implies that future structural designs should have fewer sp3 hybridized carbon atoms since they increase the steric bulk whereas hydrogen, the lightest element, decreases it.
Figure 8. Depiction of the molecular descriptor sp3C_ringC_5B for the compounds 50 and 255 only (Black dot indicates sp3 hybridized carbon atoms). Presentation of 2D and 3D interactions of compound 50 with the cannabinoid receptor. The pharmacophore model for the compound 50 (blue-donor, red-acceptor and green hydrophobic)
An ethylene linker is 100 times more effective than a methylene linker in joining an amide bond to a phenyl ring, based on studies conducted by Nashaat Turkman and colleagues. An increase in lipophilicity might explain this observed difference. Since both features such as an ethylene linkage captured as an sp3 hybridized carbon atom with fewer than five bonds from the ring carbon atom, QSAR results are acceptable with the reported literature [Citation1].
Compound 50 is found to be buried inside the cannabinoid receptor binding pocket, with a docking score of −8.74 kcal/mol and a root-mean-square deviation (RMSD) of just 2.14Å. Compound 50 mimicked the pdb ligand's conformation by binding to identical residues (Phe281, Phe183, etc.). The dihydroquinoline ring formed three hydrophobic pi-pi T-shaped contacts with the Phe87 and Phe183 amino acid residues. The 6-pentyl group interacted hydrophobically with amino acid residues PHE94, Lys109, Phe106, Val103, and Phe281 through alkyl and pi-alkyl interactions. Hydrophobic pi-pi T-shaped contact is made by the dihydroquinoline ring with the Phe87 and Phe183 amino acid residues, and the ring carbon atoms described in the chemical description sp3C_ ringC_5B correspond to the dihydroquinoline ring. In addition, a pi-pi T-shaped hydrophobic interaction was observed at the 6-substituted pentyl moiety. Therefore, the QSAR-identified pharmacophoric features play an active role in interactions with the cannabinoid receptor. Moreover, the results of molecular docking studies are consistent with those of QSAR analyzes. QSAR modeling of the compounds’ pharmacophores reveals some intriguing insights about the pharmacophoric characteristic of the compounds. In pharmacophore modeling, the carbon atoms at the terminal of the fluorinated phenyl ring and the C-2 and C-3 sp3 hybridized carbon atoms of the pentyl substituent displayed hydrophobic features. Since the cannabinoid receptor interactions also involved the same features, thus QSAR results ideally agree with the pharmacophore modeling and molecular docking studies.
fringNsp3C5B signify the frequency of occurrence of sp3 hybridized carbon atoms exactly at 5 bonds from the ring nitrogen atoms. Increasing this molecular descriptor value results in more cannabis inhibition due to its positive coefficient in the derived QSAR model (R2:0.05). Compounds 16 and 909 are useful for illustrating this finding. Compound 16 contains three sp3 hybridized carbon atoms, precisely positioned 5 bonds from the ring nitrogen atom, while compound 909 has just one. This could draw attention to the differences in bioactivity between compounds 16 and 909 (See ). To this end, it may be beneficial to increase the cannabis inhibitory efficacy by including a sp3 hybridized carbon atom, such as a CH3 moiety.
Figure 9. Depiction of the molecular descriptor fringNsp3C5B for the compounds 16 and 909 (Black dot indicates sp3 hybridized carbon atoms). Depiction of 2D and 3D interactions of compound 16 with cannabinoid 2 receptor.
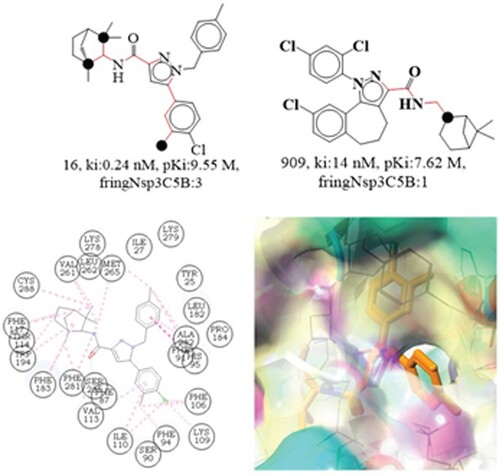
The Ki value for molecule 909 may be increased by 1.93 units (an 85-fold increase in cannabinoid 2 receptor inhibitory efficacy) if the molecular descriptor value is raised from 1 to 3.
Compound 16, also known by its synthesized name SR-144528, was purportedly designed to be selective for the cannabinoid receptor type 2 (CB2R) [Citation51]. By switching out the benzyl moiety for a phenyl one, Elena Cichero and Culliges demonstrated that SR144528 may antagonize CB2R, and they also highlighted the importance of the amide function having a bulky hydrophobic group in describing the compound's effect. A cyclohexene ring with a methylene bridge in the para position connects the amide and pyrazole rings in the bulky group, which has a sp3 hybridized carbon atom precisely five bonds distant from the ring nitrogen (pyrazole) atoms. In the refined docking solution for SR144528, the nitrogen atom in position 2 of the pyrazole moiety executed Hydrogen bonding interactions with the T118 and S165 side chains, while the carbonyl oxygen forms Hydrogen bonding interactions with the S165 and S161 side chains. Since the nitrogen atom in the pyrazole ring is precisely five bonds away from the carbon atom that has undergone sp3 hybridization, which is the same nitrogen atom that was captured by the molecular descriptor fringNsp3C5B. The 4-chloro, 3-methyl-phenyl at position 5 of the pyrazole ring anchored with L167 and L195 and formed van der Waals contacts with Y190 and W194. Similar methyl groups were also detected by the QSAR model, however this time they were identified as sp3 hybridized carbon atoms. The residues such as; I110, P168, and L169 of the hydrophobic CB2R cavity were pointed towards benzyl group at the pyrazole moiety position 1 in the compound. The norbornane section, however, was exposed to L160, V164, F197, and F202 [Citation52]. The observation demonstrates that the pharmacophoric characteristics, such as the ring nitrogen and the sp3 hybridized carbon atom, recorded in the QSAR model were also found to be involved in the reported molecular docking interactions of SR-144528. Thus, the QSAR findings are in complete agreement with the reported findings.
The goal of the molecular docking experiment was to identify the structural motif responsible for compound 16's binding and orientation. Compound 16 had a docking score of −8.83 kcal/mol (RMSD:1.81Å) and interacted with the cannabinoid receptor mostly via hydrophobic interaction. Phe281, Phe182, Phe117, Thr114, Cys288, Val261, Leu262, Met265, and Trp194 all interact hydrophobically with the sp3 hybridized carbon atoms. Selectivity for the cannabinoid 2 receptor is claimed to be influenced by the Phe91 and Phe183 residues [Citation53]. Compound 16 has a captivating hydrophobic contact between the Phe281 residue and its sp3 hybridized carbon atoms, which are 5 bonds from the ring carbon atom (similar to a pyrazole ring). According to QSAR results, the structural features identified in several studies have a significant influence in choosing the cannabinoid 2 receptor. Therefore, the QSAR results agree with the molecular docking studies and reported findings.
The molecular descriptor famdNaroC6B indicates the frequency of occurrence of aromatic carbon atoms exactly at 6 bonds from the amide nitrogen atoms. In the developed QSAR model, this parameter exhibits a negative coefficient, indicating that increasing its value may reduce the cannabinoid receptor inhibitory behaviour. Comparison of compounds 1284 and 176 support this observation. Compound 1284 has one such aromatic carbon atom exactly 6 bonds from the amide nitrogen atom, while 1284 is devoid of this identical aromatic carbon atom. As a result, this may explain why compound 176 has a higher Ki value than compound 1284. An idea to improve the bioactivity profile (Ki) of compound 1284 is to shorten the distance between the amide-substituted phenyl ring and the fluorine-substituted aromatic ring, as seen in compound 176, where the similar aromatic carbon atom is located 5 bonds from the amide nitrogen atom. Thus, based on this observation, a better bioactivity profile can be achieved by enhancing the bonding distance between the aromatic carbon and the amide nitrogen (See Figure ).
Figure 10. Presentation of the molecular descriptor famdNaroC6B for the molecule 1283 and 176 only.
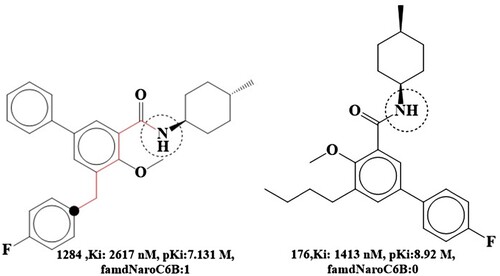
The pKi value for molecule 1284 would increase by 1.79 units (about 61-fold) if the molecular descriptor were changed from 1 to 0 (by shortening the bonding gap between two phenyl rings from 6 to 5).
To emphasize the impact of amide substitution on cannabinoid receptor inhibitory activity and selectivity profile, Simone Bertini and Cilligeas published a variety of biphenyl carboxamide derivatives. Dataset compound 176 was synthesized as cis and trans isomers of 4-methyl cyclohexyl carboxamide were further isolated. Interestingly, Substitutions on the amide nitrogen, such as cycloheptyl and 4-methyl cyclohexyl, were shown to significantly alter the cannabis inhibition, with the cycloheptyl substitution exhibiting more potent inhibition and higher inhibition selectivity [Citation54]. Thus, QSAR results are consistent with the published data since the identical nitrogen atom was shown to be a donor feature.
The molecular descriptor plaN_don_9B represents the occurrence of donor atoms within 9 bonds from the planer nitrogen atoms/ The pKi value is correlated with this descriptor at an R2 of 0.02. Increasing this descriptor's value decreases the pKi for cannabinoid 2 receptor, since its coefficient is negative in the QSAR model. The comparison between compound 118 and compound 161 support this finding. Compound 118 has a planer nitrogen atom but no donor feature, hence its Ki value is greater than that of compound 161, which has a donor atom located within 9 bonds away from the planer nitrogen. This may explain why compounds 118 and 161 have different bioactivity profiles. Additionally, a methyl substituent on the nitrogen ring likely nullifies the donor characteristic seen in molecule 118, which showed evidence of amine nitrogen between its phenyl ring and sulphonyl group. Subsequently, compounds 118 and 161's pharmacophore models supported this conclusion (See ).
Figure 11. Presentation of the molecular descriptor plaN_don_9B for the compounds 118 and 161 only.
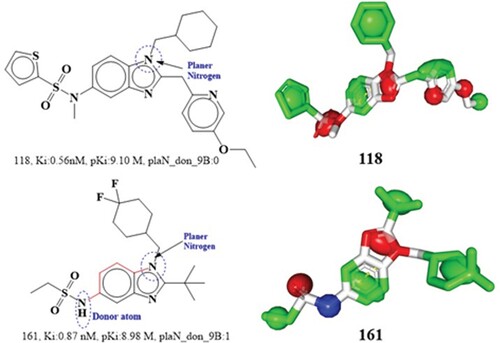
Based on the pharmacophore model, the nitrogen atom in position 5 of the benzimidazole moiety in compound 118 acts as an acceptor, whereas the same nitrogen atom in compound 161 acts as a donor. This indicates agreement between QSAR and pharmacophore modelling outcomes. Therefore, it is recommended that the methyl substituent on the nitrogen ring be maintained in future drug-design and structural optimization in order to maximize cannabinoid 2 receptor inhibition. Subsequently, comparison of some more molecular pair also support this observation; 16(Ki:0.24 nM, pKi:9.55M, plaN_don_9B:1) and 34 (Ki:0.37, pKi:10.85, plaN_don_9B:0), 392(Ki:2.78 nM, pKi:8.38 M, plaN_don_9B:0) and 697(Ki:7.4 nM, pKi:7.88M, plaN_don_9B:1),412(Ki:2.9nM, pKi:8.35M, plaN_don_9B:1) and 751(Ki:8.7nM, pKi:7.80 M, plaN_don_9B:2). There are 130 compounds with descriptor values between 1–3 in the full dataset and another 40 with descriptor values of 0 or 1. These results provide credence to the hypothesis that lowering the molecular descriptor value increases its cannabinoid 2 receptor inhibitory activity.
ADMET and drug-likeness evaluation
The SwissADME database contains information on a compound's pharmacokinetics, toxicology, and other important aspects of its medicinal chemistry. There are two physicochemical parameters that are given significant weightage: the partition coefficient and the solubility. The consensus log Po/w is the average of the five methods’ predictions [Citation37,Citation38]. All of the five compounds have LogP values between 3.7 and 6.1, as predicted. All five of these compounds have the required characteristics to be considered as drug like candidates, despite the fact that a compound's LogP value does not necessarily correlate to a specific ADME characteristic [Citation39,Citation55]. On the other hand, three distinct methods were used to predict solubility, each yielding a LogS value. Although the results varied significantly amongst techniques, it was generally expected that the top five active compounds would be the soluble, moderately and poorly water-soluble. In contrast to the other approaches [Citation40,Citation56,Citation57], which are based on the whole molecular topology, the SILICOS-IT (http://silicos-it.be.s3-website-eu-west-1.amazonaws.com/software/filter-it/1.0.2/filter-it.html)method uses a fragment-based approach in its LogS calculation.
ADME modeling revealed that the analog compounds possess a number of advantageous ADME properties. Based on the ratio of WlogP to tPSA [Citation58], it was predicted that all of the compounds have adequate absorption in the GIT, with the exception of compound 5, which exhibited poor GI absorption, and compound 4, which penetrates the blood–brain barrier. It is noteworthy to mention that the nitrogen-containing ring in compound 4 contains a methyl substituent on the nitrogen ring; thus, this may be the reason for compound 4's brain penetration. Compound 5 is the only one of the five that shows a predisposition to function as a P-gp substrate, which is rather interesting. P-glycoprotein is an essential xenobiotic transporter that is overexpressed in cancers that are resistant to several types of treatment [Citation59]. This data suggests that scaffolds 1–3 (compounds 1–3) may be useful as cannabinoid 2 receptor antagonists. The possibility of a CYP450-mediated biotransformation may also be predicted using SwissADME. Compounds 2, 4, and 5 would interact with CYP1A2 isoforms, and the results demonstrated that the vast majority of compounds interact with at least one of the five isoforms. In addition, it's possible that compound 5 has no interactions with CYP2D6 or CYP3A4 isoforms. In addition, it was found that isoforms 1A2 and 2C19 would be the primary targets of the majority of the compounds, whereas compounds 1–4 interacted with isoform 3A4 with the exception of compound 5.
In the first stages of drug discovery and development, drug-likeness is a crucial criterion for evaluating potential drug candidates. This metric may be thought of as a means to connect the physicochemical properties of a substance to its biopharmaceutical properties in the human body, particularly its impact on bioavailability when administered orally [Citation60]. Compounds 3 are likely drug-like candidate if the webserver's application of five widely-used drug-likeness criteria [Citation37] is taken into account. In addition, the compounds were evaluated using ABS criteria [Citation61], and every one of them scored a 0.55. This criterion relies on the probability value of a molecule having an optimal bioavailability and permeability profile, where a value of 0.55 signifies the obedience of Lipinski rule of five [Citation62] and 55% chance of rat bioavailability value greater than 10%. (See supplementary file S6 for various ADME features).
Molecular dynamics and simulation analysis
Cannabinoid 2 receptor protein (PDB ID: 5ZTY) was bound to compound 8 in a molecular dynamics (MD) study to examine the complex's stability and convergence (See ). It was established that the conformation was stable by comparing the RMSD values at intervals of 100 ns throughout the simulation. The RMSD quantifies the usual scatter of a sample of atoms relative to some standard. Every single moment captured along the path is successful. The RMSD for frame x is:
where N is the total number of atoms in the selection, tref is the reference time, and t is the current time (typically the first frame is used as the reference, hence time t = 0 is used for this expression). frame x, where r’ is the position of the chosen atoms at time tx relative to the reference frame. Each next frame in the simulation is generated using the same method [Citation63]. Throughout the protein chain, root-mean-square fluctuation (RMSF) can be used to characterize localized changes. The RMSF for residue I am:
Table 3. Depiction of the average value from replicate runs of MD simulation parameters such as; RMSD, RMSF, and ROG (Radius of gyration).
The square distance between the residue's atoms is determined by taking an average, as shown by the brackets. where T is the time in the trajectory from which the RMSF was calculated, tref is the reference time, and ri is the location of the residue. The atomic positions in residue I are given by r’, which is then overlaid on the reference. Desmond's simulated travel paths were analyzed. Using MD trajectory analysis, we determined the root mean square deviation (RMSD), root mean square fluctuation (RMSF), and protein–ligand interactions. Visualization of time-dependent variation in protein root-mean-square-deviation (RMSD) values is provided (left Y-axis). Once all protein frames have been superimposed on the backbone of the reference frame, the RMSD is computed by selecting individual atoms to compare.
The root mean square deviation (RMSD) between the C-backbone of compound 2 and cannabinoid 2 receptor (PDB Id: 5ZTY) is 1.95. This may be seen in A. RMSD graphs before and after simulation reveal the stability of the compound 8-bound cannabinoid 2 receptor (PDB I.D.: 5ZTY) complex. This stability suggests that the high stability of this complex is due to strong ligand binding. It is also possible to quantify the compactness of the protein based on its radius of gyration. In C, we can see that the Rg values for the protein–ligand complex in its compact compound 8 bound states are 23, 21, and 27, respectively (See Table 5 in Supplementary File T1). Overall quality analysis using RMSD and Rg demonstrated that Compound 8 significantly influenced the stability of the protein targets via contacts formed deep within the binding cavities.
Figure 12. A. MD simulation trajectory analysis of RMSD of compound 8 bound with 5zty, 100 ns time frame in triplicate displayed: R1 (replicate 1) RMSD plot of compound 8 bound cannabinoid 2 receptor (PDB I.D: 5zty) (navy blue); R2 (replicate 2) RMSD plot of compound 8 bound cannabinoid 2 receptor (PDB I.D: 5zty)(peacock green); R3 (replicate 2) RMSD plot of compound 8 bound cannabinoid 2 receptor (PDB I.D: 5zty)(ash color); B. RMSF analysis of compound 8 bound cannabinoid 2 receptor (PDB I.D.: 5zty). R1 (replicate 1) H-bond plot of compound 8 bound cannabinoid 2 receptor (Green). R2 (replicate 2) compound 8 bound cannabinoid 2 receptor (PDB I.D.: 5zty) (dark grey). R2 (replicate 2) compound 8 bound cannabinoid 2 receptor (PDB I.D.: 5zty) H-bond plot of compound 8 bound cannabinoid 2 receptor (dark red); R3 (replicate 3) compound 8 bound cannabinoid 2 receptor (PDB I.D.: 5zty); C.R1 (replicate 1) ROG plot of compound 8 bound cannabinoid 2 receptor (PDB I.D.: 5zty) (light pink); R2 (replicate 2) ROG plot of compound 8 bound cannabinoid 2 receptor (PDB I.D.: 5zty) (parrot green); R3 (replicate 3) ROG plot of compound 8 bound cannabinoid 2 receptor (PDB I.D.: 5zty) (peacock gold); H-bond plot of compound 8 bound cannabinoid 2 receptor (chocolate color); D. R1 (replicate 1) RMSF plot of compound 8 bound cannabinoid 2 receptor (PDB I.D.: 5zty) (olive red); R2 (replicate 2) RMSF plot of compound 8 bound cannabinoid 2 receptor (PDB I.D.: 5zty) (cream); R3 (replicate 3) RMSF plot of compound 8 bound cannabinoid 2 receptor (PDB I.D.: 5zty) (peacock pale peacock green).
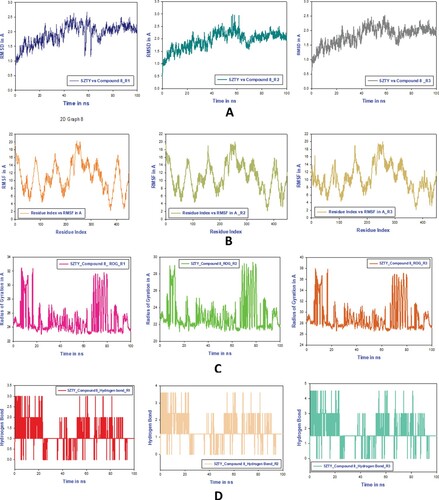
Then, using a time function of 100 ns, we found that a few residues in the combination of compound 8 and cannabinoid 2 receptor exhibited large root mean square fluctuations (RMSF). In the RMSF image, the portions of the protein that saw the largest amount of fast change during the simulation were shown as peaks. Secondary protein structures, such as alpha helices and beta strands, are often more stable than loop portions, despite the unstructured protein core's greater flexibility.
Most of the peaking residues, according to MD trajectories, are found in loop regions. B shows that residues R1, R2, and R3 at the binding site have very low RMSF values, indicating that the ligand is tightly bound to the protein. displays the outcomes of three separate simulations conducted using IKKB and their respective results. Despite the fact that there are still some wavering peaks, as shown in , the complex has levelled off. In this particular instance, the values of RMSF are just right for stabilizing the protein–ligand combination. The RMSF plots demonstrated that there was a discernible rise in the amount of structural variation in proteins between the residue index of 60 and 80.
Based on MD trajectories, it seems that most of the peaking residues are found in the loop areas. B shows that residues R1, R2, and R3 at the binding site have very low RMSF values, indicating that the ligand is tightly bound to the protein. During the first one hundred nanoseconds of the tri-replicate MD simulations of compound 8 with cannabinoid 2 receptor, hydrogen bonds formed (D; R1, R2, and R3). After simulating cannabinoid 2 receptor protein (PDB I.D.: 5ZTY) for 100 ns, as shown in D, the docking pattern of two hydrogen bond development was verified by analyzing a large number of hydrogen plots. Several hydrogen bonds (, D; R1, R2, and R3) were formed between cannabinoid 2 receptor and compound 8 during the simulation, increasing their affinity for one another. The “Simulation Interactions Diagram” that can be found in Maestro (see ) displays the many subtypes of each interaction type. At each and every stage of the progression, the stacked bar charts have the same appearance. As a result of the fact that the same ligand may have several binding interactions with the same protein residue, it is possible to get values that are more than 1.0. MD trajectories suggest that loop regions are home to many of the residues with the highest peaking values. Long-term ligand binding to the protein is indicated by low RMSF values at the binding site residues. (C R1, R2, and R3). Figure F1 in Supplementary File T1 material demonstrates that the complex has returned to its original state despite the presence of some shifting peaks. These RMSF values ensure that the protein–ligand combination is stabilized to the greatest possible extent. As can be seen in the RMSF plots, there was a significant rise in the amount of protein structural diversity between the residue index of 60 and 80.
During the course of the 100ns simulation, protein–ligand interactions were examined, and compound 8 was shown to bind with the cannabinoid 2 receptor. The previous graph provided context for the types of interactions exhibited here, allowing us to categorize and organize these connections. It was shown that there are three unique types of contacts (or interactions) between cannabinoid 2 receptor proteins and compound 8. These three types of contacts include hydrophobic interactions, water bridges, and hydrogen bonds. The presence of hydrophobic linkages was shown to be an overwhelming majority among these interactions. Among the cannabinoid 2 receptor protein's amino acids, Val86 (80%), Leu181 (> 80%), and Phe91 (50%), were shown to have the most hydrophobic interactions with compound 8. As a result, hydrophobic interactions are crucial for the stability of the drug-receptor complex. After further investigation, it was found that compound 8 had three hydrogen bonding interactions with Phe87 (>30%) and Val113 (10%). It was also shown that Phe87 (in 10% of instances), Phe117 (in 5% of cases), and Ala282 (in more than 10% of cases) produce correlations with water bridges. This meant that the ligand remained stable for the whole 100 ns simulation with the help of hydrogen bonds and water bridge interactions.
Molecular docking investigations and MD modelling confirmed that compound 8 interacted with the cannabinoid 2 receptor protein via hydrogen bonding, a water bridge, and hydrophobic interactions. This demonstrated that the drug-receptor complex was stable during the whole simulated time period of 100 ns. During the simulation, the protein's SSE, along with its alpha helices and beta strands, are analyzed. Figure F1 C in Supplementary File T1 display a scatter plot depicting the distribution of secondary structural elements (SSEs) over the whole protein structure. A chart is constructed using the residue index. The top graphs represent the average SSE composition over all frames of the trajectory throughout the simulation, while the bottom graphs illustrate the dynamic changes in SSE assignment for each residue over time. However, the charts depict the SSE as a whole. During the simulation, secondary structural elements (SSE) may be tracked in real time.
There's a histogram depicting the SSE distribution inside a protein structure as a function of residue index over on the left. It indicates the SSE make-up at each frame of the trajectory, as well as the SSE assignment for each residue. They may be seen at every stage of the journey. The results of the MD simulations showed that the stability of the drug-receptor complex, as predicted by the molecular docking studies, was maintained throughout the whole simulation time of 100 ns. Chemical 8 was discovered to form hydrophobic interactions with the cannabinoid 2 receptor protein in addition to hydrogen bonds and a water bridge.
As the simulation progresses, any shifts in the torsion's conformation will be shown in the dial (or radial) charts (See Figure F2 in Supplementary File T1). The time evolution of the simulation is shown as a radial graphic with the origin in its centre. Dial charts exhibit a lot of information at once, but bar graphs can give you an overview of the problem quickly. They stand as a sample of the probability density of the torsion data and as a representation of that density. The potential energy of a rotatable bond, expressed in kcal/mol, will also be shown on the graph if torsional potential data is also provided. As a function of potential, molecular kinetic energy is shown along the Y-axis (the left side of the graph). The conformational stress that a ligand is under while attached to a protein may be better understood by analyzing both the ligand's histogram and its torsional potential.
Cannabinoid 2 receptor in compound 8 bound states shifted positionally from the original 0 ns structure after 100 ns of simulation time, as shown by a step-by-step trajectory analysis. (See Figure F3 in Supplementary File T1). It has been demonstrated that the structural angular movement that happens in the terminal frame (100 ns) is critical for Compound 8's conformational stability and convergence.
Molecular mechanics generalized born and surface area (Mmgbsa) calculations
Protein–ligand binding energies are often calculated using the MMGBSA method. The impact of extra non-bonded interaction energies on the estimated binding free energy of the protein-compound 8 complex is shown in . The binding energy between cannabinoid 2 receptor and compound 8 is −77.86 kcal/mol. ΔGbind is controlled by non-covalent interactions such Coulomb, Covalent, Hbond, Lipo, SolvGB, and vdW. Most of the average binding energy was given by the ΔGbindLipo energies (−31.69 kcal/mol), with smaller contributions from the GbindCoulomb energies (8.52 kcal/mol) and the ΔGbindHbond energies (−0.159 kcal/mol). Interestingly, none of the three binding energies; ΔGbindvdW (35.42 kcal/mol), ΔGbindSolvGB (23.25 kcal/mol), and ΔGbindCovalent (2.54 kcal/mol) contributed to the total Gbind. Cannabinoid 2 receptor interacted with compound 8 primarily via GbindLipo, GbindCoulomb, and GbindHbond energies, as shown. Upon closer inspection of the simulated data, it becomes clear that compound 8 interacted with the cannabinoid 2 receptor protein in more than 18 hydrophobic interactions. According to the results of molecular docking investigations, the GbindLipo energy plays a crucial role in determining the stability of the complex formed by compound 8 and cannabinoid 2 receptor protein. Compound 8 and cannabinoid 2 receptor formed a hydrogen bond with a GbindHbond (−0.159 kcal/mol), which is consistent with the MMGBSA findings. Binding energy was calculated using docking experiments, and MM-GBSA simulations confirmed this value.
Table 4. Binding energy calculation of compound 8 with cannabinoid 2 receptor protein and non-bonded interaction energies from MMGBSA trajectories.
By making the binding pocket and residues more accessible, these conformational changes enhance the binding energy and stability. Curiously, between the first frame (0 ns) and the final frame (100 ns) of the MMGBSA trial, compound 8 shifted its binding posture for best fitting in the cannabinoid 2 receptor protein. (See Figure F4 in Supplementary File T1).
Where ΔGbind = binding free energy, Gcomplex = free energy of the complex, Gprotein = free energy of the target protein, and Gligand = free energy of the ligand.
Conclusion
In this work, a robust QSAR model has been developed to learn more about the pharmacophoric factors involved in cannabinoid 2 receptor inhibition. Crucial pharmacophoric elements that influence cannabinoid 2 receptor inhibitory activity were identified using a GA-MLR QSAR model with fitting parameters including R2:0.78, and F:623.6, internal validation parameters including Q2Loo:0.78, CCCcv: 0.87, and external validation parameters including R2ext:0.77, Q2F1:0.7730, Q2F2:0.7730, Q2F3:0.76, and CCCext:0.87. CB2R is a key target for therapeutic immunological intervention, hence its development as a ligand is the subject of intense study. Since the cannabis 2 inhibitory action is connected to a number of numerous chemical structures, it is critical to understand its powerful but mostly invisible pharmacophoric features such as; saturation with sp2 hybridized carbon and aromatic carbon, the presence of sp3 hybridized carbon atoms and ring carbon atoms, and a specific combination of sp3 hybridized carbon atoms and the ring nitrogen atom. The QSAR analysis was then confirmed by pharmacophore modelling, which demonstrated that carbon atoms in aromatic and sp2 rings exhibit hydrophobic properties. The ring nitrogen atom and the sp3 hybridized carbon atom recorded by the QSAR model were verified by published molecular docking data of SR-144528. Accordingly, the QSAR study relies on the molecular docking analysis as the molecular descriptor; sp3C_ ringC_5B corresponds to the dihydroquinoline ring, and the same ring makes a hydrophobic pi-pi T-shaped interaction with Phe87 and Phe183 amino acid residues. Using parameters including root-mean-square deviation, root-mean-square fluctuation, a radius of gyration, and hydrogen bonding, study using molecular dynamic simulations showed that the drug-receptor complex remained stable throughout the 100 ns simulation. Hydrophobic interactions were shown to be crucial in keeping the drug-receptor complex stable in computational studies. The MMGBSA research results backed up the findings from QSAR, molecular docking, and MD simulation studies by demonstrating that the GbindLipo energies (−31.69 kcal/mol) were the most important contributors to the average binding energy of the ligand. In addition, most compounds likely have a solid physicochemical profile along with a variety of other ADMET features, most notably concerning their interaction with P-gp. This study was fruitful because it collected and reported unique pharmacophoric properties that may be utilized in designing future cannabinoid 2 receptor inhibitors.
Supplemental Material
Download MS Excel (208 KB)Supplemental Material
Download MS Excel (759 KB)Supplemental Material
Download MS Word (49.5 KB)Supplemental Material
Download MS Excel (71.4 KB)Supplemental Material
Download MS Excel (159.3 KB)Acknowledgments
The author, Rahul D. Jawarkar, acknowledges and is grateful to the esteemed Shri Yogendraji Gode Sir, President of the Dr. Rajendra Gode Institute of Pharmacy in Amravati, for his support during the whole study process. The author is grateful to Paola Gramatica and her colleagues for providing a complimentary copy of QSARINS 2.2.4. Rahul D. Jawarkar: conceptualization, editing and formal analysis: Magdi E.A. Zaki, Sami A Al-Hussain and Rahul d. Jawarkar, Conceptualization, editing and review, Abdullah Yahya Abdullah Alzahrani. Long Chiau Ming. Gehan M. Elossaily: Formal Analysis, editing and Review. Summya Rashid, Abdul Samad, Suraj Mali: Formal Analysis, editing and Review.
Disclosure statement
No potential conflict of interest was reported by the author(s).
Data availability statement
All the data available on this manuscript.
Correction Statement
This article has been corrected with minor changes. These changes do not impact the academic content of the article.
Additional information
Funding
References
- Turkman N, Shavrin A, Ivanov RA, et al. Fluorinated cannabinoid CB2 receptor ligands: Synthesis and in vitro binding characteristics of 2-oxoquinoline derivatives. Bioorg Med Chem. 2011;19(18):5698–5707. doi:10.1016/j.bmc.2011.07.062
- Han S, Zhang F-F, Qian H-Y, et al. Molecular design, synthesis and biological research of novel pyridyl acridones as potent DNA-binding and apoptosis-inducing agents. Eur J Med Chem. 2015;93:214–226. doi:10.1016/j.ejmech.2015.02.003
- Markt P, Feldmann C, Rollinger JM, et al. Discovery of novel CB2 receptor ligands by a pharmacophore-based virtual screening workflow. J Med Chem. 2008;52(2):369–378.
- Durdagi S, Kapou A, Kourouli T, et al. The application of 3D-QSAR studies for novel cannabinoid ligands substituted at the C1’ position of the alkyl side chain on the structural requirements for binding to cannabinoid receptors CB1 and CB2. J Med Chem. 2007;50(12):2875–2885. doi:10.1021/jm0610705
- Pinna G, Loriga G, Lazzari P, et al. Tricyclic pyrazoles. Part 6. Benzofuro[3,2-c]pyrazole: A versatile architecture for CB2 selective ligands. Eur J Med Chem. 2014;82:281–292.
- Porter RF, Szczesniak A-M, Toguri JT, et al. Selective cannabinoid 2 receptor agonists as potential therapeutic drugs for the treatment of endotoxin-induced uveitis. Molecules. 2019;24(18):3338.
- Klegeris A, Bissonnette CJ, McGeer PL. Reduction of human monocytic cell neurotoxicity and cytokine secretion by ligands of the cannabinoid-type CB2 receptor. Br J Pharmacol. 2003;139(4):775–786. doi:10.1038/sj.bjp.0705304
- Ehrin E, Gawell L, Högberg T, et al. Synthesis of [methoxy-3H]- and [methoxy-11C]- labelled raclopride. Specific dopamine-D2 receptor ligands. J Label Compds Radiopharmac. 1987;24(8):931–940. doi:10.1002/jlcr.2580240808
- Gramatica P. On the development and validation of QSAR models. Comput Toxicol Meth Mol Biol. 2013;930: 499–526.
- Toma C, Gadaleta D, Roncaglioni A, et al. Qsar development for plasma protein binding: influence of the ionization state. Pharm Res. 2018;36(2):28.
- Lee W, Park S-J, Hwang J-Y, et al. QSAR model for predicting the cannabinoid receptor 1 binding affinity and dependence potential of synthetic cannabinoids. Molecules. 2020;25(24).
- Günther R, Deuther-Conrad W, Moldovan R, et al. A 3D-QSAR model for cannabinoid receptor (CB2) ligands derived from aligned pharmacophors. J Cheminform. 2013: 5(S1):P40.
- Floresta G, Apirakkan O, Rescifina A, et al. Discovery of high-affinity cannabinoid receptors ligands through a 3D-QSAR ushered by scaffold-hopping analysis. Molecules. 2018;23(9):2183.
- Fichera M, Cruciani G, Bianchi A, et al. A 3D-QSAR study on the structural requirements for binding to CB1 and CB2 Cannabinoid receptors. J Med Chem. 2000;43(12):2300–2309. doi:10.1021/jm991074s
- Patel NR, Patel DV, Murumkar PR, et al. Contemporary developments in the discovery of selective factor Xa inhibitors: A review. Eur J Med Chem. 2016;121:671–698. doi:10.1016/j.ejmech.2016.05.039
- Matter H, Will DW, Nazaré M, et al. Structural requirements for factor Xa inhibition by 3-oxybenzamides with neutral P1 substituents: combining X-ray crystallography, 3D-QSAR, and tailored scoring functions. J Med Chem. 2005;48(9):3290–3312. doi:10.1021/jm049187l
- Ye B, Arnaiz DO, Chou Y-L, et al. Thiophene-Anthranilamides as highly potent and orally available factor Xa inhibitors. J Med Chem. 2007;50(13):2967–2980. doi:10.1021/jm070125f
- Liu T, Lin Y, Wen X, et al. BindingDB: a web-accessible database of experimentally determined protein-ligand binding affinities. Nucleic Acids Res. 2007;35:D198–D201. doi:10.1093/nar/gkl999
- O'Boyle NM, Banck M, James CA, et al. Open Babel: An open chemical toolbox. J Cheminform. 2011;3(1):33.
- Tosco P, Balle T, Shiri F. Open3DALIGN: an open-source software aimed at unsupervised ligand alignment. J Comput Aided Mol Des. 2011;25(8):777–783. doi:10.1007/s10822-011-9462-9
- Masand VH, Rastija V. PyDescriptor : A new PyMOL plugin for calculating thousands of easily understandable molecular descriptors. Chemom Intell Lab Syst. 2017;169:12–18. doi:10.1016/j.chemolab.2017.08.003
- Gramatica P, Chirico N, Papa E, et al. QSARINS: A new software for the development, analysis, and validation of QSAR MLR models. J Comput Chem. 2013;34(24):2121–2132. doi:10.1002/jcc.23361
- Gramatica P, Cassani S, Roy PP, et al. Qsar Modeling is not “Push a Button and Find a Correlation”: A Case Study of Toxicity of (Benzo-)triazoles on Algae. Mol Inform. 2012;31(11-12):817–835. doi:10.1002/minf.201200075
- Dearden JC, Cronin MTD, Kaiser KLE. How not to develop a quantitative structure–activity or structure–property relationship (QSAR/QSPR). SAR QSAR Environ Res. 2009;20(3-4):241–266. doi:10.1080/10629360902949567
- Fujita T, Winkler DA. Understanding the Roles of the “Two QSARs”. J Chem Inf Model. 2016;56(2):269–274. doi:10.1021/acs.jcim.5b00229
- Gramatica P. Principles of QSAR Modeling. Intern J Quant Struct Prop Relat. 2020;5(3):61–97. doi:10.4018/IJQSPR.20200701.oa1
- Martin TM, Harten P, Young DM, et al. Does rational selection of training and test sets improve the outcome of QSAR modeling? J Chem Inf Model. 2012;52(10):2570–2578. doi:10.1021/ci300338w
- Masand VH, Mahajan DT, Nazeruddin GM, et al. Effect of information leakage and method of splitting (rational and random) on external predictive ability and behavior of different statistical parameters of QSAR model. Med Chem Res. 2014;24(3):1241–1264.
- Consonni V, Ballabio D, Todeschini R. Comments on the definition of the Q2 parameter for QSAR validation. J Chem Inf Model. 2009;49(7):1669–1678. doi:10.1021/ci900115y
- Consonni V, Todeschini R, Ballabio D, et al. On the misleading Use of QF32 for QSAR model comparison. Mol Inform. 2019;38(1-2). doi:10.1002/minf.201800029
- Chirico N, Gramatica P. Real external predictivity of QSAR models: How To evaluate It? comparison of different validation criteria and proposal of using the concordance correlation coefficient. J Chem Inf Model. 2011;51(9):2320–2335. doi:10.1021/ci200211n
- Cherkasov A, Muratov EN, Fourches D, et al. QSAR modeling: where have you been? Where are you going to? J Med Chem. 2014;57(12):4977–5010. doi:10.1021/jm4004285
- Consonni V, Ballabio D, Todeschini R. Comments on the definition of the Q2 parameter for QSAR validation. J Chem Inf Model. 2009;49(7):1669–1678. doi:10.1021/ci900115y
- Zaki MEA, Al-Hussain SA, Masand VH, et al. Qsar and pharmacophore modeling of nitrogen heterocycles as potent human N-myristoyltransferase (Hs-NMT) inhibitors. Molecules. 2021;26(7):1834.
- Li X, Hua T, Vemuri K, et al. Crystal structure of the human cannabinoid receptor CB2. Cell. 2019;176(3):459–467. doi:10.1016/j.cell.2018.12.011
- Gaudreault F, Morency L-P, Najmanovich RJ. NRGsuite: a PyMOL plugin to perform docking simulations in real time using FlexAID. Bioinformatics. 2015;31(23):3856–3858.
- Daina A, Michielin O, Zoete V. SwissADME: a free web tool to evaluate pharmacokinetics, drug-likeness and medicinal chemistry friendliness of small molecules. Sci Rep. 2017;7(1). doi:10.1038/s41598-022-25895-8
- Abchir O, Yamari I, Nour H, et al. Structure-based virtual screening, ADMET analysis, and molecular dynamics simulation of Moroccan natural compounds as candidates α-amylase inhibitors. ChemistrySelect. 2023;8(26):1092.
- Abchir O, Daoui O, Nour H, et al. Exploration of Cannabis constituents as potential candidates against diabetes mellitus disease using molecular docking, dynamics simulations and ADMET investigations. Scientific African. 2023;21:e01745.
- Daoui O, Mali SN, Elkhattabi K, et al. Repositioning Cannabinoids and Terpenes as Novel EGFR-TKIs Candidates for Targeted Therapy Against Cancer: A virtual screening model using CADD and biophysical simulations. Heliyon. 2023;9(4):e15545.
- Shivakumar D, Williams J, Wu Y, et al. Prediction of absolute solvation free energies using molecular dynamics free energy perturbation and the OPLS force field. J Chem Theory Comput. 2010;6(5):1509–1519. doi:10.1021/ct900587b
- Jorgensen WL, Chandrasekhar J, Madura JD, et al. Comparison of simple potential functions for simulating liquid water. J Chem Phys. 1983;79(2):926–935. doi:10.1063/1.445869
- Martyna GJ, Klein ML, Tuckerman M. Nosé–Hoover chains: The canonical ensemble via continuous dynamics. J Chem Phys. 1992;97(4):2635–2643. doi:10.1063/1.463940
- Toukmaji AY, Board JA. Ewald summation techniques in perspective: a survey. Comput Phys Commun. 1996;95(2-3):73–92. doi:10.1016/0010-4655(96)00016-1
- Kagami LP, das Neves GM, Timmers LFSM, et al. Geo-measures: A PyMOL plugin for protein structure ensembles analysis. Comput Biol Chem. 2020;87:107322.
- Ghosh A, Mukerjee N, Sharma B, et al. Target specific inhibition of protein tyrosine kinase in conjunction with cancer and SARS-COV-2 by olive nutraceuticals. Front Pharmacol. 2022;12:812565.
- Masand VH, El-Sayed NNE, Bambole MU, et al. Multiple quantitative structure-activity relationships (QSARs) analysis for orally active trypanocidal N-myristoyltransferase inhibitors. J Mol Struct. 2019;1175:481–487. doi:10.1016/j.molstruc.2018.07.080
- Masand VH, Mahajan DT, Alafeefy AM, et al. Optimization of antiproliferative activity of substituted phenyl 4-(2-oxoimidazolidin-1-yl) benzenesulfonates: QSAR and CoMFA analyses. Eur J Pharm Sci. 2015;77:230–237.
- Zhou L, Zhou S, Yang P, et al. Targeted inhibition of the type 2 cannabinoid receptor is a novel approach to reduce renal fibrosis. Kidney Int. 2018;94(4):756–772. doi:10.1016/j.kint.2018.05.023
- Xiang W, Shi R, Kang X, et al. Monoacylglycerol lipase regulates cannabinoid receptor 2-dependent macrophage activation and cancer progression. Nat Commun. 2018;9(1):2574.
- Shire D, Calandra B, Bouaboula M, et al. Cannabinoid receptor interactions with the antagonists SR 141716A and SR 144528. Life Sci. 1999;65(6-7):627–635. doi:10.1016/S0024-3205(99)00285-4
- Cichero E, Menozzi G, Guariento S, et al. Ligand-based homology modelling of the human CB2 receptor SR144528 antagonist binding site: a computational approach to explore the 1,5-diaryl pyrazole scaffold. MedChemComm. 2015;6(11):1978–1986. doi:10.1039/C5MD00333D
- Ji B, Liu S, He X, et al. Prediction of the binding affinities and selectivity for CB1 and CB2 ligands using homology modeling, molecular docking, molecular dynamics simulations, and MM-PBSA binding free energy calculations. ACS Chem Neurosci. 2020;11(8):1139–1158. doi:10.1021/acschemneuro.9b00696
- Bertini S, Chicca A, Arena C, et al. Synthesis and pharmacological evaluation of new biphenylic derivatives as CB 2 receptor ligands. Eur J Med Chem. 2016;116:252–266. doi:10.1016/j.ejmech.2016.03.072
- Waring MJ. Lipophilicity in drug discovery. Expert Opin Drug Discov. 2010;5(3):235–248. doi:10.1517/17460441003605098
- Delaney JS. Esol: estimating aqueous solubility directly from molecular structure. J Chem Inf Comput Sci. 2004;44(3):1000–1005. doi:10.1021/ci034243x
- Ali J, Camilleri P, Brown MB, et al. In silico prediction of aqueous solubility using simple QSPR models: the importance of phenol and phenol-like moieties. J Chem Inf Model. 2012;52(11):2950–2957. doi:10.1021/ci300447c
- Daina A, Zoete V. A BOILED-Egg to predict gastrointestinal absorption and brain penetration of small molecules. ChemMedChem. 2016;11(11):1117–1121. doi:10.1002/cmdc.201600182
- Thomas H, Coley HM. Overcoming multidrug resistance in cancer: An update on the clinical strategy of inhibiting P-glycoprotein. Cancer Control. 2017;10(2):159–165.
- Bickerton GR, Paolini GV, Besnard J, et al. Quantifying the chemical beauty of drugs. Nat Chem. 2012;4(2):90–98. doi:10.1038/nchem.1243
- Martin YC. A bioavailability score. J Med Chem. 2005;48(9):3164–3170. doi:10.1021/jm0492002
- Lipinski CA, Lombardo F, Dominy BW, et al. Experimental and computational approaches to estimate solubility and permeability in drug discovery and development settings. Adv Drug Deliv Rev. 2012;64:4–17. doi:10.1016/j.addr.2012.09.019
- Brown NP, Orengo CA, Taylor WR. A protein structure comparison methodology. Comput Chem. 1996;20(3):359–380. doi:10.1016/0097-8485(95)00062-3