
 ?Mathematical formulae have been encoded as MathML and are displayed in this HTML version using MathJax in order to improve their display. Uncheck the box to turn MathJax off. This feature requires Javascript. Click on a formula to zoom.
ABSTRACT
Introduction
Pharmacovigilance plays a pivotal role in monitoring adverse events (AEs) related to chemical substances in human/animal populations. With increasing spontaneous-reporting systems, researchers turned to in-silico approaches to efficiently analyze drug safety profiles. Here, we review in-silico methods employed for assessing multiple drug-drug/drug-disease AEs covered by comparative analyses and visualization strategies.
Areas covered
Disproportionality, involving multi-stage statistical methodologies and data processing, identifies safety signals among drug-AE pairs. By stratifying data based on disease indications/demographics, researchers address confounders and assess drug safety. Comparative analyses, including clustering techniques and visualization techniques, assess drug similarities, patterns, and trends, calculate correlations, and identify distinct toxicities. Furthermore, we conducted a thorough Scopus search on ‘pharmacovigilance,’ yielding 5,836 publications spanning 2003 to 2023.
Expert opinion
Pharmacovigilance relies on diverse data sources, presenting challenges in the integration of in-silico approaches and requiring compliance with regulations and AI adoption. Systematic use of statistical analyses enables identifications of potential risks with drugs. Frequentist and Bayesian methods are used in disproportionalities, each with its strengths and weaknesses. Integration of pharmacogenomics with pharmacovigilance enables personalized medicine, with AI further enhancing patient engagement. This multidisciplinary approach holds promise, improving drug efficacy and safety, and should be a core mission of One-Health studies.
1. Introduction
It is essential to understand the causality of adverse events (AEs) when chemical substances or pharmaceutical drug(s) are administrated to treat, cure, manage, prevent, or diagnose a disease. However, synergistic or antagonistic off-target or unintended effects could be triggered when drug-drug or drug-disease interactions are activated that may involve a series of enzymatic transformations, and/or altered transport, binding, or metabolism. Such interactions may increase the drug’s bioavailability or target it to a specific body location to preserve its potency which could potentially broaden off-target effects as a result of modulation of other targets that may be related biologically but are unrelated to the therapeutic target of interest.
The accumulation of electronic health records (EHRs) over the years enables researchers and policymakers to investigate the interactions among clinical outcomes, medications, and disease indications to understand their mechanism of toxicity. In the big data era, cutting-edge approaches including machine learning (ML), artificial intelligence (AI), natural language processing (NLP), and statistical learning (SL) were implemented to improve data collection, curation, wrangling, and analysis; thereby promising more robust and comprehensive AE signal detections [Citation1]. According to The Law of Large Numbers (LLN) [Citation2], as the number of reports/trials increases, the result of certain estimates/experiments will tend to more closely approach the expected value of true or theoretical estimates. The frequentist methods are dependent on LLN allowing researchers to draw accurate inferences about a population based on a representative sample. A wider perspective embracing a large-scale of patient observations and a small scale of AE-Drug occurrence can be depicted by using data-driven methodologies. Conducting a systematic safety signal assessment can be incredibly beneficial in providing prescribers and patients with a high level of confidence and valuable information.
Pharmacovigilance (PhV) encompasses systematic monitoring of drug safety, mitigation of risks and toxicity, and enhancing the benefits of drugs [Citation3–5]. Each year, the United States experiences around 2 million AEs, resulting in a significant healthcare cost exceeding $130 billion [Citation6,Citation7]. AEs due to pharmaceutical products rank as the fifth leading cause of death in the hospital, accounting for at least 100,000 deaths [Citation6–8]. This highlights the significance of PhV analysis in the contemporary landscape. For instance, a study by Banda et al (2015) [Citation9] developed a standardized procedure for data mining spontaneous reporting systems (SRS) to demonstrate the power of data cleaning and integration in improving drug safety research. It emphasized the importance of implementing drug and AE mappings to generate more reliable PhV data and showed the flexibility of using multiple sources and appropriate codes. Guo et al. (2022) [Citation10] performed a PhV study of niraparib-related AE reports curated by the US Food and Drug Administration (FDA) which evaluated the performance of four disproportionality analytic methods on signal detections of AEs. They suggested that a systematic PhV analysis could help clinicians identify severe AEs and better recommend therapies according to the individual patient’s situation. Notably, identified AE signals in post-market safety data analysis aligned with weak signals from clinical trials, allowing regulatory scrutiny and potential alerts to address significant AEs.
A study by Dolladille et al. (2020) [Citation11] on SRS data from the World Health Organization (WHO) database, VigiBase, suggested a more nuanced perspective for the recurrence of the initial immune-related AEs (ir-AE) after the reintroduction of an immune checkpoint inhibitor (ICI) that was discontinued due to ir-AEs. It considered the scope and depth of PhV analysis needed to reveal the characteristics in SRS data for a specific clinical practice issue. Prior to these studies, a study in 2010 combined three sources of data including published case reports, serum samples from patients, and data mining of the FDA Adverse Event Reporting System (FAERS) related to drug-induced immune thrombocytopenia [Citation12]. It showed that the AE assessment using multiple pieces of evidence could identify the association between the drug and a specific AE from more than one hundred suspected drug candidates; and provided triple-verified safety signals of drugs for further causality investigations by clinicians.
The above considerations led the present authors to develop an approach to summarize major SRS databases and disproportionality analysis for PhV signal detection. In this manuscript, our primary goal is to present a comprehensive PhV study that integrates various multidisciplinary approaches and incorporates previously established statistical procedures. The overarching aim is to enhance the identification of drug safety signals, provide a thorough assessment of drugs using diverse classifications, and offer a detailed interpretation of the PhV analysis. We also seek to provide valuable expert insights into the future development and application of PhV data analysis methodologies. To achieve this, we initially elaborate on the data collection and curation process, highlighting the sources of data and outlining potential data limitations. Subsequently, we delve into an extensive discussion of the current statistical methods, exploring the nuances between the Frequentist and Bayesian approaches and examining how they interpret signals using various criteria. We then present a sound rationale for the application of novel PhV analyses. We then analyze pertinent PhV studies, emphasizing the critical aspects of causal inference and demonstrating the importance of sensitivity analysis in this context.
2. Data
SRS data are the primary sources discussed in this review. Post-market safety databases comprise several essential systems; including FAERS [Citation13], the WHO Global Individual Case Safety Report Database System (Vigibase) [Citation14], EudraVigilance operated by the European Medicines Agency [Citation15], the MedEffect program managed by Health Canada’s Marketed Health Products Directorate (MHPD) [Citation16], and the Vaccine Adverse Event Reporting System (VAERS) co-managed by the Centers for Disease Control and Prevention (CDC) and FDA [Citation17]. These post-market databases house a wealth of valuable information related to the use of registered drugs. They encompass data on AE, providing insights into the nature of reported side effects and their seriousness. Additionally, the databases capture crucial details such as outcomes resulting from AEs and associated dates. The majority of reported AEs and disease indications are typically provided in FAERS; however, there are instances where this information might not be available or missing. Demographic and administrative information serves as supportive evidence during safety assessments when faced with formidable challenges in conveying accurate results. These data play a critical role in bolstering specific data elements, especially in situations where significant noise or uncertainties exist; particularly when drugs and other medical conditions are ruled out as potential confounding factors influencing AE and outcomes within a specific group of patients. The complementary system for adverse events associated with animal drug usage is called the Animal and Veterinary Adverse Events Database (ADAE) and is available at OpenFDA.com.
In the context of regulatory communication, collaborations, and data management, AEs are coded using the Medical Dictionary for Regulatory Activities (MedDRA). MedDRA is a standardized and internationally recognized terminology developed to facilitate the comprehensive classification and description of medical product AE information [Citation18]. It serves as an essential worldwide tool for regulatory agencies, pharmaceutical companies, and healthcare professionals, to uniformly report and analyze AEs associated with medications and medical interventions. The MedDRA hierarchy consists of five levels, ranging from specific to general classifications. These levels include the Lowest Level Term (LLT), Preferred Term (PT), High-Level Term (HLT), High-Level Group Term (HLGT), and System Organ Class (SOC). Each level provides a structured framework for organizing and categorizing AE information.
The Anatomical Therapeutic Chemical (ATC) code is an internationally recognized classification system for categorizing active substances used in medications. This comprehensive code comprises five distinct levels of classification within the WHO Collaborating Centre for Drug Statistics Methodology. These levels are structured from the most specific to the most general, starting with the chemical substance level, followed by the chemical subgroup, pharmacological subgroup, therapeutic subgroup, and culminating at the anatomical main group level [Citation19]. This systematic classification enables uniformity and standardization in the identification and classification of drug substances worldwide.
The integration of the PhV database, a medical dictionary, and a drug classification system brings significant advantages to sophisticated investigations, making them more flexible, extensible, and efficient. As spontaneous reports accumulate, some of the limitations associated with these systems are alleviated. With increasing AE reports, patterns of incomplete, inaccurate, biased, delayed, or unverified data theoretically become manageable over time. The true value of SRS with multi-sources is highlighted through various methods aimed at enhancing drug safety and protecting public health. This integrated approach enables a comprehensive analysis of AEs, leading to better insights into potential risks associated with medications or different disease states which aid in the continuous improvement of patient safety.
It is essential to acknowledge that AE reports may not fully capture the safety profiles related to a pharmaceutic product. SRS may lack sufficient evidence to establish clear connections among AEs, outcomes, medications, and undergoing diseases. The presence of under-reporting or over-reporting of AEs can significantly impact the interpretation of the product’s safety profile. To address these limitations and ensure the extensibility of PhV data, more robust and highly adaptable methods are being considered [Citation20]. SRS data thus can possess certain limitations due to their inherent inadequacy [Citation21]. One notable drawback of these data is the omission of important demographic information such as age, sex, weight, and reporting country, which can hinder comprehensive analyses. Attempting to improve data performance through stratification based on age and sex to eliminate confounding factors becomes challenging due to the missing information in numerous SRS databases [Citation22,Citation23]. Cone et al. (2021) [Citation24] highlighted the presence of reporting bias resulting from the limited availability of comorbidity information, which can undermine the certainty of the association between a severe AE to a therapeutic drug.
In the review conducted by Wise et al. (2009) [Citation1], the analysis of SRS data suggested that releasing information on a weekly basis could significantly improve communication with the public. However, the frequency of data updates varies across different pharmacovigilance systems. Currently, FAERS releases new data quarterly while continuously updating existing records. On the other hand, EMA publishes EudraVigilance data weekly. In Canada, the Vigilance Adverse Reaction online database is updated monthly. The WHO VigiBase receives reports at varying frequencies, ranging from daily to quarterly across member countries, depending on the reporting practices of member countries.
Besides the traditional SRS data, researchers are increasingly interested in harnessing the vast amount of social media data for the purpose of AE monitoring [Citation25]. Social media text mining offers a valuable opportunity to integrate non-SRS data as evidence to support PhV practices [Citation20]. To utilize social media data effectively, researchers detect drug and AE-related information from unstructured text, map it to standard medical terminology, and combine it with any available demographic records to convert it into structured data for disproportionality analysis [Citation21,Citation25]. During the COVID-19 pandemic, the UK conducted an extensive community-based study to explore the occurrence of AEs related to novel mRNA vaccines via a self-reported app [Citation26]. Although the observational nature of self-reported data is biased and prevents making direct claims about drug effectiveness, the strengths, and breadth of the data, which are captured shortly after administrating a therapeutic drug, coupled with the substantial size of the participants using the cellphone apps, justify their use in estimating the prevalence of the disease and its associated AEs.
3. Current methods
In the analysis of spontaneous reports, both Frequentist and Bayesian statistical approaches are commonly employed [Citation27–29]. These methods aim to calculate disproportionality by comparing the observed number of reports to an expected value to detect potential safety signals of drug-AE pairs [Citation22,Citation23]. Frequentist methods involve transforming the binary drug-AE pair incidence into multiple contingency tables () [Citation23]. From these tables, various point estimates such as Reporting Odds Ratio (ROR), Proportional Reporting Ratio (PRR), Chi-square tests, Information Component (IC), and Likelihood Ratio test (LRT) are computed [Citation30–34]. On the other hand, Bayesian methods also rely on point estimates but incorporate the posterior probability of joint occurrence of a drug-AE pair, assuming no association between the product and the AE. Examples of Bayesian methods among others include Bayesian Confidence Propagation Neural Network (BCPNN), and multi-item Gamma Poisson Shrinker (MGPS) [Citation35–37]. These statistical approaches provide valuable tools for identifying potential safety signals in pharmacovigilance data, aiding regulatory authorities and healthcare professionals in making informed decisions to ensure drug safety.
Table 1. A single 22 contingency table for a drug(i)-AE(j) pair in SRS for the number of reports given by counts and the associated probabilities.
3.1. Frequentist methods
In SRS analysis, the data from a matrix with I rows, representing drugs, and J columns, representing different AEs, can be summarized into a single 22 table (). The probability of the joint occurrence of Drugi and AEj is denoted by
, representing the probability of both Drugi and AEj happening together. Classical frequentist methods in PhV analysis often stem from the 2
2 contingency table. Measures such as RR, ROR, PRR, and IC are theoretically defined as the proportions of two conditional probabilities of tested drug-AE pairs against other reported drug-AE pairs. lists their corresponding estimators used for statistical analysis. To estimate confidence intervals for ROR and PRR, the delta method is commonly employed [Citation22].
Table 2. Probabilistic Interpretations and estimators of association for the 22 contingency table in SRS analysis.
3.2. Bayesian methods
In contrast to classical frequentist methods, Bayesian methods in PhV aim to tackle the challenges arising from large variations in estimators caused by the low occurrence of drug-AE combinations. One common issue with sparse data is the potential for extreme estimates, which can lead to unreliable conclusions. Bayesian methods address this uncertainty by employing a shrinkage approach that pulls the estimator toward a value of 1, which indicates no statistical association between the drug and the AE [Citation20,Citation29].
In the study conducted by Bate et al. (1998) [Citation36], a BCPNN was developed based on IC measures: . In the context of the statistical framework, let’s define the following probabilities:
The probability that the drug-AE pair of interest presents in the SRS,
: The prior probability of a drug of interest, and
The prior probability of an AE of interest.
Thus, the count of occurrences () for the interested drug-AE pair (
) is assumed to follow a binomial distribution:
, where
represents the total number of occurrences in the entire SRS dataset.
is modeled using the Beta distribution:
, with
and
, where
denotes the expected value for the given variable; the same binomial and beta distribution are assumed for
(the count of occurrences given the prior probability for the interested drug),
and
,
with
all set to 1. Although the distribution of IC cannot be given, the posterior mean and variance of
can be estimated using the delta method by
,
, where
[Citation33]. Furthermore, under the assumption of normal approximation, the 95% confidence interval for IC can be estimated using the posterior mean
.
MGPS was developed by DuMouchel (1999) [Citation37] as a Bayesian data mining tool to detect associations in large-scale pharmacovigilance databases. Here, , the number of drug-AE reports is modeled as a Poisson random variable:
where
. The mean (
) of the Poisson distribution is given by
, where
is derived from a common prior distribution. The model is given by
and prior distributions combine two Gamma distributions given by the mixture distribution as follows:
The posterior distribution is also formulated as a mixture distribution combining two Gamma distributions:
where Q is the posterior probability that
calculated from the first component of the mixture distribution. The posterior means and variances of
are calculated as follows:
, and
, where
,
,
,
, and
are the maximum likelihood estimates of the hyperparameters. The delta method is implemented to estimate
and
. The empirical Bayes geometric mean (EBGM) of
is defined as
representing the risk measure. This measure allows researchers to obtain a more robust and reliable estimation of the geometric mean of
, which is a crucial indicator for assessing the association between the drug and AE.
In Bayesian methods, SRS data is assumed to follow a certain distribution, and there exist hidden parameters that represent PhV risk measures in the data that cannot be directly estimated. Nevertheless, data are used to establish a function involving these parameters. For instance, in MGPS where
,
is assigned a prior distribution. The posterior distribution for
(
) can be identified through the combination of the prior and data likelihood. The delta methods facilitate the transformation of the posterior mean and variance of parameters into meaningful PhV-related measures. It is important to note that
,
,
, and
are constrained to be 1 to ensure the priors of marginal probabilities are non-informative [Citation33,Citation38].
3.3. Criteria for signal detecting
The criteria and thresholds for signal detection vary significantly among different PhV studies [Citation39]. Various threshold values have been explored to identify signals using different methods. For instance, Szarfman et al. (2002) [Citation40] evaluated four cutoff points of EB05 (lower 5th percentile of the posterior observed-to-expected distribution of EBGM) as thresholds in MGPS, and found that lowering the thresholds increased the sensitivity, leading to the inclusion of more true drug-AE associations. Measures of drug-AE association using frequentist methods like ROR, PRR, and RR were examined for lower confidence intervals when they were larger than 1 or 2 with at least 3 occurrences [Citation41]. Another study suggested further evaluation should be implemented for drug-AE pairs with small occurrences of drug-AE when PRR is larger than 3 [Citation31]. The decision criteria for MGPS were suggested at the level of EB05 > 2 [Citation22]. Khouri et al. (2021) [Citation39] conducted a systematic assessment of the commonly used signal detection criteria and illustrated the impact of different methods and thresholds on the number of PhV study counts involved in signal detections.
4. Rationale of a novel PhV
PhV studies by Cone et al. (2021) [Citation24], Xu et al. (2021) [Citation42], and Nguyen et al (2022) [Citation43] conventionally formed a hypothesis that certain AEs would be associated with specific medications under various circumstances, for instance, reassessing severe cardiotoxicity in prostate cancer related to common hormone therapy drug, or systematically evaluating the incidences of myocarditis in large population associated to multiple drugs; or prophylactically illustrating the disturbance of pulmonary AE profiles for patients with hypertension under medications simultaneously used in confronting the rapid progress of the COVID-19 pandemic. To investigate a range of safety signals from a number of drugs, researchers conducted DuMouchel’s MGPS, an empirical Bayes approach, for disproportionality analysis. Subsequently, multiple statistical approaches and procedures were implemented to evaluate the PhV results in a comparative manner [Citation42]. Systematic analysis in PhV using SRS data often offers excessive drug and AE information, inevitably leading to unnecessary complexity.
After conducting the disproportionality analysis in pharmacovigilance, several deep questions arise that require careful consideration and further investigation: (i) How to compare drugs with similar toxicity profiles? Comparing drugs with similar toxicity profiles is crucial for understanding their safety profiles. One approach could be to use similarity metrics that consider factors such as pharmacological class, therapeutic indications, and target organs. (ii) How to compare toxicity profiles of drugs in the same chemical subgroup? When dealing with drugs within the same chemical subgroup, one approach is to employ structure-activity relationship analysis, where the chemical structures of drugs are compared, and their potential impact on AEs is evaluated. (iii). To what degree of certainty can we know the identified associations between drugs and AEs? Bayesian methods can be employed to calculate posterior probabilities, providing a measure of certainty. Additionally, sensitivity analyses and validation studies can help assess the robustness of the identified associations and provide more reliable estimates.
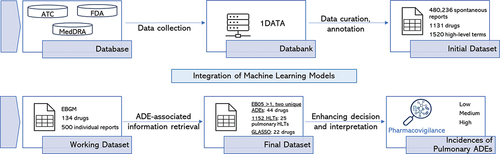
The hypothesis in similar PhV studies by Xu et al. (2021) [Citation42] and Cone et al. (2021) [Citation24] was that drugs from the same chemical subgroup could exhibit intrinsic toxicity profiles for a group of people with the same indication. To reveal drug safety issues, Xu et al. (2021) [Citation42] adopted a data-driven strategy and implemented a multiple-stage analysis to eliminate insignificant or noise-driven data. The workflow depicted a top-down analysis along with multiple data-driven approaches to gain a deeper insight into data and results (). By employing this data-driven strategy, the study avoided overemphasizing the statistics of a population and focused on uncovering true features and trends. Once drugs containing potential safety issues were detected, a group of interested AEs was extracted to create the profile for selected drugs. Instead of presenting assessments in traditional statistical tables or bar charts, the studies utilized advanced visualization to compare the similarities and dissimilarities of drugs or drug classes of interest [Citation42,Citation43]. A specific cumulative AE reported and variations across time were implemented to examine the abnormality of AEs promoting early attention and guidance changes. Moreover, unsupervised statistical learning was applied to cluster a small group of drugs with severe pulmonary toxicities. The clustering allowed for precision medicine recommendations; tailoring treatment decisions based on the specific drug safety profiles of individual patients.
Figure 1. Flowchart outlining a standard disproportionality analysis for data obtained from SRS.
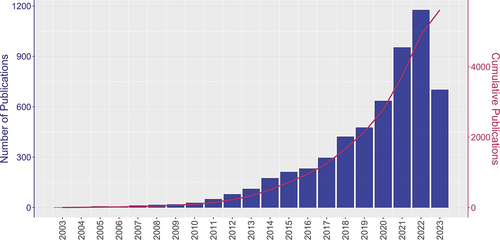
In recent years, the significance of PhV has been increasingly recognized by the scientific community (See ). illustrates the exponential growth of global trends in published records related to PhV from 2003 to 2023. We conducted this search on the Scopus search engine for literature relating to ‘pharmacovigilance’ and obtained a total of 5,836 distinct published records. The x-axis represents the years, ranging from 2003 to 2023, while the two y-axes depict the number of, as well as the cumulative number of, published records related to PhV. The bar chart and cumulative curve show a clear upward trend, indicating a significant increase in the number of publications on PhV over this time period.
Figure 2. Global trends in PhV publications from 2003 to 2023. The purple bars indicate the number of publications in each given year, highlighted by the y-axis on the left-hand side. The red line corresponding to the y-axis on the right-hand side represent the cumulative number of publications from 2003 to 2023.
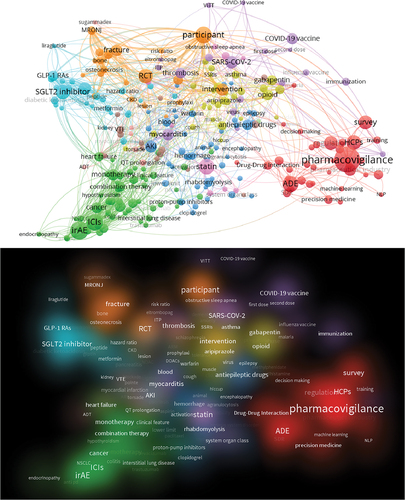
Using these results, we performed a co-word analysis to identify relationships between publications based on the frequency of keywords that appear together. We used VOSviewer version 1.6.0 software (Leiden University, Leiden, the Netherlands; https://www.vosviewer.com/; accessed on 21 July 2023) to extract key terms (including single words and phrases) from the authors’ keywords and abstract fields. The network of co-occurring keywords based on the Scopus search engine for literature pertaining to ‘pharmacovigilance’ is shown in . The analysis of keywords reveals that there is a great deal of heterogeneity within the sample. The top 300 keywords in the authors’ and abstract keywords of all publications are shown in . These keywords typically reflect one of the main focuses of a paper. Unsurprisingly, ‘pharmacovigilance’ is an important concept in the published documents. The most frequently used co-occurring keywords in the entire dataset are as follows: pharmacovigilance, irAE, participant, ICIs, AE, statin, HCPs, RCT, SARS-COV-2, and SGL2 inhibitors. The resulting co-occurring keywords of the density map (see ) also confirm these reorganized keywords and group similar terms to offer a broad picture of pharmacovigilance. These associations clearly highlight the prevailing comorbidities within today’s population, including conditions such as statin use for high cholesterol, COVID-19, diabetes, and immunological issues.
Figure 3. The network structure (Top) and density plots (Bottom) of bibliometric analysis for the abstracts of PhV-related publications.
5. Relevant PhV studies: comparative approaches and findings
5.1. History and origin of PhV
The milestone in PhV development happened in the 1960s when the safety concerns surrounding thalidomide’s use for nausea in pregnant women resulted in severe birth defects [Citation44,Citation45]. This tragedy promoted a more systemic and methodical approach to collecting reports of AEs [Citation46]. Over the past two decades, the fusion of rapid growth in computing power and the availability of spontaneous reports data has enabled the comprehensive investigation of PhV databases using meticulous, curated big data [Citation47]. Consequently, the impact of data quality and methodologies have become increasingly crucial in PhV studies instead of exclusively relying on a clinical evaluation of AE reports [Citation20].
Previous PhV studies often focused on aspects of specific drug toxicity, such as cardiovascular events, while some studies explored uncertain toxicities in novel cancer therapies [Citation11,Citation48]. Salem et al. (2018) [Citation49] conducted a PhV study using VigiBase spanning over half a century to evaluate the association between ICIs and fatal immune-related AEs. The authors compared AEs reported using ICIs with those reported on other medications and demonstrated a higher incidence of myocarditis and other cardiac issues associated with ICI treatment via ROR and IC [Citation49]. In another study by Cone et al. (2021) [Citation24] VigiBase was employed to compare two newer agents, abiraterone and enzalutamide, in the treatment of prostate cancer, with one agent serving as the baseline of the first-line therapy. The authors identified a significant association between higher risks of cardiac AEs, including heart failure and myocardial infarction, with the use of abiraterone. Furthermore, Nguyen et al. (2022) [Citation43] conducted a systematic assessment of myocarditis reported in VigiBase across different drug classes. Their analysis showed that immunotherapies exhibited relatively higher IC values and lower intervals for myocarditis (IC > 3 for seven out of eight immunotherapies) and were associated with the highest subsequent mortality compared to five other pharmacological classes of drugs.
5.2. Recent progress
The absence of disease indication in databases such as VigiBase raises concerns about the presence of confounding factors and potential limitations [Citation50]. In recent years, the FDA has taken a leading role in advancing PhV by providing guidance and quality of spontaneous reports data [Citation5]. One crucial aspect that has improved the analysis is the inclusion of therapeutic indications in FAERS. This inclusion allows for stratification in disproportionality analysis, enabling investigators to examine the impact of confounding factors and eliminate AEs directly related to chronic medical conditions [Citation51–53].
Several studies have demonstrated the effectiveness of this approach in investigating the connection between drug treatments and specific AEs. Zhou et al. (2023) [Citation54], for instance, employed multiple demographic variables, including indications and specific psychiatric AEs, to investigate the connection with ICI treatments. Similarly, Mazhar et al. (2021) [Citation52] identified an elevated risk of weight-related changes with rheumatic disorders using infliximab. Moreover, the study by Ali et al. (2015) [Citation55] focused on evaluating the AE profiles of cholinesterase inhibitors in dementia. They found that rivastigmine was significantly associated with death compared with other drugs in the same class in both FAERS and the Canada Vigilance Adverse Reaction Database.
It is noteworthy that the elegant study conducted by Tatonetti et al. (2012) [Citation51] introduced a novel data-driven approach to signal detection methods using SRS. Their systematical approach aimed to correct the impact of hidden co-variates, signify the importance of stratification and enhance the curation databases for improved drug effects analysis. This approach has proven instrumental in enabling various applications; including drug target identification, disease indication predictions, and drug-drug interaction disclosure. In their study, Tatonetti et al. (2012) [Citation51] employed propensity score matching after disproportionality analysis of a population to pair one exposed individual with one unexposed individual who exhibited similar conditions. By doing so, they successfully ruled out the effect of confounders, ensuring more robust and reliable results. Other studies also incorporated drug combinations to identify better drug regimens with mitigated AEs using FAERS [Citation56,Citation57]. They included a network analysis using a protein-protein interaction database [Citation58] to confirm the identified drug effect.
5.3. Sensitivity analysis
Generally, sensitivity analysis is conducted to assess the impact of changing the values of parameters in model performances (i.e. sensitivity and precision for disproportionality analysis) or outcomes. The common approaches include adding/removing covariate factors, stratification, subgrouping, or trend thresholds for signals [Citation59–61]. However, the changing robustness of SRS data via sensitivity analysis does not result in a different outcome compared to the primary analysis [Citation59,Citation60,Citation62]. This requires an alternative approach to conducting sensitivity analysis, which relies on the application of machine learning techniques based on four components of a contingency table; true positive, false positive, true negative, and false negative, which assist in determining precision and sensitivity.
Despite the lack of a gold standard to assess different signal detection methods [Citation59], sensitivity-precision analysis serves as an important tool to evaluate whether the methods uphold a high power of AE-drug detection. Naturally, when AE occurrences are scattered among groups of drugs, the sensitivity for signal detection decreases [Citation63]. This is methodologically related to how the measurements are calculated from the contingency table since sensitivity and precision are two characteristics of a PhV model, which can be used to review the parameter sensitivity analysis when applying different thresholds or stratification schema [Citation59]. Systematically, AEs are grouped in different levels according to MedDRA which influences the power of signal detection for different methods, resulting in fewer marginal counts of a specific AE when using MedDRA PT compared to a higher level [Citation59,Citation63]. In contrast, the use of MedDRA HLT leads to larger marginal total increases in sensitivity, precision, and power [Citation64]. The effectiveness of AE detection can be also determined by the thresholds for the confidence bound, typically from the lower bound, or the thresholds for the count of an AE-drug combination [Citation61]. Studies have compared the changes in sensitivity and precision using different SRS datasets and signal detection methods and concluded the difficulty of finding a single omnipotent method of signal detection due to the characteristics of a specific dataset rather than the nuances in the statistical methods [Citation30,Citation59].
5.4. Causal inference
Top clinical journals have been promoting a PhV culture fostering awareness of disproportionality analysis [Citation11,Citation49,Citation65]. Disproportionality analysis could benefit casual connections based on signal detection in SRS data. Differentiating potential causal links from apparent drug-AE relationships influenced by chance or other factors necessitates a thoughtful evaluation of the intrinsic limitation in SRS data such as FAERS [Citation66]. To some extent, disproportionality analysis might suggest a causal connection, which could be more accurately replaced by the term ‘association’ [Citation67]. However, Raschi et al [Citation68] asserted that a ‘Pharmacovigilance Syndrome’ exists due to the misuse of SRS for causal inference which might lead to baseless warnings.
In order to establish a more comprehensive approach to conducting causal inference, several studies have been performed. A notable investigation by Hill [Citation69] outlined nine elements when scholars examine the causation between two variables including strength, consistency, specificity, temporality, biological gradient, plausibility, coherence, experiment, and analogy. The shifts in paradigm for detecting and analyzing AEs fusing the development of machine learning and AI with complex reasoning potentially pave a meticulous way to infer a causal association between a drug and an observed AE [Citation70].
6. Deep understanding of the comparative data-driven approaches in PhV
6.1. Individual stages of data processing
Numerous studies have attempted to introduce a unique and comprehensive data-driven approach to compare safety signals and variations in statistical procedures [Citation33,Citation43,Citation56,Citation71]. The study by Xu et al. [Citation42] provided the individual stages of data processing in the new methodology as follows: The study employed a liberal rule with a larger LASSO, combining Bayesian and frequentist approaches to incorporate more suspicious drug-AE pairs in the analysis. Principal Component Analysis (PCA) identified three principal components representing AE variations among selected drugs, visualized in 3D space for drug similarity confirmation [Citation72]. AE reports were filtered using PhV thresholds to manage prevalent drugs. The graphic LASSO (GLASSO) adjusted the number of correlated drugs via the adjacency matrix from the drug-AE matrix [Citation73]. The circus plot layout illustrated drug-drug correlation networks, with the same-class drugs sharing colors [Citation74]. Circus plots were adjusted using Reverse Cuthill-McKee for changes in drug clusters and correlations [Citation75]. Two drug grouping methods based on GLASSO and ATC classes were compared using nonparametric statistical tests to assess discrepancies.
6.2. Initial disproportionality analysis
In the initial disproportionality analysis, it was essential to preserve high heterogeneity, as similarities were observed upon initial inspection of the data. Theoretically, the statistical procedure aimed to validate the hypothesis the researchers expected to happen. The assumption behind filtering was to remove bias and noise from AE reports that had minimal impact on the overall picture of most common drugs in the observational cohort study. In the study by Xu et al. (2021) [Citation42], hypertension was selected as the indication condition to retrieve a cohort with a substantial number of AE reports. Disproportionality analysis was implemented on HLT, one level higher than PT, in AE reports, avoiding excessive analysis of drug-AE pairs. The first cleaning filter was applied on drugs containing more than 500 different cases, reducing the total drug number of drugs from 1131 to 134. Subsequently, the second filter was implemented to keep only pulmonary AEs, considering the risk of hypertension prevalence during the COVID-19 outbreak.
Quantitative analysis was accomplished before a specific perspective was imposed to detect safety signals for a group of patients. Thresholds of statistics calculated by MGPS, and relative risk (RR) were also adjusted to ensure the capture of important strata, resulting in a final set of 44 drugs. Different drugs were ranked according to the number of pulmonary AEs detected after filtering and MGPS Analysis. To build the drug-drug correlation matrix from the drug-AE profile matrix, network analysis and statistical learning methods were implemented to encourage sparsity. The final set of drugs was grouped using GLASSO, and multiple comparisons were performed to evaluate the success of the new drug classification based on GLASSO.
6.3. Reiterate comparative analysis
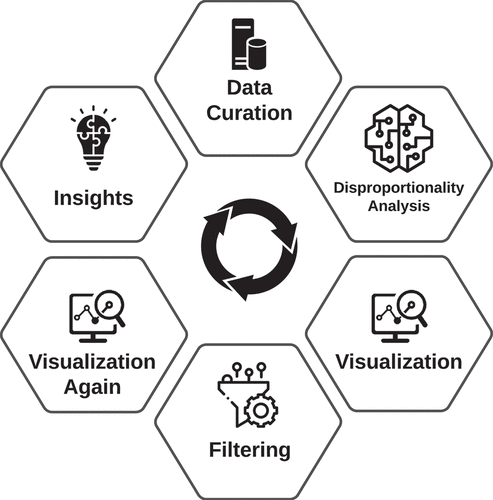
Following the same study for the ranking of drugs via EBGM, drugs with severe pulmonary AEs were identified and the steps focused on validating these safety signals. This thorough process confirmed the hypothesis that drugs from the same chemical subgroup showed different toxicity profiles in PhV data. Effective visualization strategies were inserted to depict quantitative results after the completion of two major stages; the first being when pulmonary AE profiles for 134 drugs were obtained and the second focused on selecting the final suspected drugs, narrowed down to only 22 drugs. Two clustering approaches for the small size of drugs were utilized to compare the difference between ATC classification and GLASSO to finally portray the correlations among drugs from different chemical groups. The nature of SRS inherently lacks a straightforward method to assess drug-AE combinations. However, this study provides a framework for assessing the potential risk of a population when multiple drugs are involved in relation to a system organ class toxicity ().
Figure 4. Framework for assessing potential risks associated with multidrug-related system organ class toxicity in pharmacovigilance analytics.
6.4. Supportive studies
Subsequent studies were established on the basis of prior supporting research [Citation39,Citation51]. Initial investigations by the study by Xu et al. (2021) [Citation42] focused on patients with diabetes using angiotensin-converting enzyme inhibitors (ACEIs) and angiotensin II receptor blockers (ARBs); which highlighted captopril with the highest incidence of pulmonary AEs, clearly showing differences in pulmonary AEs among drugs in the same pharmacological class [Citation76]. A subsequent study by Jaberi-Douraki et al. (2021) [Citation77] further extended this methodology to patients with hypertension, pinpointing quinapril and trandolapril as associated with significantly higher pulmonary AEs compared with other ACEIs and ARBs. What was surprising was that the identification of individual drug AE profiles was not obvious from the pharmacology of the drug classes but rather are idiosyncratic properties of the individual drugs. Xu et al. (2019) [Citation78] examined spontaneous report data on the commonly used drugs in dogs and cats and implemented similarity methods to uncover AE associations from PhV data. Notably, their visualization approach incorporated hierarchical clustering heatmaps and Circos plots to showcase the robustness of the comparative analysis. The visualization approaches coupled with special labeling of the results based on AE selection from the statistical methods served as a comprehensive translation of a matrix representing curated big data.
The studies mentioned in this section highlight the importance of employing multiple statistical methods in PhV research. By integrating multiple statistical methods and conducting comparative analysis in key steps right after data mining and extraction, we can gain deeper insights into drug safety profiles. Meanwhile, the appropriate visualization is considered evidence of confirming hypotheses or revealing hidden information.
7. Conclusions
This review collectively highlighted the research and significance of integrating diverse statistical methods, stratification techniques, and visualization strategies to extract meaningful insights from extensive SRS databases. By employing Bayesian and Frequentist approaches, researchers can identify potential safety signals, while considering confounding factors and heterogeneity in the data. This review summarized the process of PhV practice using SRS, PhV data sources, and disproportionality methods, depicted benchmark data for comparative PhV study using multi-disciplinary approaches, identified the limitations of PhV strategies regarding data and methods, and bridged the current development to the future direction.
The articles reviewed in this work present diverse and innovative approaches to PhV, aimed at assessing drug safety and AEs using large-scale data analysis. Some work demonstrated novel comparative data-driven approaches for PhV using multiple statistical methods and visualization techniques. One study, in particular, focused on identifying drugs with severe pulmonary AEs and validating safety signals through rigorous data processing and clustering [Citation42]. Additionally, some studies emphasized the importance of comparing drug toxicity profiles within the same chemical subgroup [Citation49,Citation55]. Furthermore, supportive studies by Jaberi-Douraki et al. (2021) [Citation77], Xu et al. (2019) [Citation78], Cai et al. (2018) [Citation79], and Fang et al. (2021) [Citation80] illustrated the value of in-silico approaches in PhV. These studies applied methodologies to investigate commonly used drugs in humans and animals. The integration of similarity methods, hierarchical clustering, and circus plots reinforced the evidence for drug-AE associations and showcased the robustness of the comparative analysis.
In conclusion, the comprehensive and well-curated SRS data form the backbone of PhV practices. Reviewed studies underscore the importance of data-driven, in-silico approaches in PhV to comprehensively assess multiple high-level drug-drug and drug-disease AEs. These methodologies facilitate the efficient processing of vast PhV datasets, leading to the identification of crucial safety signals, and supporting evidence-based decision-making for drug safety and public health protection. The utilization of innovative statistical techniques and visualization tools provides a more comprehensive understanding of drug safety profiles, thereby advancing the field of PhV and enhancing care and well-being.
8. Expert opinion
SRS data and the quality of individual reports play a crucial role in PhV as they serve as the foundation for drug safety signal detection. The availability of comprehensive SRS data is indispensable for evaluating AE for a targeted population using certain medications, identifying safety signals with greater certainty, and potentially making informed decisions regarding outcomes. PhV practices on a worldwide scale rely on various sources of data pertaining to spontaneous reports from healthcare providers, pharmaceutical companies, electronic medical records (EMRs), clinical trials, and social media health data. Data from different platforms highlight their uniqueness in drug safety analyses and contribute to the robustness of SRS related to pharmaceutical products. However, PhV practices have been confronting challenges in the effort to integrate diverse data sources. First, the compliance of pharmaceutical companies and healthcare professionals with worldwide regulations and guidance could pave the way for better curation of SRS data, mitigating the curation complexity after the import of data from different sources. Second, the increasing volume of data requires enhanced storage systems with easier access for efficient data management. Third, the advent of new technologies, such as AI, ML, and NLP, embraces promise for automating data processing, monitoring, and assessment, but require careful and consistent data curation techniques Last, the emergence of self-reporting health data from social media and wearable devices provides new opportunities for PhV. With the help of advanced applications like AI language models (ChatGPT) or NLP models, these real-time health-related data could complement the traditional SRS and cast additional light on public health drug safety. However, to generate meaningful results, we stress that the input data must be properly curated before association analyses.
Frequentist and Bayesian methods are still the two major statistical paradigms comprising disproportionality analysis of SRS data to assess drug-AE risks. Each approach has its strengths and limitations. Frequentist methods are commonly used for hypothesis testing and estimating the association between a drug and an AE. Here null hypothesis testing assumes no association between the drug and AE. Despite the applicability and interpretability, Frequentist methods are more sensitive compared to Bayesian methods, especially when dealing with zero denominators or small occurrences of drug-AE pairs, resulting in poor statistical estimates or containing higher variability. On the other hand, Bayesian methods incorporate the prior knowledge of parameters in observed data. They provide posterior distributions of parameters that take into account the certainty of distributions of observed data. Instead of single-point estimates, Bayesian methods offer estimates with confidence intervals, providing a more comprehensive understanding of the uncertainty surrounding the estimates. Policymakers and researchers should carefully consider the applicability and interpretability of each approach in relation to their study objectives.
In this review, we highlighted a benchmark study with a series of preliminary studies attempting to explore PhV issues in a novel way. The philosophy behind this multidisciplinary approach to evaluate drug-AE using SRS data benefits the future extension of PhV practice for identifying causality between drugs and AEs and improving well-being. Our study demonstrated a comparative analytic methodology, involving a rigorous screening and verification process of the data and results. We discussed disproportionality analytic methods to reveal a significant association between a large set of drugs and AEs. We reviewed selected studies for PhV initial assessment serving as observations to provide evidence for further hypotheses generation. Another deeper layer of new research questions connected to PhV can be formulated based on statistical risk measures of manageable size of drugs and AEs.
One of the prominent advancements in PhV is the integration of pharmacogenomics, which explores the response of an individual’s genetics to medications [Citation81–83]. This development represents an essential step toward precision and personalized medicine. By combining disproportionality with genomic data, healthcare providers can individualize therapeutic options, mitigate AE risk to certain drugs, and improve outcomes [Citation84,Citation85]. With the assistance of NLP models and AI language models, PhV can be further empowered by patients directly and actively. Engagement results in more comprehensive AE-related reports and the harmonization of self-reporting information could provide valuable insights into drug safety and lead to updates in drug profiles. Furthermore, as PhV practice evolves, there will be a growing need for PhV education and training in a multidisciplinary manner, covering data science, statistics, pharmacology, and computational biology. Novel education and training programs fostering a competent workforce will be essential to respond to the future challenges in PhV, promote innovation, and development of new PhV tools.
As PhV research continues to advance, several prominent paths have emerged. Stratification and subgroup analysis based on demographics, social determinants of health, and other socioeconomic factors bring more certainty for drug and AE associations, particularly in the presence of variability in SRS data. Long-term safety assessment of drugs is another critical area in dealing with AE manifesting over an extended duration. With access to more longitudinal data, the prediction and evaluation of delayed or cumulative AEs become possible leading to improved continuous drug management [Citation86]. Understanding drug-drug and drug-disease interactions is also of utmost importance for enhancing drug safety and precision. Identifying potential drug interactions in SRS data allows for better use of combined drug regimens and reduces risks associated with polypharmacy. Besides the involvement of self-reporting data in PhV, effective risk communication strategies, such as the development of user-friendly apps and accessible community platforms for drug-AE information, can simplify the individual endeavors to report AEs to healthcare providers. Promoting public awareness of AE reporting can further strengthen the PhV system. Looking forward, research in risk communication needs to explore innovative strategies to effectively transfer AE-related information.
Article highlights
Pharmacovigilance must be approached from a multidisciplinary perspective.
Self-reporting systems are essential for the determination of drug adverse effects.
AI and NLP with computational-based statistical approaches will power future AE studies.
Both Bayesian and frequentist statistical methods are appropriate for the analysis of AE data.
Declaration of interest
The authors have no relevant affiliations or financial involvement with any organization or entity with a financial interest in or financial conflict with the subject matter or materials discussed in the manuscript. This includes employment, consultancies, honoraria, stock ownership or options, expert testimony, grants or patents received or pending, or royalties.
Reviewer disclosures
Peer reviewers on this manuscript have no relevant financial or other relationships to disclose.
Data availability statement
For original data, please contact the corresponding author, Majid Jaberi-Douraki, [email protected].
Additional information
Funding
References
- Wise L, Parkinson J, Raine J, et al. New approaches to drug safety: a pharmacovigilance tool kit. Nat Rev Drug Discov. 2009;8(10):779–782. doi: 10.1038/nrd3002
- Hsu PL, Robbins H. Complete convergence and the law of large numbers. Proc Natl Acad Sci USA. 1947;33:25–31.
- Pharmacovigilance [Internet]. [cited 2023 Jul 11]. Available from: https://www.who.int/teams/regulation-prequalification/regulation-and-safety/pharmacovigilance
- Santoro A, Genov G, Spooner A, et al. Promoting and protecting public health: how the European union pharmacovigilance system works. Drug Saf. 2017;40(10):855–869. doi: 10.1007/s40264-017-0572-8
- Pitts PJ, Louet HL, Moride Y, et al. 21st century pharmacovigilance: efforts, roles, and responsibilities. Lancet Oncol. 2016;17(11):e486–e492. doi: 10.1016/S1470-2045(16)30312-6
- U.S. Food & Drug Administration. Preventable adverse drug reactions: a focus on drug interactions [internet]. FDA; 2021 [cited 2023 Jul 25]. Available from: https://www.fda.gov/drugs/drug-interactions-labeling/preventable-adverse-drug-reactions-focus-drug-interactions
- Wilke RA, Lin DW, Roden DM, et al. Identifying genetic risk factors for serious adverse drug reactions: current progress and challenges. Nat Rev Drug Discov. 2007;6(11):904–916. doi: 10.1038/nrd2423
- Pontes H, Clément M, Rollason V. Safety signal detection: the relevance of literature review. Drug Saf. 2014;37(7):471–479. doi: 10.1007/s40264-014-0180-9
- Banda JM, Evans L, Vanguri RS, et al. A curated and standardized adverse drug event resource to accelerate drug safety research. Sci Data. 2016;3(1):160026. doi: 10.1038/sdata.2016.26
- Guo M, Shu Y, Chen G, et al. A real-world pharmacovigilance study of FDA adverse event reporting system (FAERS) events for niraparib. Sci Rep. 2022;12(1):20601. doi: 10.1038/s41598-022-23726-4
- Dolladille C, Ederhy S, Sassier M, et al. Immune Checkpoint Inhibitor Rechallenge After Immune-Related Adverse Events in Patients With Cancer. JAMA Oncol. 2020;6(6):865–871. doi: 10.1001/jamaoncol.2020.0726
- Reese JA, Li X, Hauben M, et al. Identifying drugs that cause acute thrombocytopenia: an analysis using 3 distinct methods. Blood. 2010;116(12):2127–2133. doi: 10.1182/blood-2010-03-276691
- Research C for DE and. Questions and answers on FDA’s adverse event reporting system (FAERS) [internet]. FDA; 2019 [cited 2023 Jul 14]. Available from: https://www.fda.gov/drugs/surveillance/questions-and-answers-fdas-adverse-event-reporting-system-faers.
- Uppsala Monitoring Centre. VigiBase Services [Internet]. [cited 2023 Jul 14]. Available from: https://who-umc.org/vigibase/vigibase-services/
- European Medicines Agency. EudraVigilance [Internet]. European Medicines Agency. 2018 [cited 2023 Jul 14]. Available from: https://www.ema.europa.eu/en/human-regulatory/research-development/pharmacovigilance/eudravigilance
- Canada H About MedEffect Canada [Internet]. 2003 [cited 2023 Aug 16]. Available from: https://www.canada.ca/en/health-canada/services/drugs-health-products/medeffect-canada/medeffect-canada.html
- Vaccine adverse event reporting system (VAERS) [internet]. [cited 2023 Jul 14]. Available from: https://vaers.hhs.gov/index.html
- Medical dictionary for regulatory activities terminology (MedDRA). MedDRA hierarchy | MedDRA [Internet]. [cited 2023 Mar 21]. Available from: https://www.meddra.org/how-to-use/basics/hierarchy
- WHO collaborating centre for drug statistics methodology - structure and principles for the anatomical therapeutic chemical (ATC) classification system [Internet]. [cited 2023 Jul 14]. Available from: https://www.whocc.no/atc/structure_and_principles/
- Harpaz R, DuMouchel W, Shah NH, et al. Novel data-mining methodologies for adverse drug event discovery and analysis. Clin Pharmacol Ther. 2012;91(6):1010–1021. doi: 10.1038/clpt.2012.50
- Lavertu A, Vora B, Giacomini KM, et al. A new era in pharmacovigilance: toward real-world data and digital monitoring. Clin Pharmacol Ther. 2021;109(5):1197–1202. doi: 10.1002/cpt.2172
- Huang L, Guo T, Zalkikar JN, et al. A review of statistical methods for safety surveillance. Ther Innov Regul Sci. 2014;48(1):98–108. doi: 10.1177/2168479013514236
- Bate A, Evans SJW. Quantitative signal detection using spontaneous ADR reporting. Pharmacoepidemiol Drug Saf. 2009;18(6):427–436. doi: 10.1002/pds.1742
- Cone EB, Reese S, Marchese M, et al. Cardiovascular toxicities associated with abiraterone compared to enzalutamide–A pharmacovigilance study. EClinicalMedicine. 2021;36:100887.
- Sarker A, Ginn R, Nikfarjam A, et al. Utilizing social media data for pharmacovigilance: A review. J Biomed Informat. 2015;54:202–212. doi: 10.1016/j.jbi.2015.02.004
- Menni C, Klaser K, May A, et al. Vaccine side-effects and SARS-CoV-2 infection after vaccination in users of the COVID Symptom study app in the UK: a prospective observational study. Lancet Infect Dis. 2021;21(7):939–949. doi: 10.1016/S1473-3099(21)00224-3
- Madigan D, Ryan P, Simpson S, et al. Bayesian methods in pharmacovigilance. Bayesian Stat. 2010;9:421–438.
- Tiwari R, Zalkikar J, Huang L. Signal Detection for medical scientists: likelihood ratio test-based methodology. Boca Raton, FL, USA: CRC Press; 2021.
- Suling M, Pigeot I. Signal detection and monitoring based on longitudinal healthcare data. Pharmaceutics. 2012;4(4):607–640.
- van Puijenbroek EP, Bate A, Leufkens HGM, et al. A comparison of measures of disproportionality for signal detection in spontaneous reporting systems for adverse drug reactions. Pharmacoepidemiol Drug Saf. 2002;11(1):3–10. doi: 10.1002/pds.668
- Evans SJW, Waller PC, Davis S. Use of proportional reporting ratios (PRRs) for signal generation from spontaneous adverse drug reaction reports. Pharmacoepidemiol Drug Saf. 2001;10(6):483–486.
- Yates F. Contingency tables involving small numbers and the χ2 test. Suppl J R Stat Soc. 1934;1(2):217–235.
- Huang L, Zalkikar J, Tiwari RC. A likelihood ratio test based method for signal detection with application to FDA’s drug safety data. J Am Stat Assoc. 2011;106(496):1230–1241.
- MacKay DJ. Information theory, inference and learning algorithms. Cambridge, UK: Cambridge university press; 2003.
- Rodrigues PP, Ferreira-Santos D, Silva A, et al. Causality assessment of adverse drug reaction reports using an expert-defined Bayesian network. Artif Intell Med. 2018;91:12–22. doi: 10.1016/j.artmed.2018.07.005
- Bate A, Lindquist M, Edwards IR, et al. A bayesian neural network method for adverse drug reaction signal generation. E J Clin Pharmacol. 1998;54(4):315–321. doi: 10.1007/s002280050466
- Dumouchel W. Bayesian data mining in large frequency tables, with an application to the FDA spontaneous reporting system. null. Am Stat. 1999;53(3):177–190. doi: 10.1080/00031305.1999.10474456
- Heckerman D. Bayesian networks for data mining. Data Mining Knowledge Discovery. 1997;1(1):79–119. doi: 10.1023/A:1009730122752
- Khouri C, Revol B, Lepelley M, et al. A meta-epidemiological study found lack of transparency and poor reporting of disproportionality analyses for signal detection in pharmacovigilance databases. J Clinical Epidemiol. 2021;139:191–198. doi: 10.1016/j.jclinepi.2021.07.014
- Szarfman A, Machado SG, O’Neill RT. Use of screening algorithms and computer systems to efficiently signal higher-than-expected combinations of drugs and events in the US FDA’s spontaneous reports database. Drug-Safety. 2002;25(6):381–392. doi: 10.2165/00002018-200225060-00001
- Ang PS, Chen Z, Chan CL, et al. Data mining spontaneous adverse drug event reports for safety signals in Singapore–a comparison of three different disproportionality measures. Expert Opin Drug Saf. 2016;15(5):583–590. doi: 10.1517/14740338.2016.1167184
- Xu X, Kawakami J, Gedara NIM, et al. Data mining methodology for response to hypertension symptomology—application to COVID-19-related pharmacovigilance. Elife. 2021;10:e70734. doi: 10.7554/eLife.70734
- Nguyen LS, Cooper LT, Kerneis M, et al. Systematic analysis of drug-associated myocarditis reported in the World Health Organization pharmacovigilance database. Nat Commun. 2022;13(1):25. doi: 10.1038/s41467-021-27631-8
- McBride WG. Thalidomide and congenital abnormalities. Lancet. 1961;2:90927–90928.
- Finney DJ. From thalidomide to pharmacovigilance: a personal account. Side Effects Of Drugs Annual Elsevier. 2003;26:xxv–xxxii.
- Fornasier G, Francescon S, Leone R, et al. An historical overview over pharmacovigilance. Int J Clin Pharm. 2018;40(4):744–747. doi: 10.1007/s11096-018-0657-1
- Lu M, Yin J, Zhu Q, et al. Artificial intelligence in pharmaceutical sciences. Eng. 2023. doi: 10.1016/j.eng.2023.01.014
- Wang DY, Salem J-E, Cohen JV, et al. Fatal toxic effects associated with immune checkpoint inhibitors: a systematic review and meta-analysis. JAMA Oncol. 2018;4(12):1721–1728. doi: 10.1001/jamaoncol.2018.3923
- Salem J-E, Manouchehri A, Moey M, et al. Cardiovascular toxicities associated with immune checkpoint inhibitors: an observational, retrospective, pharmacovigilance study. Lancet Oncol. 2018;19(12):1579–1589. doi: 10.1016/S1470-2045(18)30608-9
- Beers E, Van Puijenbroek EP, Bartelink IH, et al. Syndrome of inappropriate antidiuretic hormone secretion (SIADH) or hyponatraemia associated with valproic acid: four case reports from the Netherlands and a case/non-case analysis of vigibase. Drug Saf. 2010;33(1):47–55. doi: 10.2165/11318950-000000000-00000
- Tatonetti NP, Ye PP, Daneshjou R, et al. Data-driven prediction of drug effects and interactions. Science translational medicine. Sci, trans med. 2012;4(125):ra12531–ra12531. doi: 10.1126/scitranslmed.3003377
- Mazhar F, Battini V, Gringeri M, et al. The impact of anti-TNFα agents on weight-related changes: new insights from a real-world pharmacovigilance study using the FDA adverse event reporting system (FAERS) database. Expert Opin Biol Ther. 2021;21(9):1281–1290. doi: 10.1080/14712598.2021.1948529
- Poleksic A, Xie L. Database of adverse events associated with drugs and drug combinations. Sci Rep. 2019;9(1):20025. doi: 10.1038/s41598-019-56525-5
- Zhou C, Peng S, Lin A, et al. Psychiatric disorders associated with immune checkpoint inhibitors: a pharmacovigilance analysis of the FDA adverse event reporting system (FAERS) database. Eclinicalmedicine. 2023;59:101967. doi: 10.1016/j.eclinm.2023.101967
- Ali TB, Schleret TR, Reilly BM, et al. Adverse effects of cholinesterase inhibitors in dementia, according to the pharmacovigilance databases of the United-States and Canada. PLoS One. 2015;10(12):e0144337. doi: 10.1371/journal.pone.0144337
- Zhao S, Nishimura T, Chen Y, et al. Systems pharmacology of adverse event mitigation by drug combinations. Sci Trans Med. 2013;5(206):ra206140–ra206140. doi: 10.1126/scitranslmed.3006548
- Wilson JL, Steinberg E, Racz R, et al. A network paradigm predicts drug synergistic effects using downstream protein–protein interactions. CPT Pharmacom Syst Pharma. 2022;11(11):1527–1538. doi: 10.1002/psp4.12861
- Berger SI, Ma’ayan A, Iyengar R. Systems pharmacology of arrhythmias. Sci Signaling. 2010;3(118):ra30–ra30.
- Candore G, Juhlin K, Manlik K, et al. Comparison of statistical signal detection methods within and across spontaneous reporting databases. Drug Saf. 2015;38(6):577–587. doi: 10.1007/s40264-015-0289-5
- Seabroke S, Candore G, Juhlin K, et al. Performance of stratified and subgrouped disproportionality analyses in spontaneous databases. Drug Saf. 2016;39(4):355–364. doi: 10.1007/s40264-015-0388-3
- Slattery J, Alvarez Y, Hidalgo A. Choosing thresholds for statistical signal detection with the proportional reporting ratio. Drug Saf. 2013;36(8):687–692.
- Stamatellos V-P, Siafis S, Papazisis G. Disease-modifying agents for multiple sclerosis and the risk for reporting cancer: a disproportionality analysis using the US food and drug administration adverse event reporting system database. Brit J Clin Pharma. 2021;87(12):4769–4779.
- Noguchi Y, Tachi T, Teramachi H. Detection algorithms and attentive points of safety signal using spontaneous reporting systems as a clinical data source. Brief Bioinform. 2021;22(6):bbab347.
- Ding Y, Markatou M, Ball R. An evaluation of statistical approaches to postmarketing surveillance. Stat Med. 2020;39(7):845–874. doi: 10.1002/sim.8447
- Moulis G, Palmaro A, Montastruc J-L, et al. Epidemiology of incident immune thrombocytopenia: a nationwide population-based study in France. Blood. 2014;124(22):3308–3315. doi: 10.1182/blood-2014-05-578336
- Gagne JJ. Finding meaningful patterns in adverse drug event reports. JAMA Intern Med. 2014;174(12):1934–1935.
- Mouffak A, Lepelley M, Revol B, et al. High prevalence of spin was found in pharmacovigilance studies using disproportionality analyses to detect safety signals: a meta-epidemiological study. J Clinical Epidemiol. 2021;138:73–79. doi: 10.1016/j.jclinepi.2021.06.022
- Raschi E, Poluzzi E, Salvo F, et al. Pharmacovigilance of sodium-glucose co-transporter-2 inhibitors: what a clinician should know on disproportionality analysis of spontaneous reporting systems. Nutr Metab Cardiovasc Dis. 2018;28(6):533–542. doi: 10.1016/j.numecd.2018.02.014
- Hill AB. The environment and disease: association or causation? Proc R Soc Med. 1965;58(5):295–300. doi: 10.1177/003591576505800503
- Arku D, Yousef C, Abraham I. Changing paradigms in detecting rare adverse drug reactions: from disproportionality analysis, old and new, to machine learning. Expert Opin Drug Saf. 2022;21(10):1235–1238.
- Cami A, Arnold A, Manzi S, et al. Predicting adverse drug events using pharmacological network models. Sci Trans Med. 2011;3(114):ra114127–ra114127. doi: 10.1126/scitranslmed.3002774
- Lange JH, Reinders J-H, Tolboom JT, et al. Principal component analysis differentiates the receptor binding profiles of three antipsychotic drug candidates from current antipsychotic drugs. J Med Chem. 2007;50(21):5103–5108. doi: 10.1021/jm070516u
- Friedman J, Hastie T, Tibshirani R. Sparse inverse covariance estimation with the graphical lasso. Biostatistics. 2008;9(3):432–441.
- Liao G, Yang Y, Xie A, et al. Applicability of anticancer drugs for the triple-negative breast cancer based on homologous recombination repair deficiency. Front Cell Dev Biol. 2022;10:845950. doi: 10.3389/fcell.2022.845950
- Gibbs NE, Poole J, William G, et al. An algorithm for reducing the bandwidth and profile of a sparse matrix. SIAM J Numer Anal. 1976;13(2):236–250.
- Stafford EG, Riviere JE, Xu X, et al. Pharmacovigilance in patients with diabetes: a data-driven analysis identifying specific RAS antagonists with adverse pulmonary safety profiles that have implications for COVID-19 morbidity and mortality. J Am Pharm Assoc. 2020;60(6):e145–e152. doi: 10.1016/j.japh.2020.05.018
- Jaberi-Douraki M, Meyer E, Riviere J, et al. Pulmonary adverse drug event data in hypertension with implications on COVID-19 morbidity. Sci Rep. 2021;11(1):1–9. doi: 10.1038/s41598-021-92734-7
- Xu X, Mazloom R, Goligerdian A, et al. Making sense of pharmacovigilance and drug adverse event reporting: comparative similarity association analysis using ai machine learning algorithms in dogs and cats. Top Companion Anim Med. 2019;37:100366. doi: 10.1016/j.tcam.2019.100366
- Cai C, Fang J, Guo P, et al. In silico pharmacoepidemiologic evaluation of drug-induced cardiovascular complications using combined classifiers. J Chem Inf Model. 2018;58(5):943–956. doi: 10.1021/acs.jcim.7b00641
- Fang J, Zhang P, Zhou Y, et al. Endophenotype-based in silico network medicine discovery combined with insurance record data mining identifies sildenafil as a candidate drug for Alzheimer’s disease. Nat Aging. 2021;1(12):1175–1188. doi: 10.1038/s43587-021-00138-z
- Nguyen PA, Born DA, Deaton AM, et al. Phenotypes associated with genes encoding drug targets are predictive of clinical trial side effects. Nat Commun. 2019;10(1):1579. doi: 10.1038/s41467-019-09407-3
- Xu X, Jaberi-Douraki M, Anwer F, et al. A novel risk assessment metric for antimyeloma therapies and drug interactions. J Clin Oncol. 2023;41(16_suppl):e24082–e24082. doi: 10.1200/JCO.2023.41.16_suppl.e24082
- Xu X, Raza S, Gadara NM, et al. Identification of genes encoding targets associated with adverse events in multiple myeloma. J Clin Oncol. 2023;41(16_suppl):1556–1556. doi: 10.1200/JCO.2023.41.16_suppl.1556
- Jaberi-Douraki M, Xu X, Faiman B, et al. Disparities in multiple myeloma: A global perspective on drug toxicity trends. J Clin Oncol. 2023;41(16_suppl):8015–8015. doi: 10.1200/JCO.2023.41.16suppl.8015
- Drögemöller BI, Monzon JG, Bhavsar AP, et al. Association between SLC16A5 genetic variation and cisplatin-induced ototoxic effects in adult patients with testicular cancer. JAMA Oncol. 2017;3(11):1558–1562. doi: 10.1001/jamaoncol.2017.0502
- Wolff J, Hefner G, Normann C, et al. Predicting the risk of drug–drug interactions in psychiatric hospitals: a retrospective longitudinal pharmacovigilance study. BMJ Open. 2021;11(4):e045276. doi: 10.1136/bmjopen-2020-045276