
Abstract
The likelihood of environmental and health impacts of silicon dioxide nanoparticles (SiNPs) has risen, due to their increased use in products and applications. The biological potency of a set of similarly-sized amorphous SiNPs was investigated in a variety of cells to examine the influence of physico-chemical and biological factors on their toxicity. Cellular LDH and ATP, BrdU incorporation, resazurin reduction and cytokine release were measured in human epithelial A549, human THP-1 and mouse J774A.1 macrophage cells exposed for 24 h to suspensions of 5–15, 10–20 and 12 nm SiNPs and reference particles. The SiNPs were characterized in dry state and in suspension to determine their physico-chemical properties. The dose-response data were simplified into particle potency estimates to facilitate the comparison of multiple endpoints of biological effects in cells. Mouse macrophages were the most sensitive to SiNP exposures. Cytotoxicity of the individual cell lines was correlated while the cytokine responses differed, supported by cell type-specific differences in inflammation-associated pathways. SiNP (12 nm), the most cytotoxic and inflammogenic nanoparticle had the highest surface acidity, dry-state agglomerate size, the lowest trace metal and organics content, the smallest surface area and agglomerate size in suspension. Particle surface acidity appeared to be the most significant determinant of the overall biological activity of this set of nanoparticles. Combined with the nanoparticle characterization, integration of the biological potency estimates enabled a comprehensive determination of the cellular reactivity of the SiNPs. The approach shows promise as a useful tool for first-tier screening of SiNP toxicity.
Introduction
Synthetic, amorphous silicon dioxide nanoparticles (SiNPs) have a growing use in coatings, paints, adhesives, composites, cosmetics, food additives and in the biomedical field in drug delivery and diagnostics (Kim et al., Citation2010; Napierska et al., Citation2010; Park et al., Citation2009). Despite the rapid introduction of nanomaterials to markets and extensive investigations of their toxicological properties, their safety has not yet been well established. Safety assessments of the silica-based nanomaterials in food and consumer applications have been attempted and appear reasonable (Jacobs et al., Citation2015; Michel et al., Citation2013). However, it has also been stressed to consider each nanomaterial on a case-by-case basis due to the heterogeneity in their properties, which can influence their biological activity. These properties include surface chemistry, polarity, porosity, particle size and morphology, solubility and chemical purity (Fruijtier-Pölloth, Citation2012; Rabolli et al., Citation2010, Citation2011). Therefore, systematic studies with well characterized nanomaterials and defined protocols are necessary to obtain an understanding of the influence of physico-chemical and biological factors on their toxicity.
Macrophages and epithelial cells of the bronchi and alveoli are the critical cells involved in processing inhaled particulates. The cells respond by locally releasing inflammatory mediators for chemotaxis and inducing the phagocytic/endocytic uptake of the particles from the airways. When particles are present in large amounts or are highly noxious, antigen presentation and inflammation are utilized to recruit cells from the systemic circulation to aid in resolving the heightened lung insult (Miyata & van Eeden, Citation2011). These processes are thereby implicated in the clearance of foreign materials from the respiratory system. However, with high lung burden the cellular clearance activities can become inadequate and can result in pathologies, such as those observed in chronic occupational exposures to crystalline silicon dioxide leading to silicosis, a progressive fibrotic lung disease (Davis, Citation1986; Ding et al., Citation2002; Hnizdo & Sluis-Cremer, Citation1993). Overall, these studies establish a clear paradigm linking inhaled particulates with morbidity and mortality in humans. Moreover, in the context of air pollution, exposures to high levels of ambient particulate matter also contribute to cardiovascular disease and mortality (Hnizdo & Sluis-Cremer, Citation1993; Pope et al., Citation2009).
Although chronic exposures to micro-sized crystalline silicon dioxide result in silicosis in humans (Davis, Citation1986; Ding et al., Citation2002; Hnizdo & Sluis-Cremer, Citation1993), synthesized amorphous silicon dioxide particles such as precipitated or colloidal particles are thought to be less toxic and non-fibrogenic in animal models (Johnston et al., Citation2000; Lee & Kelly, Citation1992). However, the body of evidence from both in vitro and in vivo toxicological studies shows that amorphous nano forms of silicon dioxide particles present some toxicological hazards to human health. Based on in vitro findings, the effects of exposure to amorphous SiNPs include cytotoxicity, reactive oxygen species (ROS) production and pro-inflammatory effects, while the in vivo studies report a generally reversible pulmonary inflammation, localized emphysema, granulomatous lesions and silicotic nodules with a potential for establishment of a pro-fibrotic milieau (Byrne & Baugh, Citation2008; Chen et al., Citation2014; Choi et al., Citation2008; Napierska et al., Citation2010). Limited evidence for a genotoxic potential of SiNPs also exists (Golbamaki et al., Citation2015; Kwon et al., Citation2014).
Since silica-based nanoparticles are already commercially available, they may present a potential for exposure in occupational settings, including during synthesis, transportation and use. A strong linkage between the SiNP physico-chemical characteristics and toxicological effects has been established (Napierska et al., Citation2010). However, a clear understanding of the contributions and roles of specific SiNP characteristics in inducing toxicity is an area of fervent investigation. This study aimed to determine the cytotoxic and inflammatory potential of a set of commercially available amorphous SiNPs in cells of distinct origin (human vs. murine) and type (epithelial vs. macrophage), which are the primary cell types included in processing of inhaled particles in vivo. The determination of the SiNP physico-chemical parameters associated with the biological effects was subsequently sought.
Methods
Particles
Amorphous silicon dioxide nanoparticles (SiNPs); SiNP (10–20 nm, cat # 637238), SiNP (5–15 nm, cat # 637246) and SiNP (12 nm, cat # 718483) were obtained from Sigma-Aldrich (ON, Canada). The Standard Reference Material (SRM)-1879a (respirable cristobalite, CRI SiO2) and SRM-154b (titanium dioxide, TiO2) were obtained from the National Institute of Standards and Technology (NIST; MD). The SRM-1879a was used as supplied, while SRM-154b was washed three times with methanol, and three times with phosphate-buffered saline (Vincent et al., Citation1997). The NIST SRMs were included for comparative purposes, based on their historical use across studies, for cellular responses to mineral particles.
Characterization of particles
Detailed description of particle physico-chemical analyses is provided in the supplemental section. Briefly, the following methods were conducted;
Surface area and pore volume
All SiNPs were measured by nitrogen adsorption at 77 K using the ASAP 2020 adsorption analyzer (Micromeritics, GA) following procedure reported previously (Das et al., Citation2007, Citation2014).
Determination of surface organic content
The weight loss from the SiNP samples was determined by thermogravimetric analysis (TGA) using a TA Instruments Q5000 IR instrument (Waters Limited, ON, Canada) following a previously reported method (Das et al., Citation2014).
Determination of elemental concentration
The SiNP samples were acid-digested following procedure provided in the supplemental section. The metal contents of the acid-digested solutions were measured using Inductively Coupled Plasma-Atomic Emission Spectroscopy (ICP-AES; Varian Vista-Pro, Australia) and -Mass Spectrometry (ICP-MS; Agilent 7700×, MA). Samples were diluted where the concentration was above the upper limit of the calibration (100 ppb).
Quantitation of surface acidity
The total acidity of the surface of SiNPs was quantified following the acid-base titration procedure reported earlier (Eitan et al., Citation2003; Kumarathasan et al., Citation2015).
Particle size and morphology in dry state
The size of the SiNPs was assessed by Transmission Electron Microscope (TEM; JEOL JEM-2100F field emission, MA) equipped with an ultra-high resolution pole-piece operating at 200 kV, while the presence of agglomerates and their morphology were assessed by Scanning Electron Microscope (SEM; JSM-7500F FESEM (JEOL), MA) equipped with a Field Emission Gun (Das et al., Citation2014).
Particle size and surface potential in liquid media
The hydrodynamic diameter of SiNPs in liquid media was determined by Dynamic Light Scattering (DLS) using Zetasizer Nano ZS (Malvern Instruments, UK) as reported earlier (Das et al., Citation2014). The analysis of SiNP size and the electrokinetic potential of particle dispersions was conducted in ultrapure water, Dulbecco’s Modified Eagle’s Medium (DMEM; phenol red-free, 4.5 g/L glucose) and DMEM +5% (v/v) fetal bovine serum FBS (Fisher Scientific, ON, Canada) at particle concentrations corresponding to the 30 and 100 μg/cm2 doses per well surface area.
Cell culture
Human lung epithelial (A549), human peripheral blood monocytes (THP-1) and murine macrophage (J774A.1) cell lines were obtained from American Type Culture Collection (ATCC; VA). The cells were maintained as described in the supplemental section. All cells were cultured in 75 cm2 tissue culture flasks (Corning, NY) at 37 °C with 5% CO2 and 95% relative humidity.
For experiments, A549 and J774A.1 cells were cultured in DMEM (phenol red-free) with 10% FBS, in 96-well plates at 10,000 and 20,000 cells/well (∼0.32 cm2 surface area; 100 μL medium) respectively, using a repeater pipette. J774A.1 cell suspensions were strained through a 100 μm cell strainer prior to counting and seeding. Cell counts were determined using the Multisizer 3 Coulter Counter (Beckman Coulter, ON, Canada). The cell monolayers were cultured for 24 h prior to exposure to particles. THP-1 monocytes were seeded in 96-well plates at 120,000 cells/well, in 100 μL of complete RPMI-1640 medium (phenol red-free) supplemented as described above. THP-1 cells were seeded in the presence of phorbol-12-myristate-13-acetate (PMA, 10 ng/mL; Sigma-Aldrich) to induce their differentiation into macrophages. The medium was replaced the next day with 100 μL of fresh media and the cells were incubated for 24 h prior to SiNP exposure.
Preparation of particle suspensions
Stock suspensions of SiNPs (3 mg/mL) and SRMs (10 mg/mL) were prepared in particle buffer (0.19% NaCl, 25 μg/mL Tween-80; Sigma-Aldrich). The final concentration of Tween-80 in a 96-well is below 0.4 ug/mL in the culture medium, with no impact on cytotoxicity or inflammatory cytokine release in cells. The particle suspensions were vortexed for 30 s, sonicated on ice for 20 min using a Branson 2510 water bath sonicator (Branson Ultrasonics, CT) and dispersed by 25 strokes of the homogenizer piston in a Dounce glass-glass micro-homogenizer (Nadeau et al., Citation1996). Particle suspensions were aliquoted into sterile microcentrifuge tubes with o-ring seal screw caps and heated to 56 °C for 30 min. Stock suspensions were stored at −80 °C until use.
Cell exposure to SiNPs
Particle suspensions were thawed to room temperature (RT), sonicated for 20 min and working suspensions were prepared in 100 μL of serum-free medium and re-sonicated for 10 min before adding them at 3, 10, 30 and 100 μg/cm2 of well surface area to the cell monolayers in 100 μL of DMEM +10% FBS using Liquidator 96 (Mettler Toledo, ON, Canada) for A549 and J774A.1 cells and RPMI-1640 + 10% FBS for THP-1 cells. The equivalent exposure concentration was 5, 16, 50 and 160 μg/mL of media +5% FBS (final conc.). After exposure, the cells were incubated at 37 °C with 5% CO2 and 95% relative humidity for 24 h prior to commencement of the integrated assay.
Endotoxin analysis
Stock samples of particles were analyzed for the presence of bacterial endotoxin using the chromogenic Limulus Amebocyte Lysate (LAL; Lonza, MD) test, as described by the supplier, with modification to prevent potential interference of particles with test kit reagents. The procedure is described in the supplemental section.
Sequence of assays
The cytotoxicity of SiNPs was assessed using the integrated bioassay which enabled the analysis of the redox state (resazurin reduction), energy metabolism (cellular ATP) and cell membrane integrity (LDH release) and was conducted as previously described (Kumarathasan et al. Citation2015). Cell proliferation was assessed separately, using the BrdU incorporation assay. All experiments were conducted three times (n = 3), with triplicate samples within each experiment. More detailed descriptions of the assays are provided in the supplemental section.
Cytokines/chemokines
Cytokine and chemokine profiles were established from A549, J774A.1 and THP-1 cell supernatants. J774A.1 supernatants were assessed using a Milliplex MAP mouse cytokine 25-plex panel, while a Milliplex MAP 27-plex human cytokine panel (EMD-Millipore, MA) was used for A549 and THP-1 cells. The quantification of cytokines/chemokines was done using the Bio-Plex 200 array reader (Bio-Rad, ON, Canada), according to the supplier-recommended procedure, outlined in more detail in the supplemental section. The baseline levels of the cytokines/chemokines are presented (Table S1).
Particle potency estimates
The dose-response data for cytotoxicity assays and cytokine release were normalized to the mean value of all controls (0 μg dose of particles), to obtain fold-effect (FE) for each particle dose. Potency (β) is derived from
where, β represents the rate of change of dose with respect to the logarithm of fold-effect for a given endpoint (Vincent et al. Citation1997). The dose-response data were fitted using CurveExpert v1.4 (D. Hyams, TN).
Cytotoxic potency (βV) represents the average of the assay-specific potencies for each cell line (βV A549, βV THP-1, βV J774A.1) and across cell lines (βV CELLS). Similarly, biological reactivity (βR) of the particles was obtained by averaging the absolute values (to capture deviations from control levels). An average potency for inflammation (βI–V) was calculated within each cell line and across the cell lines using +1*βI–V for chemokines and pro-inflammatory cytokines and −1*βI–V for anti-inflammatory cytokines. The mediators IL-1ra, IL-4, IL-9, IL-10 and IL-13 are considered as anti-inflammatory. While IL-6 is a pleiotropic cytokine, it was assumed to be pro-inflammatory for the purposes of this manuscript (Cuneo & Autieri, Citation2009; Opal & DePalo, Citation2000). The βI–V (corrected for viability on a dose-by-dose basis) represents an unbiased potency estimate signifying an apparent decrease of cytokine release due to cell death, or an increase in cytokine release due to an increase of cell mass in the wells. Finally, βR and βI–V were integrated to calculate cell-specific beta potencies (Iβ) within the cell lines (IβA549, IβTHP-1, IβJ774A.1) and across the cell lines (Iβ CELLS). The detailed equations for the integration of the potency estimates are provided in the supplemental section.
Dosimetric adjustment for SiNP aggregates
Sedimentation of nanomaterials in cell culture models is sensitive to particle aggregate size and density. The phenomenon has been discussed in detail by others (Cohen et al., Citation2013; DeLoid et al., Citation2014; Pal et al., Citation2015). In order to assess the sensitivity of our conclusions to dose biases between the different SiNPs, we have made an assumption of higher effective density and increased fractional deposition rate for the SiNP (12 nm) in relation to the trend of lower hydrodynamic diameter, using the worst case scenario for SiNPs extracted from Table 1 of Cohen et al. (Citation2014). Thus for SiNP (12 nm; particle hydrodynamic diameter dH = 385 nm for the 100 ug/cm2 dose in exposure-equivalent media; Table S2) we assumed a fractional deposition rate of α = 0.026 h − 1, and for the SiNP (5–15 nm; dH = 576 nm; Table S2) and SiNP (10–20 nm; dH = 805 nm; Table S2) we assumed a fractional deposition rate of α = 0.014 h − 1 (Cohen et al., Citation2014). Solving
for a t = 24 h in vitro exposure, the fractional deposited dose, or the ratio of deposited dose to administered dose for SiNP (12 nm), was estimated at 0.46, whereas the fractional deposited dose for SiNP (5–15 nm) and SiNP (10–20 nm) was estimated at 0.28. Thus consequently, we also consider in the data analyses that cells exposed to SiNP (12 nm) could have been exposed to 64% (1.64×) more material after 24 h than the cells exposed to the other two SiNPs.
Table 1. Physico-chemical properties of the particles.
Statistical analyses
Experimental data (FE) from all assays and cytokine release, as well as the β cytotoxic potency, biological reactivity and inflammatory potency estimates were statistically analyzed by the three-way Analysis of Variance (ANOVA) using SigmaPlot version 12.5 software (Systat Software, San Jose, CA). Tukey’s multiple comparisons test was used to elucidate the patterns of significant effects (α = 0.05).
Clustering of particles based on their effects on cytokines/chemokines release by the individual cell lines and the visualization of the data were performed using the GenePattern version 3.6.0 (Broad Institute, MIT, Cambridge, MA) webtool (Reich et al., Citation2006) and Java TreeView plugin version 1.16.r2 (Saldanha, Citation2004). Principal component analysis (PCA) of the cellular cytokine profiles (significant by ANOVA) was conducted using Minitab v15.1 software (Minitab Inc., PA). The pathways and biological functions impacted by SiNP exposures of the cells were identified using the Ingenuity Pathway Analysis (IPA; Ingenuity Systems, CA). Further details on the statistical analyses conducted in the present manuscript are provided in the supplemental section.
Results
Characterization of SiNPs
The particle characteristics are shown in which contains the data generated by the authors and those provided by the commercial suppliers. Some differences between the two datasets (i.e. author and suppliers) were observed. For example, BET surface area of SiNP (12 nm) determined is ∼30% larger than the value provided by the supplier (302 m2/g vs. 175–225 m2/g), while those for SiNP (5–15 nm) were similar (613 m2/g vs. 590–690 m2/g). The BET surface area for SiNP (10–20 nm) was 840 m2/g while a measurement was not available from the commercial supplier. All SiNPs had similar external surface areas (SAext) and total pore volumes (Vt). In contrast, SiNP (10–20 nm) and SiNP (5–15 nm) contained micropores while SiNP (12 nm) did not.
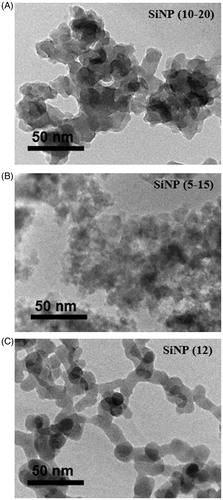
The particle size of all materials was determined by TEM or SEM. Agglomerated, irregularly shaped SiNPs were observed (). Based on unit particle size measurements within the agglomerates, SiNP (12 nm), (10–20 nm) and (5–15 nm) showed a mean size of 16.4 nm, 32.2 nm and 19.5 nm respectively in relatively good agreement with the supplier-provided data (). The SiNPs were agglomerated in dry form (Figure S2A–F), with the highest level observed for SiNP (12 nm), forming large globular agglomerates (Figure S2E, F). The TiO2 particles formed aggregates of ca. 20 μm, while individual TiO2 particles were generally spherical (Figure S3A, B). CRI particles were irregularly shaped with approximate size of 5 μm (Figure S3C, D). CRI particles did not tend to aggregate and appeared highly crystalline. The size of the reference particles was in general agreement with that reported by NIST ().
Figure 1. Transmission electron microscopy images of the amorphous SiNP particles. The images of (A) SiNP (10–20 nm), (B) SiNP (5–15 nm) and (C) SiNP (12 nm) are presented. Scale bars are indicated in the lower left corner of each image.
The TGA of the SiNPs showed two stages of weight loss during calcination; sharp weight loss below 200 °C and a gradual weight loss from ca. 350 °C until 800 °C (Figure S4). The weight loss beyond 200 °C for SiNP (10–20 nm), (5–15 nm), (12 nm) amounted to 5.0%, 2.6%, and 0.29%, respectively, and represents the surface organic content ().
The quantitation of SiNP surface-associated silanol ‘–OH’ groups from the acid-base titration indicated that the surface acidity of the SiNP (12 nm) is significantly higher (about 2-fold) than that of the SiNP (5–15 nm) and (10–20 nm), both of which were similar (; two-way ANOVA, SiNP (12 nm) vs. (5–15 nm) and (10–20 nm), p < 0.001).
The endotoxin analysis showed that LPS was not present in the SiNP stock suspensions. Only a trace amount of LPS was observed in the SRM stock suspensions ().
Based on the data provided by the commercial supplier, SiNPs (12 nm) and (10–20 nm) had total trace metal content of ca. 30 ppm while that of SiNP (5–15 nm) was 797 ppm (). The analyses of trace metals by ICP-MS/-AES (Table S3A) showed a marked difference in metal composition from that indicated by the suppliers (Table S3B). No correlations could be established between the matching elements.
All SiNPs were further characterized in water, DMEM and DMEM +5% FBS using DLS (Table S2). Two SiNP concentrations tested (50, 160 μg/mL) corresponded to the doses of 30 and 100 μg/cm2 of well surface area, respectively. The DMEM +5% FBS represented the cell exposure media. In all three media, some agglomeration of the SiNPs was observed. However, SiNP (12 nm) agglomerates were consistently smaller than those formed by the (5–15 nm) and (10–20 nm) SiNPs (three-way ANOVA, SiNP (12 nm) across media type, p < 0.001). The SiNP (12 nm) in DMEM +5% FBS showed a higher hydrodynamic size, 386 ± 128 nm at 160 μg/mL, compared to 184 ± 7 nm at 50 μg/mL indicating that particle concentration significantly impacts the aggregation in protein-rich media (DMEM +5% FBS; three-way ANOVA; SiNP conc. within media-type; p = 0.011).
In liquid media, all SiNPs formed dispersions with negative particle surface charge (Table S2). In water, the SiNP dispersions were highly stable, with ζ below −25 mV. In DMEM, ζ values became less negative for all particles at both concentrations tested, with SiNP (12 nm) showing the least change. However, in DMEM +5% FBS, SiNP ζ values changed substantially to the range of −9.6 to −10.6 mV at both concentrations (Table S2), indicating an increase in the instability of the particle suspensions (Hunter, Citation2006), with particles coagulating and flocculating towards the formation of agglomerates.
Cytotoxicity
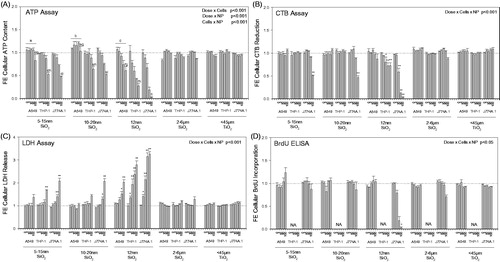
The SiNPs decreased ATP in a dose-responsive manner (; three-way ANOVA, Dose x PM, p < 0.001), with SiNP (12 nm) showing the highest impact on ATP levels in all three cell lines (A549, THP-1, J774A.1), compared to SiNPs (10–20 nm) and (5–15 nm), which showed similar effects. Small elevation above control was observed in ATP levels of A549 cells exposed to the low doses of the SiNPs (three-way ANOVA, Cells within PM, p < 0.001), which was not seen in the macrophages (). Overall, the macrophage cell lines were more sensitive to SiNP exposure than A549 cells, with J774A.1 cells most impacted (; three-way ANOVA, Dose x Cells, p < 0.001). The ATP levels in the macrophage cell lines were more affected by SiNP exposures than the epithelial cells (; three-way ANOVA, Cells × PM, p < 0.001). Similar observations were made in the LDH, membrane integrity assay where the cellular responses to the SiNPs were cell type-, particle- and dose-dependent (; three-way ANOVA, Dose × Cells × PM, p < 0.001). J774A.1 cells released most LDH in response to SiNP (12 nm), followed by the other two SiNPs. SiNPs affected the cellular redox status in macrophages but not epithelial cells, as seen by the decreased reduction of resazurin by cells (; three-way ANOVA, Dose × Cells × PM, p < 0.001). SiNP (12 nm) was the most potent, causing the largest decrease in resazurin reduction in J774A.1 cells, followed by THP-1 cells. Cell proliferation in J774A.1 cells was significantly decreased by SiNP (12 nm) but not (5–15 nm) and (10–20 nm) SiNPs (; three-way ANOVA, Dose × Cells × PM, p < 0.05). A549 cell proliferation was not affected by particle exposures. It should be noted, that proliferation of THP-1 cells was not assessed as they lose their proliferative capacity upon PMA-induced differentiation to macrophages (Schwende et al., Citation1996). The CRI and TiO2 SRMs did not significantly alter any of the assessed cytotoxicity endpoints, with only marginal changes observed in macrophages.
Figure 2. Cytotoxic profile of three mammalian cell lines exposed to 3, 10, 30 and 100 μg/cm2 of the particles for 24 h. The A549, THP-1 and J774A.1 cell lines were exposed to SiNPs and SRMs (24 h). An integrated bioassay was performed comprising of (A) ATP assay, (B) LDH assay (release), (C) CTB assay and (D) BrdU ELISA. (A) Three-way ANOVA, two-way interactions: Cells × PM, Dose × PM, Dose × Cells, p < 0.001, Tukey comparisons: (a) cells treated with SiNP (5–15 nm), A549 vs J774A.1 and A549 vs THP-1, p < 0.001, (b) cells treated with SiNP (10–20 nm), A549 vs J774A.1 and A549 vs THP-1, p < 0.001, (c) cells treated with SiNP (12 nm), A549 vs J774A.1 and A549 vs THP-1, p < 0.001, (d) dose for SiNP (5–15 nm), 100 μg/cm2 different from all other doses, p < 0.001, (e) dose for SiNP (10–20 nm), 100 μg/cm2 different from all other doses, p < 0.001, (f) dose for SiNP (12 nm), 100 μg/cm2 different from all other doses, p < 0.035, (g) dose in A549 cells, 100 μg/cm2 different from all other doses, p < 0.012, (h) dose in A549 cells, 100 μg/cm2 different from all other doses, p < 0.001, (i) dose in A549 cells, 100 μg/cm2 different from all other doses, p < 0.001; (B-C) Three-way ANOVA, three-way interaction: Dose × Cells × PM, p < 0.001; (D) Three-way ANOVA, three-way interaction: Dose × Cells × PM, p < 0.05; (B–D) Asterisks indicate effects significantly different from 0 μg dose cells, Tukey comparisons, *p < 0.05, **p < 0.001; (D) BrdU ELISA was not available for differentiated THP-1 cells. Data were expressed as mean fold-effect (FE) ± SEM for n = 3 independent experiments, with three technical replicates within each experiment.
Cytokines/chemokines
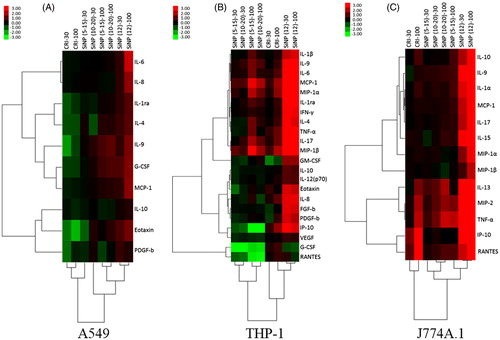
Particle exposures differentially affected the cellular cytokine/chemokine release profiles (, Figures S5–S7). In the three cell lines, SiNP (12 nm) particles induced the release of most of the detected cytokines/chemokines to a higher extent, causing them to cluster separately from the other particles. In A549 cells, the particles affected cytokine release profiles at a lesser magnitude compared to the macrophages. Also in A549 cells, there was a clear contrast in the cytokine profile between SiNP-exposed cells compared to CRI (). In THP-1 cells, two distinct groups, one of decreased and the other of increased cytokine release were revealed in response to (SiNP (5–15 nm) and (10–20 nm) exposures, separate from the intermediate effects of CRI and the strong induction of cytokine release by SiNP (12 nm) of the majority of cytokines/chemokines (). In J774A.1 cells, an SiNP (12 nm)-driven induction of the majority of the detected cytokines/chemokines formed a cluster separate from the responses induced by the remaining particles. These were separated into two distinct clusters of cytokines/chemokines based on their response to CRI and SiNP (5–15 nm) and (10–20 nm); i.e. markers released at contrasting high and low levels (). Based on the cytotoxicity results, both SRMs, CRI and TiO2 showed similar response. Therefore, cell culture supernatants from CRI-exposed cells only were selected for cytokine analysis. Moreover, CRI was deemed more relevant because of its same elemental composition as the SiNPs.
Figure 3. Secretory cytokine profiles of cells exposed to particles. Hierarchical cluster analysis and heatmap of statistically significant cytokines by ANOVA (p < 0.05), fold changes in abundance of secretory cytokines in each cell line are presented: (A) A549, (B) J774A.1 and (C) THP-1. All treatments were expressed relative to an untreated control (fold-effect) and adjusted for consensus (average across assays) cytotoxic response at each particle dose level (30 and 100 μg/cm2). The dataset was log(2) transformed. The bar illustrates the color coding for the cytokines produced by the cells exposed to SiNPs and SRMs. Green indicates decreased cytokine production and red indicates increased cytokine production relative to control groups. The vertical dendrogram represents the clustering of cytokines/chemokines and the horizontal dendrogram represents the clustering of particles. The analysis was based pooled samples of 2–3 wells per sample within each experiment conducted in triplicate experiments (n = 3).
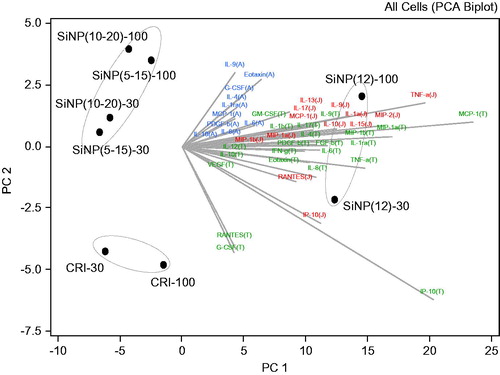
The inflammatory markers (from 30, 100 μg/cm2 dose exposures) released by the cell lines at significant levels (based on ANOVA) were analyzed using PCA to identify markers that contribute the most to the overall pattern of the observed particle effects. It was found that the first three PCs (PC1, PC2 and PC3) contributed to 95.7% of the variation in the dataset (Table S4). The analysis revealed a distinct grouping of particles based on the cellular cytokine release patterns, highlighting the unique high inflammatory effects of SiNP (12 nm), the similarity in response of the cell lines to SiNPs (5–15 nm) and (10–20 nm) and the distinct response of the cell lines to CRI (). Based on the factor loading of the principal components, the following cytokines were determined to be the main contributors to the contrasting clustering of the particles in the cell lines tested: IL-9 and eotaxin for A549; G-CSF, IP-10, MCP-1, MIP-1α, MIP-1β, RANTES, TNF-α for THP-1; IL-10, IP-10, MIP-2, RANTES, TNF-α in J774A.1 (, Table S5).
Figure 4. Cytokine drivers of particle effects in A549, THP-1 and J774A.1 cell lines. Principal component analysis was conducted to identify the principal components that explain majority of the variability in the dataset. The cytokine data from cell exposures to particles (30, 100 μg/cm2) were expressed as fold-effect over control, adjusted for cytotoxicity and log(2) transformed. The bi-plot is a combination of the score plot which shows the score of each PC for each particle observation and the loading plot which shows the load of each cytokine on the identified PC. The letters A, J and T in brackets following the cytokines abbreviate A549, J774A.1 and THP-1 cells, in which the specific analyte was assessed.
Particle potency assessment
In order to reduce the complexity of the dataset, the dose-response data from particle exposures were summarized in terms of simplified descriptor Beta (β) derived for each endpoint of cytotoxicity (βV) or cytokine release (βI–V), as well as averaged across all cytotoxicity assays, or all cytokines to facilitate a rank-based comparison of the overall toxicological profile of each SiNP (Iβ). A plot of βV values based on all cytotoxicity assays conducted across the three cell lines revealed that SiNP (12 nm) was the most cytotoxic particle, indicated by the highest negative potency values (three-way ANOVA, PM main effect, p < 0.001), while the SRMs were consistently the least cytotoxic (, Table S6). Overall, the βV was correlated between cell lines; THP-1 vs. J774A.1 (R = 0.998, p < 0.001), THP-1 vs. A549 (R = 0.897, p < 0.05) and A549 vs. J774A.1 (R = 0.888, p < 0.05) cells. Based on βR, SiNP (12 nm) had the highest biological reactivity in each cell line (Table S6). Averaging of the βV and βR across cell lines confirmed the highest ranking of SiNP (12 nm) based on the consensus of the cytotoxicity assays (). Similarly, based on βI–V CELLS, which represents the consensus inflammatory potency of each particle, derived from cellular cytokine profiles and averaged across cell lines, SiNP (12 nm) was ranked highest (). Some difference was seen in the ranking of the particles compared to the cytotoxicity-based ranking: i.e. SiNP (5–15 nm) and (10–20 nm) were overall less potent in inducing inflammatory mediators than CRI ().
Figure 5. (A) Plot showing the distribution of the particles based on their cytotoxic potency (βV) as measured by CTB, ATP and LDH assay (cell content), with a left to right and top to bottom direction of increasing potency. Three-way ANOVA, PM main effect, p < 0.001, SiNP (12 nm) vs. SiNP (10–20 nm), SiNP (5–15 nm), SiO2 and TiO2, p < 0.001; SiNP (5–15 nm) vs. SiO2 and TiO2, p < 0.05; Cells main effect, p < 0.001, A549 vs. J774A.1 vs THP-1, p < 0.001; Assay main effect, p = 0.004, CTB vs ATP, LDH, p < 0.05; (B) Plot showing the association of the consensus biological reactivity (βR; average of absolute values of cytotoxic potency) and consensus inflammatory potency (βI-V; average of cytokine potency) of the particles in A549, J774A.1 and THP-1 cells with a right to left and bottom to top direction of increasing potency. Three-way ANOVA, PM main effect, p < 0.001, SiNP (12 nm) vs. SiNP (10–20 nm), SiNP (5–15 nm) and SiO2, p < 0.001; Cells main effect, p < 0.001, A549 vs. J774A.1, p < 0.001, THP-1 vs. J774A.1, A549, p < 0.05; Potency Estimate, p = 0.064, not significant.
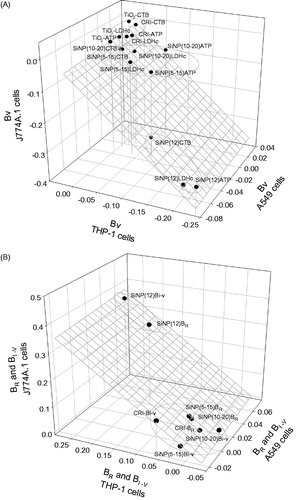
Table 2. Integrated (cytotoxic and inflammatory) particle potency estimates across cell lines (A549, J774A.1 and THP-1).
Despite the contrasting particle ranking based on cytotoxicity and the inflammatory response (), the βR and βI–V estimates were marginally correlated (R = 0.943, p = 0.057). As observed for the βV profile (), SiNP (12 nm) remained the most potent particle, based on βR and βI–V estimates (; three-way ANOVA, PM main effect, p < 0.001), with SiNPs (10–20 nm), (5–15 nm) and CRI grouped together, with a contrast in the inflammatory potency profile of the particles in the epithelial cells vs. the macrophages. Thus, THP-1 and J774A.1 βI-V estimates were significantly correlated (R = 0.991, p = 0.009), while THP-1 vs. A549 (R = 0.840, p = 0.160) and A549 vs. J774A.1 (R = 0.897, p = 0.103) were not associated.
Finally, the biological reactivity and inflammatory response across the cell lines were combined into an integrated potency estimate for each particle. Based on IβCELLS, SiNP (12 nm) was 6.1×, 8.3× and 10.4× more potent than CRI, SiNP (5–15 nm) and (10–20 nm), respectively (). The higher potency of SiNP (12 nm) exceeded by far the fold-change which was expected simply from higher deposition (1.64×).
Pathway analysis
Pathway analysis was conducted on the cytokine mediators from SiNP and CRI exposures in the three cell lines. The profiles of the interrogated mediators were associated with a number of common and unique cell type-specific functions (). The functions common to the three cell lines included cell-to-cell signaling and cellular movement. Cellular development and cell growth and proliferation were highlighted in the macrophages. Note that, since THP-1 cells do not proliferate in their differentiated state, the highlighted cellular function may indicate cellular growth and/or development in the case of this cell line. Other indicated pathways were unique to a particular cell line; lipid metabolism, molecular transport and biochemistry in A549; cell morphology in THP-1; cell death and survival in J774A.1 (). The cytokine expression profiles and a list of some of the top functional roles underlying the cellular functions are presented (Table S5). The main inflammatory mediators driving the differential response of the cell lines to the silica-based particles, as identified by the PCA (, Table S4) were associated with the unique cellular functions identified by the IPA ( and Table S4).
Table 3. Top cellular function categories from IPA (highest Z-scores) of the cell lines exposed to 30 and 100 μg/cm2 doses of the particles.
Correlation of SiNP characteristics with their toxicological profile
Correlations of the integrated consensus potency estimates for biological reactivity (βR CELLS), pro-inflammatory potency (βI–V CELLS) and integrated potency (Iβ CELLS) of the individual SiNPs with their physico-chemical characteristics were conducted (; Table S7). The analysis revealed a significant (p < 0.05) positive association of the integrated consensus potency estimates with surface acidity (surface –OH); βR CELLS (R = 1.0, p = 0.015), βI–V CELLS (R = 1.0, p = 0.019) and Iβ CELLS (R = 1.0, p = 0.018). Interestingly, a significant negative association was also revealed for the integrated SiNP potency estimates and their transition metal content; βR CELLS (R= −0.998, p = 0.037), βI–V CELLS (R= −0.999, p = 0.033) and Iβ CELLS (R= −0.999, p = 0.034). Also, a marginally significant (0.05 < p < 0.1) positive association was observed between the integrated consensus SiNP potency estimates and the dry-state particle agglomerate size; βR CELLS (R = 0.996, p = 0.058), βI–V CELLS (R = 0.996, p = 0.054) and Iβ CELLS (R = 0.996, p = 0.055), (). No other physico-chemical characteristics of the SiNPs that were measured were significantly associated with the potency estimates of SiNP exposure (Table S7).
Table 4. Pearson’s product moment correlations of the average particle potency estimates in vitro and the physico-chemical characteristics of the SiNPs.
Discussion
The SiNPs induced cytotoxicity and stimulated the release of inflammatory mediators. Despite the similar size of the SiNPs, a difference in their cytotoxic and inflammatory potency was observed across all cell lines. The impact of cellular function and species origin on the toxicological potential of the SiNPs was made apparent in this work. As previously shown, based on a variety of cytotoxicological endpoints, macrophages are more sensitive than epithelial cells to exposures to particles. This has been demonstrated in exposures to urban air particles (Breznan et al., Citation2016), carbon nanotubes (Kumarathasan et al., Citation2015), soluble metals from combustion-derived particulates (Riley et al., Citation2005) or various metallic nanomaterials (Lanone et al., Citation2009). This type of cellular response is observed irrespective of the type and origin of the particles (e.g. environmental and engineered), suggesting that it may relate to the functional difference of the cell types.
The lower rate of endocytic particle uptake by epithelial cells is consistent with the barrier-type function of the alveolar epithelium, in contrast to the rapid phagocytic uptake of particles by macrophages associated with their clearance function. The J774A.1 macrophages take up polystyrene particles by phagocytosis and micropinocytosis, in contrast to A549 epithelial cell’s uptake by clathrin- and caveolae-mediated endocytic pathways (Kuhn et al., Citation2014). In the present study, cytotoxic potency profile of the SiNPs was correlated between the macrophages and epithelial cells. In contrast, the inflammatory potency profile was only correlated between the J774A.1 and THP-1 cells, but not between these macrophage cell lines and the epithelial A549 cells. Although the cytotoxic ranking of the SiNPs was comparable across the cell lines, the J774A.1 cells were the most sensitive to SiNP exposure. Similarly, rat lung epithelial cells (RLE-6TN) are shown to be more sensitive to metal exposures than A549 cells, while displaying similar cytotoxic trends (Riley et al., Citation2005). In agreement, pathway analysis of J774A.1 cytokine/chemokine profile highlighted apoptosis/necrosis of blood cells as one of the top functions associated with the silica-based particles. The cell death function was not identified in the THP-1 and A549 profiles.
The cytotoxic and inflammatory potency-based ranking of the particles across the cell lines and the integrated potency estimate IβCELLS revealed that SiNP (12 nm) was the most potent particle. While CRI had a low cytotoxic potency (βV CELLS) ranking, it was highly ranked by its inflammatory potency (βI–V CELLS) indicating that it is a potent trigger for cytokine release in macrophages. However, it was inhibitory to a number of cytokines in A549 cells. Similarly, crystalline or amorphous silica-based particles are highly cytotoxic in mouse alveolar macrophages (MH-S), while epithelial cell lines MLE, NIH-3T3, MDCK and HeLa are virtually resistant (Costantini et al., Citation2011). In the present study, CRI displayed low cytotoxic potency relative to SiNPs, however it had some impact at the highest dose of exposure in the macrophages.
The PCA revealed contrasting cytokine/chemokine profiles across cell lines exposed to particles, highlighting the contributions of IL-9, eotaxin in A549 cells; G-CSF, IP-10, MCP-1, MIP-1α, MIP-1β, RANTES, TNF-α in THP-1 cells; and IL-10, IP-10, MIP-2, RANTES, TNF-α in J774A.1 cells. Although SiNP (12 nm) elicited an increase in IL-9 and eotaxin levels in A549 cells, these markers were inhibited by CRI exposure, while SiNP (5–15 nm) and (10–20 nm) induced an intermediate response. Eotaxin, MIP-1α, MCP-1 and RANTES stimulate the chemotaxis of eosinophils and other leukocytes from circulation to the airways, inducing eosinophilic lung inflammation (Lloyd & Gutierrez-Ramos, Citation2003). Overexpression of IL-9 in allergen-exposed TG5 mice results in lung eosinophilia, increased serum IgE and bronchial hyper-responsiveness (McLane et al., Citation1998). Similarly, exogenous IL-9 induces expression of eosinophil chemotactic factors including eotaxin in cultured lung epithelial cells (Dong et al., Citation1999). The induction of the CC-chemokines in A549 cells suggests that the SiNPs, especially SiNP (12 nm) may uniquely induce a potentially pro-allergic milieu. However, these observations require further in vivo study to ascertain the hypothesis. Interestingly, PEG-SiNPs (90 nm) cause innate immune responses at high doses in non-allergic mice and induce Th2/Th17 adjuvant effects at low doses in ovalbumin-sensitized BALB/c mice (Brandenberger et al., Citation2013).
The pathway analysis also highlighted the likelihood of disturbance in lipid metabolism, release of ROS and changes in cytosolic Ca2+ concentrations in the A549 cells. The observations were underscored by the enhanced production of eotaxin, MCP-1 and IL-8 in common between the indicated cellular functions, in addition to other function-specific analytes observed. In fact, amorphous SiNPs have been shown to induce ER stress, dysregulation of Ca2+ homeostasis, activation of MAP-kinase and target genes (cJun, cMyc, CREB), induction of oxidative stress and a down-regulation of p53 in Huh7 human hepatoma cells (Christen et al., Citation2014). Together, these pathways inhibit apoptosis and induce cell proliferation in response to SiNP exposures. In addition, the association of SiNP effects with lipid metabolism in A549 cells suggests the need to examine potential changes in the synthesis of pulmonary surfactant by the epithelial cells and the levels of eicosanoids, which can act as potent neutrophil chemoattractants (Hurley et al., Citation2011).
Similarity in the inflammatory response to particles was observed between THP-1 and J774A.1 cells. The cytokine/chemokine profile of the macrophages was indicative of an environment for proliferation, recruitment, differentiation and maturation of leukocytes. Several mediators including G-CSF, IL-10, IP-10, MCP-1, MIP-1α, MIP-1β MIP-2, RANTES and TNF-α were highlighted by the PCA as the main drivers of the contrasting cellular response to the particles. With the exception of TNF-α, IL-10 and G-CSF, these mediators are CC-/CXC-family chemokines, involved in the recruitment of leukocytes and other cell types to sites of inflammation (Comerford & McColl, Citation2011). Tumor necrosis factor-α is generated primarily by activated macrophages and is involved in the regulation of inflammation, apoptosis, cell proliferation and cell differentiation (Smith et al., Citation1990), while G-CSF is a glycoprotein growth and survival factor for granulocytes and a potent neutrophil attractant (Metcalf, Citation1985). Interleukin-10 inhibits monocyte/macrophage and neutrophil cytokine production and Th1-type lymphocyte responses (Cuneo & Autieri, Citation2009; Opal & DePalo, Citation2000). Similarly to the present report, a whole-genome microarray analysis of RAW264.7 macrophages highlighted a number of neutrophil-attracting chemokines, including Ccl3/MIP-1α and Ccl4/MIP-1β among the most robust early gene regulatory events associated with an exposure to a panel of amorphous (7–500 nm) SiNPs (Waters et al., Citation2009). The inhibition of G-CSF and the induction of IL-1ra, IL-4, IL-10 in THP-1 cells and IL-10, IL-13 in J774A.1 cells, alongside the overwhelmingly pro-inflammatory response in the macrophages highlight the complexity in the inflammatory and compensatory mechanisms in the presence of the silica-based particles. Exposures of macrophages to crystalline SiO2 and amorphous SiNPs resulted in cell death (Costantini et al., Citation2011; Thibodeau et al., Citation2003). The mechanism involves the regulation of caspase-1 activity through the activation of the NALP3/inflammasome and the IL-1α/IL-1β- and TNF-α-induced inflammatory pathways triggered by SiO2 (Pétrilli et al., Citation2007; Rabolli et al., Citation2014). As reported here, IL-1β, TNF-α levels in THP-1 cells and IL-1α, TNF-α in J774A.1 cells were increased in response to CRI and the SINPs, with markedly higher response to SiNP (12 nm), suggesting that the activation of the inflammasome may be anticipated in the macrophages exposed to SiNP (12 nm).
In vitro toxicity assessments using a single cell line and assay can have a limited predictive capability of the toxicity of particle exposures. Thus, we have attempted to circumvent these limitations by integration of multiple assays and cell line responses to obtain a more comprehensive robust potency estimate that is inclusive of a broader range of toxicity effects from particle exposures. The novel approach described in the present work for reducing, integrating and comparing large datasets of cytotoxicity and inflammatory mediators obtained from cells across functions and species provides meaningful results for examining associations between the biological signatures and physico-chemical factors of the particles. The quantity of SiNP surface –OH groups, a measure of particle surface acidity was correlated with biological reactivity βR, inflammatory potency βI–V and the integrated potency estimate Iβ. The silanol (Si–O–H) groups on the surface of SiNPs have a strong polar interactivity and can readily bond to water, other polar moieties and biomolecules. In agreement with our correlation results, silanol groups have been implicated in increased cell membrane damage and IL-8 release in A549 mono- and co-cultures (with endothelial cells) exposed to amorphous SiNPs. These effects were further augmented in the presence of alveolar surfactant phospholipids, presumably through increased ROS generation (Kasper et al., Citation2015). In contrast, lipid/protein-based corona formed around the SiNPs in plasma can protect cells from hemolysis (Shi et al., Citation2012), but will likely not be protective once the complex becomes internalized and processed by the cells. Silanol-associated hydroxyl concentration/density on the surface of pristine SiNPs was shown by others to be associated with their cytotoxic, inflammatory and hemolytic potential (Pavan et al., Citation2013; Pavan et al., Citation2014; Zhang et al., Citation2012). Specifically, strained three-membered silanol groups on fumed amorphous silica surfaces showed the highest potential for cytotoxicity and hemolysis (Zhang et al., Citation2012). Moreover, in the case of crystalline silica polymorphs, the density of surface geminal (but not single) silanol groups appears to be associated with hemolysis, as shown through molecular modeling (Murashov et al., Citation2006). Furthermore, acute inflammatory response of C57BL/6 mice to oropharyngeally-instilled SiNPs (16 nm) is attenuated by controlled adjustment of silanol display on the particle surface using calcination and metal (titanium, aluminum) doping (Sun et al., Citation2015).
Although biological potency estimates did not correlate with total metal content of the SiNPs in the present study, negative correlation with transition metal content was obtained. We observed that SiNPs with higher transition metal content had lower surface acidity and potency (e.g. SiNP (12 nm) vs. (5–15 nm) and (10–20 nm)). In line with Sun et al. (Citation2015), we hypothesize that increased transition metal content (or specific metals) may contribute to the attenuation of SiNP toxicity by occupying free reactive silanols, reducing silanol display and thereby surface reactivity. We also noted a marginally-significant positive correlation of biological potency with dry-state agglomerate size of the SiNPs, likely a consequence of higher electrostatic interaction of the SiNPs which have higher surface silanol coverage. The density of surface silanols can also be a determinant of electrostatic interaction of fumed SiNPs with membrane phospholipids (Zhang et al., Citation2012).
Recent reports highlight the importance of characterizing nanoparticle interactions in liquid suspensions and their impact on in vitro dosimetry, along with determining sedimentation and diffusion rates of suspended nanoparticle agglomerates and non-agglomerated particles to improve estimates of dose delivered to cells (Cohen et al., Citation2013; DeLoid et al., Citation2014; Liu et al., Citation2015; Pal et al., Citation2015). Correction of the β potency estimates for the effective delivered dose of the SiNPs in the present study indicated a 64% (1.64×) increase in deposited dose of SiNP (12 nm) relative to the other SiNPs. However, based on the integrated potency estimates, SiNP (12 nm) was 6–10× more potent than the other SiNPs tested (). Therefore, in the present study, the difference in the SiNP deposition did not account for the marked difference in potency between SiNP (12 nm) and the other SiNPs tested, as well, it did not modify the hazard ranking of the nanoparticles.
Conclusion
Despite similar primary particle size, SiNPs tested had distinct cytotoxicity profiles, comparable across species and cell types. In contrast, the pro-inflammatory potential of the SiNPs in the different cell lines was more nuanced, emphasizing the role of a specific cell type in the toxicological outcome. The pathway analysis revealed distinct cell type-associated cellular functions that may be differentially impacted upon by the particles.
The SiNP (12 nm) was identified as the most potent nanoparticle, with particle surface acidity associated with its cytotoxic and inflammatory potency across the cell lines. Associations with other SiNP properties including dry-state agglomerate size and transition metal components highlight the need for refined understanding of the interrelationships between the various physico-chemical properties. The integration of cytotoxicity and pro-inflammatory endpoints appears to be a promising approach for the derivation of simple but robust potency indices in screening assessment of nanoparticle toxicity. However, due to the heterogeneity of the physico-chemical properties of nanoparticles and their interactions in biological matrices, it remains necessary to test all particles on a case-by-case basis and to conduct targeted validations via in vivo animal exposure studies.
Supplementary_Materials.zip
Download Zip (3.4 MB)Acknowledgements
The authors would like to thank Drs. Daniel Desaulniers and Azam Tayabali for reviewing the manuscript. We are grateful to Andrew Ha, Dawn Jurgens and Tina Tuck for their technical contributions. Drs. Julie S. O’Brien and Surendra Nimesh are recipients of the NSERC Visiting Fellows Award. Ngoc Q. Vuong is a recipient of the Ontario Graduate Scholarship.
Disclosure statement
The authors declare that they have no competing interests. This work was supported by the Chemicals Management Plan (CMP) and the Nanotechnology Section funds, Health Canada.
Additional information
Funding
References
- Brandenberger C, Rowley NL, Jackson-Humbles DN, Zhang Q, Bramble LA, Lewandowski RP, et al. 2013. Engineered silica nanoparticles act as adjuvants to enhance allergic airway disease in mice. Part Fibre Toxicol 10:26.
- Breznan D, Karthikeyan S, Phaneuf M, Kumarathasan P, Cakmak S, Denison MS, et al. 2016. Development of an integrated approach for comparison of in vitro and in vivo responses to particulate matter. Part Fibre Toxicol 13:41.
- Byrne JD, Baugh JA. 2008. The significance of nanoparticles in particle-induced pulmonary fibrosis. Mcgill J Med 11:43–50.
- Chen X, Zhouhua W, Jie Z, Xinlu F, Jinqiang L, Yuwen Q, et al. 2014. Renal interstitial fibrosis induced by high-dose mesoporous silica nanoparticles via the NF-κB signaling pathway. Int J Nanomedicine 10:1–22.
- Choi M, Cho WS, Han BS, Cho M, Kim SY, Yi JY, et al. 2008. Transient pulmonary fibrogenic effect induced by intratracheal instillation of ultrafine amorphous silica in A/J mice. Toxicol Lett 182:97–101.
- Christen V, Camenzind M, Fent K. 2014. Silica nanoparticles induce endoplasmic reticulum stress response, oxidative stress and activate the mitogen-activated protein kinase (MAPK) signaling pathway. Toxicol Rep 1:1143–51.
- Cohen J, Deloid G, Pyrgiotakis G, Demokritou P. 2013. Interactions of engineered nanomaterials in physiological media and implications for in vitro dosimetry. Nanotoxicology 7:417–31.
- Cohen JM, Teeguarden JG, Demokritou P. 2014. An integrated approach for the in vitro dosimetry of engineered nanomaterials. Part Fibre Toxicol 11:20.
- Comerford I, McColl SR. 2011. Mini-review series: focus on chemokines. Immunol Cell Biol 89:183–4.
- Costantini LM, Gilberti RM, Knecht DA. 2011. The phagocytosis and toxicity of amorphous silica. PLoS One 6:e14647.
- Cuneo AA, Autieri MV. 2009. Expression and function of anti-inflammatory interleukins: the other side of the vascular response to injury. Curr Vasc Pharmacol 7:267–76.
- Das DD, Harlick PJE, Sayari A. 2007. Applications of pore-expanded MCM-41 silica: 4. synthesis of a highly active base catalyst. Catal Comm 8:829–33.
- Das DD, Yang Y, O’Brien JS, Breznan D, Nimesh S, Bernatchez S, et al. 2014. Synthesis and physicochemical characterization of mesoporous SiO2 nanoparticles. J Nanomater 12:e176015.
- Davis GS. 1986. The pathogenesis of silicosis. State of the art. Chest 89:166S–9S.
- DeLoid G, Cohen JM, Darrah T, Derk R, Rojanasakul L, Pyrgiotakis G, et al. 2014. Estimating the effective density of engineered nanomaterials for in vitro dosimetry. Nat Commun 5:3514.
- Ding M, Chen F, Shi X, Yucesoy B, Mossman B, Vallyathan V. 2002. Diseases caused by silica: mechanisms of injury and disease development. Int Immunopharmacol 2:173–82.
- Dong Q, Louahed J, Vink A, Sullivan CD, Messler CJ, Zhou Y, et al. 1999. IL-9 induces chemokine expression in lung epithelial cells and baseline airway eosinophilia in transgenic mice. Eur J Immunol 29:2130–9.
- Eitan A, Jiang K, Dukes D, Andrews R, Schadler LS. 2003. Surface modification of multiwalled carbon nanotubes: toward the tailoring of the interface in polymer composites. Chem Mater 15:3198–201.
- Fruijtier-Pölloth C. 2012. The toxicological mode of action and the safety of synthetic amorphous silica-a nanostructured material. Toxicology 294:61–79.
- Golbamaki N, Rasulev B, Cassano A, Marchese, Robinson RL, Benfenati E, et al. 2015. Genotoxicity of metal oxide nanomaterials: review of recent data and discussion of possible mechanisms. Nanoscale 7:2154–98.
- Hnizdo E, Sluis-Cremer GK. 1993. Risk of silicosis in a cohort of white South African gold miners. Am J Ind Med 24:447–57.
- Hunter RJ. 2006. Electrokinetics of particles. In: Somasundaram P, ed. Encyclopedia of surface and colloid science. Boca Raton: CRC Press, 2220–32.
- Hurley BP, Pirzai W, Mumy KL, Gronert K, McCormick BA. 2011. Selective eicosanoid-generating capacity of cytoplasmic phospholipase A2 in Pseudomonas aeruginosa-infected epithelial cells. Am J Physiol Lung Cell Mol Physiol 300:L286–94.
- Jacobs R, van der Voet H, Ter Braak CJ. 2015. Integrated probabilistic risk assessment for nanoparticles: the case of nanosilica in food. J Nanopart Res 17:251.
- Johnston CJ, Driscoll KE, Finkelstein JN, Baggs R, O’Reilly MA, Carter J, et al. 2000. Pulmonary chemokine and mutagenic responses in rats after subchronic inhalation of amorphous and crystalline silica. Toxicol Sci 56:405–13.
- Kasper JY, Feiden L, Hermanns MI, Bantz C, Maskos M, Unger RE, et al. 2015. Pulmonary surfactant augments cytotoxicity of silica nanoparticles: Studies on an in vitro air-blood barrier model. Beilstein J Nanotechnol 6:517–28.
- Kim BY, Rutka JT, Chan WC. 2010. Nanomedicine. N Engl J Med 363:2434–43.
- Kuhn DA, Vanhecke D, Michen B, Blank F, Gehr P, Petri-Fink A, et al. 2014. Different endocytotic uptake mechanisms for nanoparticles in epithelial cells and macrophages. Beilstein J Nanotechnol 5:1625–36.
- Kumarathasan P, Breznan D, Das D, Salam MA, Siddiqui Y, MacKinnon-Roy C, et al. 2015. Cytotoxicity of carbon nanotube variants: a comparative in vitro exposure study with A549 epithelial and J774 macrophage cells. Nanotoxicology 9:148–61.
- Kwon JY, Koedrith P, Seo YR. 2014. Current investigations into the genotoxicity of zinc oxide and silica nanoparticles in mammalian models in vitro and in vivo: carcinogenic/genotoxic potential, relevant mechanisms and biomarkers, artifacts, and limitations. Int J Nanomedicine 9:271–86.
- Lanone S, Rogerieux F, Geys J, Dupont A, Maillot-Marechal E, Boczkowski J, et al. 2009. Comparative toxicity of 24 manufactured nanoparticles in human alveolar epithelial and macrophage cell lines. Part Fibre Toxicol 6:14. 30
- Lee KP, Kelly DP. 1992. The pulmonary response and clearance of Ludox colloidal silica after a 4-week inhalation exposure in rats. Fundam Appl Toxicol 19:399–410.
- Liu R, Liu HH, Ji Z, Chang CH, Xia T, Nel AE, et al. 2015. Evaluation of toxicity ranking for metal oxide nanoparticles via an in vitro dosimetry model. ACS Nano 9:9303–13.
- Lloyd CM, Gutierrez-Ramos JC. 2003. Regulation of cellular traffic in the asthmatic lung. In: Lambrecht BN, Hoogsteden HC, Diamant Z, eds. The immunological basis of asthma. Boca Raton: CRC Press, 409–38.
- McLane MP, Haczku A, van de Rijn M, Weiss C, Ferrante V, MacDonald D, et al. 1998. Interleukin-9 promotes allergen-induced eosinophilic inflammation and airway hyperresponsiveness in transgenic mice. Am J Respir Cell Mol Biol 19:713–20.
- Metcalf D. 1985. The granulocyte-macrophage colony-stimulating factors. Science 229:16–22.
- Michel K, Scheel J, Karsten S, Stelter N, Wind T. 2013. Risk assessment of amorphous silicon dioxide nanoparticles in a glass cleaner formulation. Nanotoxicology 7:974–88.
- Miyata R, van Eeden SF. 2011. The innate and adaptive immune response induced by alveolar macrophages exposed to ambient particulate matter. Toxicol Appl Pharmacol 257:209–26.
- Murashov V, Harper M, Demchuk E. 2006. Impact of silanol surface density on the toxicity of silica aerosols measured by erythrocyte haemolysis. J Occup Environ Hyg 3:718–23.
- Nadeau D, Vincent R, Kumarathasan P, Brook J, Dufresne A. 1996. Cytotoxicity of ambient air particles to rat lung macrophages: Comparison of cellular and functional assays. Toxicol in Vitro 10:161–72.
- Napierska D, Thomassen LC, Lison D, Martens JA, Hoet PH. 2010. The nanosilica hazard: another variable entity. Part Fibre Toxicol 7:39.
- Nieboer E, Richardson DHS. 1980. The replacement of the nondescript term ‘heavy metals’ by a biologically and chemically significant classification of metal ions. Environ Pollut Series B, Chem and Phys 1:3–26.
- Opal SM, DePalo VA. 2000. Anti-inflammatory cytokines. Chest 117:1162–72.
- Pal AK, Bello D, Cohen J, Demokritou P. 2015. Implications of in vitro dosimetry on toxicological ranking of low aspect ratio engineered nanomaterials. Nanotoxicology 9:871–85.
- Park JH, Gu L, von Maltzahn G, Ruoslahti E, Bhatia SN, Sailor MJ. 2009. Biodegradable luminescent porous silicon nanoparticles for in vivo applications. Nat Mater 8:331–6.
- Pavan C, Tomatis M, Ghiazza M, Rabolli V, Bolis V, Lison D, Fubini B. 2013. In search of the chemical basis of the hemolytic potential of silicas. Chem Res Toxicol 26:1188–98.
- Pavan C, Rabolli V, Tomatis M, Fubini B, Lison D. 2014. Why does the hemolytic activity of silica predict its pro-inflammatory activity?. Part Fibre Toxicol 11:76.
- Pétrilli V, Dostert C, Muruve DA, Tschopp J. 2007. The inflammasome: a danger sensing complex triggering innate immunity. Curr Opin Immunol 19:615–22.
- Pope CA 3rd, Burnett RT, Krewski D, Jerrett M, Shi Y, Calle EE, et al. 2009. Cardiovascular mortality and exposure to airborne fine particulate matter and cigarette smoke: shape of the exposure-response relationship. Circulation 120:941–8.
- Rabolli V, Thomassen LC, Princen C, Napierska D, Gonzalez L, Kirsch-Volders M, et al. 2010. Influence of size, surface area and microporosity on the in vitro cytotoxic activity of amorphous silica nanoparticles in different cell types. Nanotoxicology 4:307–18.
- Rabolli V, Thomassen LC, Uwambayinema F, Martens JA, Lison D. 2011. The cytotoxic activity of amorphous silica nanoparticles is mainly influenced by surface area and not by aggregation. Toxicol Lett 206:197–203.
- Rabolli V, Badissi AA, Devosse R, Uwambayinema F, Yakoub Y, Palmai-Pallag M, et al. 2014. The alarmin IL-1α is a master cytokine in acute lung inflammation induced by silica micro- and nanoparticles. Part Fibre Toxicol 11:69.
- Reich M, Liefeld T, Gould J, Lerner J, Tamayo P, Mesirov JP. 2006. GenePattern 2.0. Nat Genet 38:500–1.
- Riley MR, Boesewetter DE, Turner RA, Kim AM, Collier JM, Hamilton A. 2005. Comparison of the sensitivity of three lung derived cell lines to metals from combustion derived particulate matter. Toxicol in Vitro 19:411–19.
- Saldanha AJ. 2004. Java Treeview-extensible visualization of microarray data. Bioinformatics 20:3246–8.
- Schwende H, Fitzke E, Ambs P, Dieter P. 1996. Differences in the state of differentiation of THP-1 cells induced by phorbol ester and 1,25-dihydroxyvitamin D3. J Leukoc Biol 59:555–61.
- Shi J, Hedberg Y, Lundin M, Odnevall Wallinder I, Karlsson HL, Möller L. 2012. Hemolytic properties of synthetic nano- and porous silica particles: the effect of surface properties and the protection by the plasma corona. Acta Biomater 8:3478–90.
- Smith CA, Davis T, Anderson D, Solam L, Beckmann MP, Jerzy R, et al. 1990. A receptor for tumor necrosis factor defines an unusual family of cellular and viral proteins. Science 248:1019–23.
- Sun B, Pokhrel S, Dunphy DR, Zhang H, Ji Z, Wang X, et al. 2015. Reduction of acute inflammatory effects of fumed silica nanoparticles in the lung by adjusting silanol display through calcination and metal doping. ACS Nano 9:9357–72.
- Thibodeau M, Giardina C, Hubbard AK. 2003. Silica-induced caspase activation in mouse alveolar macrophages is dependent upon mitochondrial integrity and aspartic proteolysis. Toxicol Sci 76:91–101.
- Vincent R, Goegan P, Johnson G, Brook JR, Kumarathasan P, Bouthillier L, et al. 1997. Regulation of promoter-CAT stress genes in HepG2 cells by suspensions of particles from ambient air. Fundam Appl Toxicol 39:18–32.
- Waters KM, Masiello LM, Zangar RC, Tarasevich BJ, Karin NJ, Quesenberry RD, et al. 2009. Macrophage responses to silica nanoparticles are highly conserved across particle sizes. Toxicol Sci 107:553–69.
- Zhang H, Dunphy DR, Jiang X, Meng H, Sun B, Tarn D, et al. 2012. Processing pathway dependence of amorphous silica nanoparticle toxicity: colloidal vs pyrolytic. J Am Chem Soc 134:15790–804.