
Abstract
Background and purpose — The long-term effects of computer-assisted surgery in total knee replacement (CAS) compared to conventionally operated knee replacement (CON) are still not clear. We compared survivorship and relative risk of revision in CAS and CON based on data from the Norwegian Arthroplasty Register.
Patients and methods — We assessed primary total knee replacements without patellar resurfacing reported to the Norwegian Arthroplasty Register from 2005 through 2014. The 5 most used implants and the 3 most common navigation systems were included. The groups (CAS, n = 3,665; CON, n = 20,019) were compared using a Cox regression analysis adjusted for age, sex, ASA category, prosthesis brand, fixation method, previous surgery, and diagnosis with the risk of revision for any reason as endpoint. Secondary outcomes were reasons for revision and effects of prosthesis brand, fixation method, age (± 65 years), and hospital volume.
Results — Prosthesis survival and risk of revision were similar for CAS and CON. CAS had significantly fewer revisions due to malalignment. Otherwise, no statistically significant difference was found between the groups in analyses of secondary outcomes. Mean operating time was 13 minutes longer in CAS.
Interpretation — At 8 years of follow-up, CAS and CON had similar rates of overall revision, but CAS had fewer revisions due to malalignment. According to our findings, the benefits of CAS at medium-term follow-up are limited. Further research may identify subgroups that benefit from CAS, and it should also emphasize patient-reported outcomes.
In total knee replacement (TKR), alignment of the implant is considered important to achieve a satisfactory outcome (Jeffery et al. Citation1991, Ritter et al. Citation2011, Huang et al. Citation2012). Computer-assisted surgery (CAS) is widely used to improve implant positioning, and several randomized trials and meta-analyses have concluded that CAS provides more accurate alignment of the implant (Choong et al. Citation2009, Hetaimish et al. Citation2012, Cip et al. Citation2014, Rebal et al. Citation2014, Shi et al. Citation2014). CAS has been shown to have a short learning curve and is claimed to be useful in training of inexperienced surgeons (Jenny et al. Citation2008, Smith et al. Citation2010). Still, the long-term effects on survival and causes of revision for CAS as opposed to conventionally operated TKR (CON) are not clear (Burnett and Barrack Citation2013).
A randomized, controlled trial in Norway found improved alignment and marginally better functional outcome with CAS 1 year after surgery (Gothesen et al. Citation2014). Nevertheless, a 2-year follow-up from the Norwegian Arthroplasty Register (NAR) in 2011 showed a higher revision rate with use of computer navigation (Gothesen et al. Citation2011). Data from the New Zealand National Joint Registry with 5 years of follow-up showed similar revision rates and functional outcomes between navigated and non-navigated TKR (Roberts et al. Citation2015). On the other hand, a recent study from the Australian Orthopaedic Association National Joint Replacement Registry found a lower cumulative revision rate for computer navigation in patients less than 65 years (de Steiger et al. Citation2015).
The purpose of this study was to use the large cohort from the nationwide Norwegian Arthroplasty Register to investigate medium-term effects of computer navigation in primary total knee replacement by comparing CAS and CON, with risk of revision for any reason as endpoint. We also wanted to determine how CAS affected the rate and causes of revision in different prosthesis brands, fixation methods, and age groups, and to analyze the learning curve and the impact of hospital volume.
Patients and methods
Sources of data
This prospective observational study was based on data from the Norwegian Arthroplasty Register (NAR). The NAR was established in 1987 as a national hip registry (Havelin et al. Citation2000). From 1994, registration also included knee prostheses and other joint replacements (Furnes et al. Citation2002). The registry covers a population of approximately 5.2 million and the completeness of registration is 95% for primary TKR and 89% for revision TKR (Espehaug et al. Citation2006, Havelin et al. Citation2015). Registration of CAS started in 2005. In 2014, 8% of knee prostheses were implanted with CAS (Havelin et al. Citation2015).
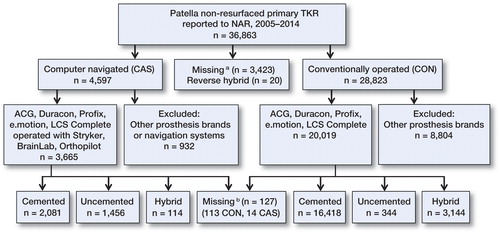
36,863 primary total knee replacements without patellar resurfacing were reported to the NAR from January 1, 2005 through December 31, 2014. As only 2.5% of the knees were patella resurfaced during this period, prostheses with a patellar component were excluded. Hinged (n = 48), bi-compartmental (n = 3), and reverse hybrid implants (cemented femur and uncemented tibia, n = 10) were also excluded due to low numbers. The cohort was divided into 2 groups according to the surgical technique used for the implantation: either the CAS technique or CON ().
Figure 1. Selection of patients. TKR: total knee replacement; NAR: Norwegian Arthroplasty Register; CAS: computer-navigated knee replacement; CON: conventionally operated knee replacement. a No information on use of computer navigation. b No information on fixation method.
In the short-term follow-up study from the NAR in 2011, the 5 most used prosthesis brands (AGC, Duracon, e.motion, LCS complete, and Profix) and the 3 most frequently used navigation systems (Brainlab, Orthopilot, and Stryker) were selected for analysis. We used the same selection criteria to compare the results with the study from 2011 (Gothesen et al. Citation2011).
Statistics
Baseline characteristics of the groups were investigated by descriptive analysis. Differences in demographic variables were calculated using chi-square test and Student’s t-test, assuming equal variances. Median follow-up was calculated using reverse Kaplan-Meier (Schemper and Smith Citation1996). Implant survival (time from operation to first revision) was estimated by Kaplan-Meier analysis after 5 and 8 years of follow-up, with censoring at the time of death, emigration, or at the end of inclusion (December 31, 2014). Information about deaths and emigrations until December 31, 2014 was obtained from the National Population Register. To ensure that deaths and emigrations did not affect the results, this was tested in a competing-risk model (Fine and Gray Citation1999).
The null hypothesis was that there would be no difference in survival or relative risk of revision in total knee arthroplasty performed with CAS and with CON. The relative risk (RR) was calculated using a Cox multiple regression model, to make a statistical comparison of the survival rates of the groups, adjusted for age (continuous), sex, prosthesis brand, ASA category (1/2/3+), fixation method (cemented/uncemented/hybrid (uncemented femur, cemented tibia)), diagnosis (osteoarthritis/other), and previous surgery of the knee (yes/no). The Cox regression analyses were also performed with adjustments for a propensity score with the same covariates as above in addition to side (left/right), peroperative complications (yes/no), and deficiency of anterior cruciate ligament preoperatively and posterior cruciate ligaments preoperatively and postoperatively (yes/no). The proportional hazards assumption of the Cox regression model was assessed by visual inspection (log-minus-log plot).
Main causes of revision were determined based on the hierarchy from the Australian Orthopaedic Association National Joint Replacement Registry (2015), modified according to causes of revision registered in the NAR (). The adjusted RR estimates for CAS relative to CON are reported with 95% confidence intervals (CIs) and p-values. Survival curves were constructed by Cox regression with CAS as stratification factor, with the same adjustments as described above.
Table 3. Reasons for revision in computer-navigated total knee replacement (CAS) and conventionally operated total knee replacement (CON) for all patients and for patients less than 65 years of age
In subanalyses, we investigated the effect of CAS on survival in different brands of prosthesis, in different fixation methods, and in patients younger or older than 65 years of age. To investigate possible effects of a learning curve, we split the data file in order to analyze the first 30 computer-navigated procedures (learning group) at each center and the remaining procedures (experienced group) separately, since the learning curve for computer navigation in TKR has been shown to stabilize after 30 procedures (Nizard et al. Citation2004, Jenny et al. Citation2008). Operation time is presented as median and interquartile range (IQR) and differences in operation time were calculated using Mann-Whitney tests.
All tests were 2-sided, and the significance level was set at 0.05. Statistical analyses were performed using IBM SPSS Statistics version 22.
Ethics
The NAR has permission from the Norwegian Data Inspectorate to collect patient data, based on obtaining written consent from the patient. (Permission was last issued September 15, 2014; reference number 03/00058-20/CGN).
Results
In the CAS group, the patients were 1 year younger on average, with males predominating, and they had a lower mean ASA score than the CON group (). Use of uncemented prostheses, previous surgery of the knee, and preoperative deficiency of the ACL was more frequent in the CAS group. Median follow-up was 5.3 years in the CAS group and 5.0 years in the CON group. 65 different hospitals were represented. All 22 hospitals that used CAS performed both techniques. For the implants included, the number of CAS operations during the study period varied between >200 TKRs in 3 hospitals and <30 TKRs in 5 hospitals. In the CON group, 33 hospitals had a volume of >200.
Table 1. Demographic data for computer-navigated total knee replacement (CAS) and conventionally operated total knee replacement (CON)
Overall survivorship ()
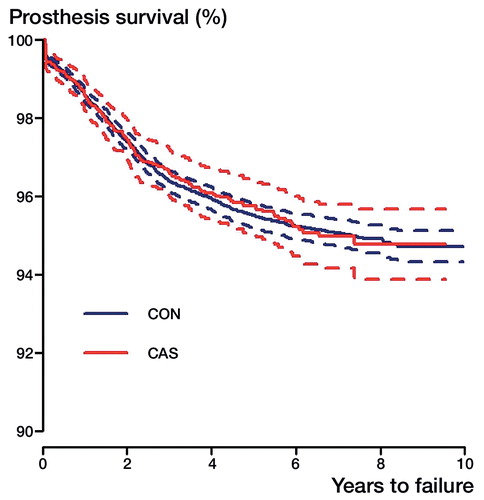
At 5-year follow-up, the survival rate in the CON group was 95.5% (CI: 95.1–95.9) and it was 95.7% (CI: 94.9–96.5) in the CAS group. At 8 years, the survival rate was 94.9% (CI: 94.5–95.3) in the CON group and 94.8% (CI: 93.8–95.8) in the CAS group (). The Cox regression analysis did not show any statistically significant difference in risk of revision between the CAS group and the CON group (RR =0.8, CI: 0.7–1.0; p = 0.1); nor did the propensity score-adjusted Cox regression analysis (RR =0.8, CI: 0.7–1.1; p = 0.1). The robustness of the analysis was investigated further with a simpler Cox regression model adjusted for age, sex, and diagnosis, and this RR estimate was 0.95 (CI: 0.80–1.13; p = 0.6). The Cox-adjusted RR was also tested for 0–2 years and 2–8 years after surgery, separately, but there was still no statistically significant difference in relative risk of revision between the groups. The proportion of deaths was 8.0% in the CAS group and 10% in the CON group, and the proportion of emigrations was 0.4% in both groups. In the competing-risk model, the overall relative risk of revision for CAS versus CON was 0.9 (CI: 0.8–1.2; p = 0.7) and for patients <65 years, the relative risk of revision was 0.9 (CI: 0.8–1.2, p = 0.8).
Figure 2. Kaplan-Meier survival curves with 95% confidence intervals (broken lines) for computer-navigated total knee replacement (CAS) and conventionally operated (CON) total knee replacement. Log-rank test: p = 0.9. 8 years at risk: CAS, n = 354; CON, n = 2,836.
Secondary outcomes
We also performed Cox regression analyses comparing CAS and CON for each selected prosthesis brand. In analyses adjusted for age, sex, ASA category, fixation method, and diagnosis, there was no statistically significant difference in risk of revision for Profix, LCS complete, AGC, or Duracon. For the e.motion prosthesis (352 CAS, 8 CON), there were 6 revisions in the CAS group and no revisions in the CON group, so an RR could not be estimated.
When selecting cemented prostheses only (2,080 CAS, 16,418 CON), there was still no significant difference in our Cox-adjusted estimates for risk of revision (RR =0.9, CI: 0.7–1.1; p = 0.4). For hybrid implants (114 CAS, 3,143 CON), the Cox-adjusted relative risk was 1.2 (CI: 0.4–3.9; p = 0.7). Only Profix and LCS complete were used as uncemented implants. Uncemented Profix implants (836 CAS, 27 CON) had 6 revisions reported, all in the CAS group. For the uncemented LCS compete (619 CAS, 316 CON), no significant difference was found (RR =0.8, CI: 0.5–1.3; p = 0.3).
We did not find any statistically significant difference in overall risk of revision between CAS and CON in patients who were older and younger than 65 years (). Patients <65 years of age had a lower risk of revision in the CAS group, with RR =0.8, but this was not statistically significant (CI: 0.6–1.1; p = 0.1). For patients ≥65 years of age, the relative risk was 0.9 (CI: 0.7–1.2; p = 0.6). Analyses of fixation method in patients <65 years of age did not indicate that CAS affected the revision risk differently for cemented, uncemented, or hybrid implants. The use of computer navigation did not affect the Kaplan-Meier survival rate after 5 or 8 years ().
Figure 3 Cox regression survival curves with 95% confidence intervals (broken lines) for computer-navigated total knee replacement (CAS) and conventionally operated total knee replacement (CON) in patients who were more than or less than 65 years of age, adjusted for sex, ASA category, diagnosis, previous surgery, prosthesis brand, and fixation method. 8 years at risk: ≥ 65 years old: CAS, n = 228; CON, n = 1,881; < 65 years old: CAS, n = 126; CON, n = 955.
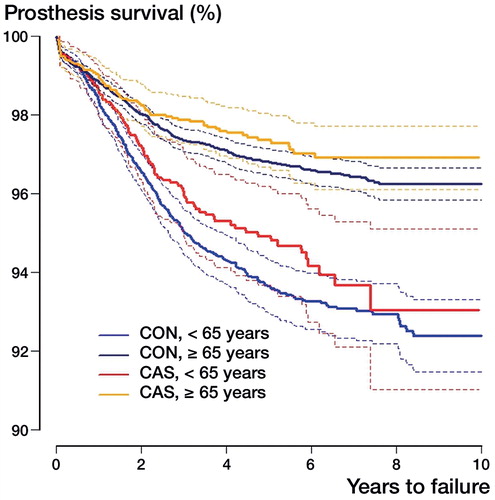
Table 2. Kaplan-Meier survival (KM) and Cox-adjusted relative risk of revision for computer-navigated total knee replacement (CAS) and for conventionally operated total knee replacement (CON)
3 hospitals were using both techniques (CAS and CON), and were regarded as high-volume centers with more than 300 computer-navigated TKRs. 1 hospital mainly used Profix (hospital A: 917 CAS, 137 CON), and the other 2 used LCS complete (hospital B: 342 CAS, 183 CON; hospital C: 578 CAS, 55 CON). We compared the 2 techniques in these hospitals separately. All 3 high-volume hospitals had small, statistically insignificant differences in the risk of revision when CAS and CON were compared.
Median operating time was 100 min (IQR: 35) in the CAS group and 89 min (IQR: 25) in the CON group (p < 0.001). When only cemented implants were selected, median operating time was 111 min (IQR: 31) for CAS and 90 min (IQR: 32) for CON (p < 0.001).
Learning curve
The learning group involved 533 computer-navigated (CAS) knee procedures in 22 different hospitals and the experienced group involved 3,140 CAS procedures in 15 different hospitals. Comparison of the learning group with the entire CON group did not reveal any difference in risk of revision (RR =1.1, CI: 0.7–1.5; p = 0.9). Median operating time for the learning CAS group was 31 min longer than for CON (p < 0.001). In the experienced CAS group, the risk of revision relative to CON was 0.8 (CI: 0.7–1.0; p = 0.09). Median operation time was 17 min longer with CAS (p < 0.001) for all fixation methods and 19 minutes longer with CAS for cemented implants (p < 0.001).
Causes of revision ()
Deep infection and aseptic loosening were the most common causes of revision, except in CAS patients aged <65 years, where revision due to instability was more frequent. When we adjusted for age, sex, ASA class, diagnosis, prosthesis brand, and fixation method, the CAS group had fewer revisions due to malalignment, with RR =0.5 (CI: 0.3–0.9; p = 0.02) in all patients and RR =0.3 (CI: 0.1–0.8; p = 0.01) in patients who were <65 years old. Otherwise, there were no statistically significant differences in risk of revision for the causes reported.
Discussion
We used data from the Norwegian Arthroplasty Register to compare survival, relative risk of revision, and causes of revision in total knee replacements performed with conventional methods or computer navigation. After 8 years of follow-up, we did not find any statistically significant differences in survival between groups. In subanalyses, we could not detect any difference in RR of revision for CAS and CON, either for different prosthesis brands or hospital volumes. Computer navigation did not affect the outcome differently with certain fixation methods or in patients less than 65 years. Risk of revision was not elevated in the first 30 computer-navigated cases at each center compared to the risk for the later procedures. CAS had statistically significantly fewer revisions due to malalignment.
Strengths and limitations
This registry-based study involved a large number of patients from all surgical units that perform total knee replacements in Norway (Espehaug et al. Citation2006, Havelin et al. Citation2015). Selection of the 5 most frequently used prosthesis brands and the 3 most frequently used navigation systems strengthened the applicability and external validity. The high completeness of reporting led to good external validity and 8 years of follow-up enabled us to discover possible complications of computer navigation, such as higher rates of infection and fracture, or advantages.
Despite the high quality of the NAR database and the registry study design, there were some limitations. Because of the low revision rate of knee prostheses, a large cohort and a long follow-up time were required to uncover benefits or small disadvantages in the study group. Serving a population of approximately 5.2 million citizens, the Norwegian registry has smaller numbers of operations than registries in larger countries, and is thus underpowered to detect small differences. This limitation was especially noticeable in some subanalyses with low numbers of revisions, and these results are less conclusive. Additionally, the different prosthesis brands and the use of computer navigation were unequally distributed among the hospitals. Consequently, the effect of single surgeons or differences in patient demographics between the hospitals may have affected the results, especially in the subanalyses where the number of patients was low. Complications that do not lead to revision of the prosthesis are not registered in the database. Thus, fractures or infections in pinholes after CAS are usually not registered. Common confounding factors were treated by adjustments in the statistical analyses, but we cannot account for unmeasured differences such as surgeon volume and postoperative treatment. In contrast to randomized trials, uncontrolled confounders might also have had a role. Adjustment for many different confounding factors increases the risk of overadjustment bias (Schisterman et al. Citation2009) and a Cox model only adjusted for age, sex, and diagnosis was performed to address this problem. However, inclusion of death in a competing risks model, and also the Cox model with fewer adjustments, did not alter the conclusions in our study.
Comparison with other studies
In a short-term follow-up from the NAR (Gothesen et al. Citation2011), the risk of revision was higher with CAS than with CON, and the LCS complete had inferior results than other prosthesis brands in the CAS group. At 8-year follow-up, we could no longer detect these differences. The short-term results might be caused by challenges during the introduction period of this new technology. Even so, we could not detect a learning curve, which supports previous findings that surgeons achieve satisfactory results with computer navigation shortly after introduction (Jenny et al. Citation2008, Chinnappa et al. Citation2015). There have been few studies comparing different implant designs in computer-aided navigation, but the LCS complete has also shown inferior results in registry-based studies both in Norway and in the USA (the Kaiser Permanente Total Joint Arthroplasty Registry) with conventional surgery (Paxton et al. Citation2011, Gothesen et al. Citation2013) and with mobile-bearing knee replacement in general (Namba et al. Citation2014). Baker et al. (Citation2012) found that implant brand and hospital type affected patient-reported outcome. Thus, it is likely that the inferior results with the LCS complete in the short term were mainly caused by the prosthesis design and challenges during introduction of new technology, rather than by the use of CAS.
In 2015, arthroplasty registries in New Zealand and Australia published studies on computer navigation in TKA, with 5 and 9 years of follow-up (respectively). The Australian registry reported a reduced revision rate for computer-navigated procedures in patients less than 65 years of age, and there was a reduction in revision rate due to loosening (de Steiger et al. Citation2015), but only with adjustment for age and sex. In a group of equivalent age, the arthroplasty registry in New Zealand found a trend of a higher revision rate for Triathlon implants inserted with computer-assisted navigation (not statistically significant) (Roberts et al. Citation2015). We found a statistically insignificantly lower revision rate and also lower risk of loosening in patients who were less than 65 years in the CAS group, supporting the Australian results. The smaller number of cases in our registry may explain why we were unable to detect a significant difference.
Improved alignment with CAS is expected to give better resistance to aseptic loosening and lower wear of the implant, as well as better functional results. We found a lower risk of revision due to malalignment, but this did not affect the overall survival or the risk of revision. There is evidence that malalignment is associated with implant failure (Jeffery et al. Citation1991, Huang et al. Citation2012) and a recent review article by Gromov et al. (Citation2014) recommended aiming for optimal alignment of the components in TKA. On the other hand, Parratte et al. (Citation2010) found no difference in survivorship for knees with mechanical axis within 3° of neutral compared to malaligned knees in a retrospective study with 15 years of follow-up. Bellemans et al. (Citation2012) emphasized the importance of recognizing patients with constitutional varus, and Vanlommel et al. (Citation2013) showed that these patients had superior clinical outcomes when the alignment was left in mild varus. In these cases, computer navigation could in theory cause a poorer outcome by correcting the patient’s natural alignment. As an alternative to mechanically aligned TKA, some surgeons prefer to have the prostheses kinematically aligned. A study by Howell et al. (Citation2013) showed similar Oxford knee scores in kinematically aligned knees regardless of alignment, and a randomized, controlled trial by Dossett et al. (Citation2014) found superior functional outcome and pain relief in kinematically aligned TKAs than in mechanically aligned TKAs. These different approaches might also play an important role in the success of TKA.
Analysis of registry data is limited to the information collected in the registry. The Norwegian Arthroplasty Register contains no information on radiological measurements or functional outcomes. In order to claim causality between alignment and survival, radiological measurements of the revised cases are required. Our results illustrate that computer-assisted navigation alone does not change large trends in survival of knee prostheses. The patient’s health status has been suggested to be more important than surgical factors (Baker et al. Citation2012), and alignment may be of less importance than previously assumed.
Future research
Registry studies with a longer follow-up time will provide useful information in future assessment of computer navigation in TKR. However, to investigate correlations between malalignment and functional results, long-term follow-up of randomized trials should also be conducted. Radiostereometric analysis can be helpful in detecting early loosening as a predictor of implant failure (Ryd et al. Citation1995). Collection of revised implants for laboratory studies and radiographs for alignment measurements from revisions might be useful in addition to collection of patient-reported outcome measures in arthroplasty registries. These modalities would enable researchers to assess revision rates in the context of patient satisfaction and function, with a view to improving the quality of life of the patients.
Summary
This study has shown similar 8-year survivorship in computer-navigated TKR and conventionally operated TKR, but CAS had fewer revisions for malalignment. We were unable to find specific benefits of CAS in particular age groups or regarding particular prosthesis brands.
The study was planned and designed by OG, GSD, and OF. GSD and AMF performed the statistical analyses. GSD drafted the manuscript. All the authors took part in interpretation of the study findings and revision and final approval of the manuscript before submission.
We thank all the orthopedic surgeons in Norway for reporting data to the NAR, and the patients who gave their consent to be included to the NAR database.
The Norwegian Arthroplasty Register is financed by the Western Norway Regional Health Authority (Helse-Vest). During the study period, GSD received a study grant from the Western Norway Regional Health Authority (Helse-Vest). No competing interests declared.
Australian Orthopaedic Association National Joint Replacement Registry. Annual Report. Australian Orthopaedic Association National Joint Replacement Registry. Annual Report. AOA: Adelaide; 2015; 230.
- Baker P N, Deehan D J, Lees D, Jameson S, Avery P J, Gregg P J, Reed M R. The effect of surgical factors on early patient-reported outcome measures (PROMS) following total knee replacement. J Bone Joint Surg (Br) 2012; 94 (8): 1058–66.
- Bellemans J, Colyn W, Vandenneucker H, Victor J. The Chitranjan Ranawat award: is neutral mechanical alignment normal for all patients? The concept of constitutional varus. Clin Orthop Relat Res 2012; 470 (1): 45–53.
- Burnett R S, Barrack R L. Computer-assisted total knee arthroplasty is currently of no proven clinical benefit: a systematic review. Clin Orthop Relat Res 2013; 471 (1): 264–76.
- Chinnappa J, Chen D B, Harris I A, MacDessi S J. Total knee arthroplasty using patient-specific guides: Is there a learning curve? Knee 2015; 22(6): 613–7.
- Choong P F, Dowsey M M, Stoney J D. Does accurate anatomical alignment result in better function and quality of life? Comparing conventional and computer-assisted total knee arthroplasty. J Arthroplasty 2009; 24 (4): 560–9.
- Cip J, Widemschek M, Luegmair M, Sheinkop M B, Benesch T, Martin A. Conventional versus computer-assisted technique for total knee arthroplasty: a minimum of 5-year follow-up of 200 patients in a prospective randomized comparative trial. J Arthroplasty 2014; 29 (9): 1795–802.
- de Steiger R N, Liu Y L, Graves S E. Computer navigation for total knee arthroplasty reduces revision rate for patients less than sixty-five years of age. J Bone Joint Surg (Am) 2015; 97 (8): 635–42.
- Dossett H G, Estrada N A, Swartz G J, LeFevre G W, Kwasman B G. A randomised controlled trial of kinematically and mechanically aligned total knee replacements: two-year clinical results. Bone Joint J 2014; 96-b (7): 907–13.
- Espehaug B, Furnes O, Havelin L I, Engesæter L B, Vollset S E, Kindseth O. Registration completeness in the Norwegian Arthroplasty Register. Acta Orthop 2006; 77 (1): 49–56.
- Fine J P, Gray R J. A Proportional hazards model for the subdistribution of a competing risk. Journal of the American Statistical Association 1999; 94 (446): 496–509.
- Furnes O, Espehaug B, Lie S A, Vollset S E, Engesaeter L B, Havelin L I. Early failures among 7,174 primary total knee replacements: a follow-up study from the Norwegian Arthroplasty Register 1994-2000. Acta Orthop Scand 2002; 73 (2): 117–29.
- Gothesen O, Espehaug B, Havelin L, Petursson G, Furnes O. Short-term outcome of 1,465 computer-navigated primary total knee replacements 2005-2008. Acta Orthop 2011; 82 (3): 293–300.
- Gothesen O, Espehaug B, Havelin L, Petursson G, Lygre S, Ellison P, Hallan G, Furnes O. Survival rates and causes of revision in cemented primary total knee replacement: a report from the Norwegian Arthroplasty Register 1994-2009. Bone Joint J 2013; 95-B (5): 636–42.
- Gothesen O, Espehaug B, Havelin L I, Petursson G, Hallan G, Strom E, Dyrhovden G, Furnes O. Functional outcome and alignment in computer-assisted and conventionally operated total knee replacements: a multicentre parallel-group randomised controlled trial. Bone Joint J 2014; 96-B (5): 609–18.
- Gromov K, Korchi M, Thomsen M G, Husted H, Troelsen A. What is the optimal alignment of the tibial and femoral components in knee arthroplasty? Acta Orthop 2014; 85 (5): 480–7.
- Havelin L I, Engesaeter L B, Espehaug B, Furnes O, Lie S A, Vollset S E. The Norwegian Arthroplasty Register: 11 years and 73,000 arthroplasties. Acta Orthop Scand 2000; 71 (4): 337–53.
- Havelin L I, Furnes O, Engesaeter L B, Fenstad A M, Bartz-Johannessen C, Fjeldsgaard K, Wiig O, Dybvik E. Norwegian Arthroplasty Register Annual Report. Norwegian Arthroplasty Register Annual Report. Norwegian Arthroplasty Register: Bergen; 2015.
- Hetaimish B M, Khan M M, Simunovic N, Al-Harbi H H, Bhandari M, Zalzal P K. Meta-analysis of navigation vs conventional total knee arthroplasty. J Arthroplasty 2012; 27 (6): 1177–82.
- Howell S M, Howell S J, Kuznik K T, Cohen J, Hull M L. Does a kinematically aligned total knee arthroplasty restore function without failure regardless of alignment category? Clin Orthop Relat Res 2013; 471 (3): 1000–7.
- Huang N F, Dowsey M M, Ee E, Stoney J D, Babazadeh S, Choong P F. Coronal alignment correlates with outcome after total knee arthroplasty: five-year follow-up of a randomized controlled trial. J Arthroplasty 2012; 27 (9): 1737–41.
- Jeffery R S, Morris R W, Denham R A. Coronal alignment after total knee replacement. J Bone Joint Surg (Br) 1991; 73 (5): 709–14.
- Jenny J Y, Miehlke R K, Giurea A. Learning curve in navigated total knee replacement. A multi-centre study comparing experienced and beginner centres. Knee 2008; 15 (2): 80–4.
- Namba R, Graves S, Robertsson O, Furnes O, Stea S, Puig-Verdie L, Hoeffel D, Cafri G, Paxton E, Sedrakyan A. International comparative evaluation of knee replacement with fixed or mobile non-posterior-stabilized implants. J Bone Joint Surg (Am) 2014; 96Suppl1: 52–8.
- Nizard R S, Porcher R, Ravaud P, Vangaver E, Hannouche D, Bizot P, Sedel L. Use of the Cusum technique for evaluation of a CT-based navigation system for total knee replacement. Clin Orthop Relat Res 2004; (425): 180–8.
- Parratte S, Pagnano M W, Trousdale R T, Berry D J. Effect of postoperative mechanical axis alignment on the fifteen-year survival of modern, cemented total knee replacements. J Bone Joint Surg (Am) 2010; 92 (12): 2143–9.
- Paxton E W, Furnes O, Namba R S, Inacio M C, Fenstad A M, Havelin L I. Comparison of the Norwegian knee arthroplasty register and a United States arthroplasty registry. J Bone Joint Surg (Am) 2011; 93Suppl3: 20–30.
- Rebal B A, Babatunde O M, Lee J H, Geller J A, Patrick D A, Jr., Macaulay W. Imageless computer navigation in total knee arthroplasty provides superior short term functional outcomes: a meta-analysis. J Arthroplasty 2014; 29 (5): 938–44.
- Ritter M A, Davis K E, Meding J B, Pierson J L, Berend M E, Malinzak R A. The effect of alignment and BMI on failure of total knee replacement. J Bone Joint Surg (Am) 2011; 93 (17): 1588–96.
- Roberts T D, Clatworthy M G, Frampton C M, Young S W. Does computer assisted navigation improve functional outcomes and implant survivability after total knee arthroplasty? J Arthroplasty 2015; 30 (9 Suppl): 59–63.
- Ryd L, Albrektsson B E, Carlsson L, Dansgard F, Herberts P, Lindstrand A, Regner L, Toksvig-Larsen S. Roentgen stereophotogrammetric analysis as a predictor of mechanical loosening of knee prostheses. J Bone Joint Surg (Br) 1995; 77 (3): 377–83.
- Schemper M, Smith T L. A note on quantifying follow-up in studies of failure time. Control Clin Trials 1996; 17 (4): 343–6.
- Schisterman E F, Cole S R, Platt R W. Overadjustment bias and unnecessary adjustment in epidemiologic studies. Epidemiology 2009; 20 (4): 488–95.
- Shi J, Wei Y, Wang S, Chen F, Wu J, Huang G, Chen J, Wei L, Xia J. Computer navigation and total knee arthroplasty. Orthopedics 2014; 37 (1): e39–43.
- Smith B R, Deakin A H, Baines J, Picard F. Computer navigated total knee arthroplasty: the learning curve. Comput Aided Surg 2010; 15 (1-3): 40–8.
- Vanlommel L, Vanlommel J, Claes S, Bellemans J. Slight undercorrection following total knee arthroplasty results in superior clinical outcomes in varus knees. Knee Surg Sports Traumatol Arthrosc 2013; 21 (10): 2325–30.