
ABSTRACT
Acute intake of the wheat bran extract Arabinoxylan-Oligosaccharide (AXOS) modulates the gut microbiota, improves stool characteristics and postprandial glycemia in healthy humans. Yet, little is known on how long-term AXOS intake influences gastrointestinal (GI) functioning, gut microbiota, and metabolic health. In this randomized, placebo-controlled, double-blind study, we evaluated the effects of AXOS intake on GI function and metabolic health in adults with slow GI transit without constipation. Forty-eight normoglycemic adults were included with whole-gut transit time (WGTT) of >35 h receiving either 15 g/day AXOS or placebo (maltodextrin) for 12-wks. The primary outcome was WGTT, and secondary outcomes included stool parameters, gut permeability, short-chain fatty acids (SCFA), microbiota composition, energy expenditure, substrate oxidation, glucose, insulin, lipids, gut hormones, and adipose tissue (AT) function. WGTT was unchanged, but stool consistency softened after AXOS. 12-wks of AXOS intake significantly changed the microbiota by increasing Bifidobacterium and decreasing microbial alpha-diversity. With a good classification accuracy, overall microbiota composition classified responders with decreased WGTT after AXOS. The incretin hormone Glucagon-like protein 1 was reduced after AXOS compared to placebo. Energy expenditure, plasma metabolites, AT parameters, SCFA, and gut permeability were unchanged. In conclusion, intake of wheat bran extract increases fecal Bifidobacterium and softens stool consistency without major effects on energy metabolism in healthy humans with a slow GI transit. We show that overall gut microbiota classified responders with decreased WGTT after AXOS highlighting that GI transit and change thereof were associated with gut microbiota independent of Bifidobacterium. NCT02491125
Introduction
Dietary fibers are well known for their beneficial health effects, but the exact underlying mechanisms are not fully understood. Specific dietary fibers termed prebiotics are fermented by the gut microbiota thereby altering the microbial composition and activity thus conferring a beneficial physiologic effect on the host.Citation1 Prebiotic intake can reduce postprandial glycemic and insulinemic excursions, increase satiety, improve the gut barrier function and decrease inflammatory markers.Citation2 Short-chain fatty acids (SCFA) produced upon microbial prebiotic fermentation are suggested to mediate metabolic effects by modulating gut peptide release (peptide YY (PYY) and glucagon-like peptide-1 (GLP-1)), gut permeability, skeletal muscle, liver, and adipose tissue (AT) function.Citation3,Citation4 Combined data in systematic reviews regarding prebiotic interventions to improve functional gastrointestinal disordersCitation5 or metabolic markers in type 2 diabetesCitation6 and obesityCitation7 are promising. Yet mostly due to study heterogeneity, regarding, for example, prebiotic fiber types, participant heterogeneity, duration of intervention as well as clinical endpoints, these reviews generally report a low to moderate level of evidence for the efficacy of prebiotics in the given disease context.
The gastrointestinal (GI) transit is an important for healthy gut functioning as well as in human energy metabolism. Upper intestinal transit is tightly involved in satiety signaling, the incretin response and postprandial glycemia, while lower intestinal transit determines nutrient availability, wash-out rate, and water availability, thereby shaping the ecologic niche of the gut microbiota.Citation8-Citation14 Conventionally, insoluble fibers are known to accelerate GI transit time possibly by increased stool bulk potentially caused by mechanical irritation and stimulation of mucus and water secretion in the large intestine.Citation15 However, prebiotic modulation of gut microbiota and microbial metabolite production (e.g. SCFA, H2) may also affect GI transit.Citation8 Some prebiotics (namely fructans and galacto-oligosaccharides) may increase stool frequency and soften stool consistency more effectively in constipated compared to non-constipated participants supporting evidence that dietary fiber intake more effectively accelerates gastrointestinal transit in humans with initially longer transit.Citation16-Citation18
Short-term human studies with the novel prebiotic arabinoxylan-oligosaccharides (AXOS) derived from wheat bran have been reported to increased Bifidobacterium abundance and improve postprandial glycemia.Citation19-Citation23 Further, AXOS intervention softened stool consistency and increased stool frequency in some,Citation23-Citation25 but not all short-term human interventions.Citation20,Citation22 Yet it is unknown how AXOS affects gastrointestinal transit and metabolic health in the long-term. We hypothesized that 12-week AXOS intake improves whole-gut transit time (WGTT, primary outcome) in healthy participants with a slow GI transit but without constipation. This selection was based on the assumption that participants who are non-constipated, yet not satisfied with their bowel habits (i.e. with slow GI transit) would be the likely population to use dietary fiber supplements such as AXOS to alleviate GI transit. Secondary outcomes were changes in gut microbiota composition, gastric emptying, oro-cecal transit, gut permeability, fecal and plasma SCFA, energy and substrate metabolism, glycemic and insulinemic responses, gut hormones, systemic and local inflammatory markers as well as AT functioning after 12-week of AXOS intake compared to placebo.
Participants and methods
Study participants
Forty-eight healthy Caucasian men and women aged 20–55 years, with a body mass index of 20–30 kg/m2 were recruited between August 2015 and December 2016 from the general population in the vicinity of Maastricht, the Netherlands. Initial recruitment was based on a defecation frequency of ≤4 per week. Participants with WGTT >35 h determined by radio-opaque marker method were included. Normoglycemia was determined by an oral glucose tolerance test according to the diagnostic criteria of the American Diabetes Association, 2010.Citation26 During a medical screening, eligibility was assessed including anthropometrics and medical history. Exclusion criteria were: Two or more symptoms of constipation according to ROME III criteriaCitation27 to rule out any confounding effects of underlying pathologies (e.g. defecation disorders, outlet obstruction), other unknown pathologies or inevitable medication use. Further exclusion criteria were the diagnosis of diabetes, prior abdominal surgery, cardiovascular or gastrointestinal diseases, life expectancy shorter than 5 years, the use of antibiotics, laxatives, prebiotics or probiotics 3 months prior to the study or during study participation. Participants did not use β-blockers, lipid- or glucose-lowering medication or corticosteroids.
Study design
This study was a double-blind, randomized placebo-controlled parallel trial approved by the Medical Ethical Committee of Maastricht University Medical Center+ (METC 15-3-005) and was conducted according to the ethical standards of the Helsinki Declaration and in accordance with the Medical Research Involving Human Subjects Act (WMO). All patients provided verbal and written informed consent. Using block randomization, an independent researcher randomly allocated participants to AXOS or placebo group with stratification for age and sex. After inclusion, two clinical investigation days (CID) before and directly after the 12-week intervention were performed to asses primary and secondary outcomes (Supplemental Figure 1). Participants were asked to ingest 5 g of AXOS powder (Cargill, Minnetonka, Minnesota, U.S.) or 5 g maltodextrin (C-PharmDry™, Cargill) three times per day with their regular meals for 12 weeks. AXOS preparations consisted of 71% of dry matter (DM) AXOS (degree of polymerization of the main AXOS fraction varies between 2 and 15 (average degree of polymerization: 3–8)), 10–14% DM β-glucan and 1–3% DM ferulic acid. AXOS and maltodextrin were provided as off-white powder, prepackaged in identical opaque sachets to be dissolved in tap water insuring the double-blind study design. Compliance was checked by the number of returned empty sachets. Participants were instructed to maintain habitual food intake and physical activity pattern throughout the study monitored by the short questionnaire to asses health-enhancing physical activityCitation28 and a weighed 3-day food record before and during the last week of the intervention (see supplementary methods). To asses gastrointestinal complaints, participants documented a 7-day gastrointestinal symptoms questionnaire including stool frequency and consistency using the Bristol stool scale (BSS)Citation29 the week before and during the last week of intervention. Quality of life was assessed via the 36‐Item short form healthy survey of quality of lifeCitation30 before and after the intervention (see supplementary methods). Two days prior to the CIDs, participants were asked to refrain from intense physical activity, alcohol and natural 13C-enriched products (e.g. pineapple, corn, and cane sugar).
Clinical investigation day 1
Whole-gut transit time
Prior to clinical investigation day (CID) 1, on 6 consecutive days participants ingested 10 radio-opaque (Colonic Transit, P. & A. Mauch, Münchenstein, Switzerland) markers in the morning. On CID1, participants came fasted to the university and a single abdominal X-ray was taken 24 h after the last marker ingestion. Based on the number of markers visible on the abdominal X-ray, WGTT was calculated according to Metcalf et al.Citation31
Gut permeability
Thereafter, participants ingested a multi-saccharide mix dissolved in 150 ml tap water containing 1 g sucrose (Van Gilse, Dinteloord, The Netherlands), 1 g lactulose (Centrafarm, Etten-Leur, The Netherlands), 1 g sucralose (Brenntag, Sittard, The Netherlands), 1 g erythritol (Nowfoods, Bloomingdale, U.S.), and 0.5 g of l-rhamnose (Danisco Sweeteners, Copenhagen, Denmark). Urine was collected in fractions to determine sucrose concentrations after 0–5 h for gastro-duodenal permeability, lactulose/rhamnose ratio after 0–5 h for small intestinal permeability, and the sucralose/erythritol ratio after 5–24 h for colonic permeability as described previously.Citation32 Isocratic ion-exchange HPLC (Model PU-1980 pump) with mass spectrometry (Model LTQ XL, Thermo Fisher Scientific, Landsmeer, The Netherlands) was used to determine urinary sugar concentrations.
Clinical investigation day 2
Adipose tissue biopsy
After an overnight fast, abdominal subcutaneous adipose tissue (AT) needle biopsies were collected under local anesthesia lateral from the umbilicus in a subgroup of participants (AXOS n = 15, placebo n = 15). Biopsy specimens were fixed overnight in 4% paraformaldehyde and embedded in paraffin. Histological sections were cut to 8 μm slices, mounted on microscope glass slides and dried overnight at 37C. After hematoxylin eosin staining, digital imaging was performed using Leica DFC320 digital camera (Leica, Rijswijk, Netherlands) at × 20 magnification (Leica DM3000 microscope; Leica). Computerized morphometric measurements of individual adipocytes were performed as previously described.Citation33 For AT mRNA expression, total RNA was extracted using TRIzol (Invitrogen, Breda, The Netherlands) for cDNA synthesis and real-time qPCR (iCycler, Bio-Rad, Veenendaal, NL, U.S.; primer sequences Supplemental Table 6). Results were normalized to 18S rRNA and expressed relative to baseline expression according to ∆∆Ct method.
Breakfast meal test and indirect calorimetry
After the AT biopsy, venous blood samples were taken at t = 0, 30, 60, 90, 120, 180, 240 and 300 min after ingestion of a solid test meal consisting of two slices of white bread, a fried egg and 250 ml of chocolate milk (27 E% fat, 52 E% carbohydrate, 19 E% protein, 412 kcal). During fasting and postprandial, visual analogue scales of feelings of hunger, satiety, fullness, and desire to eat were assessed. Substrate oxidation and energy expenditure was measured by determining CO2 production and O2 consumption via an open-circuit-ventilated hood system (Omnical, Maastricht University, The Netherlands) for 30 min during fasted conditions and in 15 min intervals during the 5 h postprandial state. Calculations of energy expenditure and the rate of fat and carbohydrate oxidation were calculated assuming 15% protein oxidation using the equations of WeirCitation34 and Frayn.Citation35
Upper gastrointestinal transit
Gastric emptying (GE) was measured using 13C-octanoic acid (100 mg, Campro Scientific bv, Veenendaal, The Netherlands) mixed into the standardized breakfast meal consumed at t = 0. Breath samples were collected at fasting and during the 5 h postprandial state, and analyzed using non-dispersive infrared spectrometry (IRIS, Wagner, Bremen, Germany).Citation36 Two fasting breath samples were obtained to measure baseline 13C-concentration to calculate delta over baseline and percentage of the dose 13C recovered (%/h) from the subsequent time points. Gastric emptying describing the time point at which 50% of the gastric content is excreted (T1/2), and the time point of maximal excretion rate (Tlag) were calculated according to Ghoos et al.Citation37 Oro-cecal transit time (OCTT) was determined using the inulin hydrogen (H2) breath test.Citation38 Participants ingested 5 g of Inulin (Cargill) dissolved in 150 ml tap water with the breakfast meal at t = 0. A hand-held device (Gastrolyzer, Bedfont Scientific, Kent, UK) was used to measure breath H2 (in ppm) as an indicator of at fasting and every 15 min during the 5 h postprandial state. OCTT was estimated from three consecutive measurements at least 10 ppm above baseline at fasting.
Biochemical blood analyses
Blood was collected in pre-chilled tubes and centrifuged at 3 000 x g at 4°C and plasma was snap-frozen in liquid nitrogen and stored at -80°C until analyses. EDTA tubes (Becton Dickinson, Eysins, Switzerland) were used for SCFA, insulin, glucose, free fatty acids (FFA), triacylglycerol (TAG), free glycerol, lipopolysaccharide-binding protein (LBP), Tumor necrosis factor (TNF) α, Interleukin (IL) 6, IL-1β and IL-8 analyses. For GLP-1 and PYY, 20 μL of dipeptidyl peptidase-IV inhibitor (Merck, Darmstadt, Germany) was added into an EDTA or Aprotinin tube (Becton Dickinson), respectively. Glucose, FFA, and TAG were determined with enzymatic assays (Cobas Fara auto-analyzer, Roche, Basel, Switzerland). Free glycerol was measured after precipitation using an enzymatic assay (Enzytee™ Glycerol, Roche) and analyzed with the Cobas Fara auto-analyzer. Insulin and PYY concentrations were determined using radio-immunoassay (RIA) kits (Human PYY (3–36) Specific RIA, Merck). Total GLP-1 was measured with RIA as previously described.Citation39 LBP was measured using a noncommercial enzyme-linked immunosorbent assay (ELISA) as previously described.Citation40 IL-1β, IL-6, IL-8, and TNF-α were determined with an ELISA kit (Human ProInflammatory IL 4-Plex Ultra-Sensitive Kit, Meso Scale Diagnostics, Rockville, U.S.). Plasma SCFA were determined using liquid chromatography-mass spectrometry.Citation41
Fecal sample collection and analyses
Feces wet weight was recorded by the participants for four consecutive days at home before CID1. From the first weighted stool, fractions of feces were collected in tubes for further analysis. Feces tubes were stored at -20°C in the participants’ freezers and transported using ice packs and immediately stored at -80°C on arrival at the University for CID 1. Fecal calprotectin was determined using an ELISA kit (BÜHLMANN fCAL®, Basel, Switzerland). Fecal SCFA, branched-chain fatty acids (BCFA), succinate and lactate were measured using ion exchange chromatography with conductivity detection and normalized to dry weight (Brightlabs, Venlo, The Netherlands). Stool moisture, i.e., water percentage of a stool sample (approx. 3 grams) was calculated based on the ratio of the weight loss of a fecal sample after 24 h of dry lyophilization to the weight of the fecal sample before.
Gut microbiota composition
Microbial DNA was extracted from fecal samples to perform 16S rRNA gene amplicon sequencing with Illumina Hiseq2500. DNA was isolated from 0.25 g feces with repeated bead beating followed by automated isolation and purification using a Maxwel 16 Tissue LEV Total RNA Purification Kit (Promega, Madison, U.S.). DNA was eluted in 50ul of nuclease-free water and quantified by Nanodrop (ThermoScientific). The V4 region of the 16S rRNA gene was amplified with the double barcoded primer pair 515F (5’-GTGCCAGCMGCCGCGGTAA) – 806R (5’-GGACTACHVGGGTWTCTAAT) as previously described.Citation42,Citation43 Each sample was amplified in triplicate using Phusion hot start II high fidelity polymerase (Thermo Scientific). Forty μl PCR reactions contained 28.4 μL nucleotide-free water (Promega, Madison, USA), 0.4 μL of 2 U/μl polymerase, 8 μL of 5× Phusion Green HF Buffer, 0.8 μl of 10 μM stock solutions of each of the barcoded forward (515F) and reverse (806R) primers, 0.8 μL 10mM dNTPs (Promega) and 0.8 μL template DNA. Cycling condition were as follows; Reactions were held at 98°C for 30 s and amplification proceeding for 25 cycles at 98°C for 10 s, 50°C for 10 s, 72°C for 10 s and a final extension of 7 min at 72°C. PCR products were checked for correct size on a 1% agarose gel and subsequently combined and purified with the CleanPCR kit (CleanNA, Alphen aan den Rijn, The Netherlands). Purified PCR products were quantified with Qubit using the dsDNA BR Assay Kit (Invitrogen, Caliornia, USA) and a composite sample for sequencing was created by combining equimolar amounts of amplicons (200 ng) from the individual samples. The resulting libraries were sent to GATC Biotech AG for 2X150nt sequencing on an Illumina Hiseq2000 instrument. Sequencing yielded 387 497 ± SD 164 372 reads per sample and sequence analysis was performed in NG-Tax using default settings.Citation42 Paired-end libraries were demultiplexed using read pairs with perfectly matching barcodes. Amplicon sequence variants (ASV) were picked as follows: sequences were ordered by abundance per sample and reads were considered valid when their cumulative abundance was ≤0.1%. Taxonomy was assigned using the SILVA reference database version128.Citation44 ASVs are defined as individual sequence variants rather than a cluster of sequence variants with a shared similarity above a specified threshold.
Statistics
To measure clinically relevant differences in WGTT of 30%, a power of 80% (β) and assuming an alpha of 0.05 (α), 22 participants per group were required. Estimating a 20% dropout rate, total recruitment included n = 48 participants. Data were tested for normality using a Shapiro Wilk test and were log-transformed in case of a non-parametric distribution and in case of ordinal data, a Wilcoxon signed rank tests was performed. Baseline differences were analyzed using unpaired Student’s t-tests. Primary and secondary outcomes were compared using a 2-factor repeated measures analysis of variance with time (pre, post) and intervention (AXOS, placebo). In case of a significant time*intervention effect, a post hoc analysis was conducted with Bonferroni correction within both groups. P-values <0.05 were considered significant. Statistical analyses were performed using SPSS 22.0 (IBM, Armok, U.S.). For the gut microbiota, analyses were performed in R version 3.4 (R Core Team, 2017). Distance-based redundancy analysis with weighted Unifrac was performed to calculate the multivariate intervention effect.Citation45,Citation46 Principal response curve (PRC) analysis was used to summarize differences in the microbiota composition between interventions over time.Citation47 Alpha diversity metrics were calculated using vegan package.Citation48 To classify responder status based on gut microbiota, we used random forests (RF) based on ASVs. Three outliers outside an overall 95% confidence interval on a weighted Unifrac based PCoA analysis were discarded. We evaluated the model using cross-validation as implemented in caret.Citation49 We randomly selected 75% of the samples to serve as the training set and consequently evaluated classification accuracy using the hold out set with 500 repetitions. The AUC was calculated with the cross-validation error using the pROC package with 10 000 bootstraps for confidence intervals.Citation50
Results
Participant characteristics
Forty-eight participants were included and completed the study (, Supplemental Figure 2). No serious adverse events or gastrointestinal complaints (Supplemental Table 1) were reported, and compliance was checked by returned emptied sachets (236 ± 12 of 252 empty sachets were returned [93.7%]). There were no differences in BMI, body composition, dietary intake, physical activity and quality of life between groups before or after the intervention (Supplemental Table 2–4).
Table 1. Baseline characteristics of the study participants.
Softer stool consistency but no changes in whole gut transit after AXOS
No significant changes in WGTT, gastric emptying or OCTT were observed after AXOS intervention compared to placebo (). Independent of intervention or time, gastric emptying of the solid meal was uniformly overestimated, a known limitation of indirect breath test fitting.Citation51 Yet, the unfitted percentage of 13C recovery was unchanged after AXOS intervention compared to placebo (Supplemental Figure 3). Stool frequency, stool weight, stool moisture, and fasting H2 remained unchanged, however, BSS scores increased from harder stool type 1–2 toward softer stool types 3–4 after AXOS intervention (, Supplemental Figure 4). WGTT and BSS were not correlated, neither at baseline nor when comparing changes after the intervention (Supplemental Figure 5). There were no changes in BSS scores after placebo, yet we observed that there was a non-significant increase of stool type 6 scoring (watery stool) after placebo intake. In general, we observed very irregular patters of BSC types within 1 week, for example, having stool forms of type 2 and type 6 within 1 week. Thus, in the placebo group, this irregular pattern was maintained or even exacerbated, while we observed a tendency toward “normal” stool types (i.e., 3 and 4) after the AXOS intervention. Participants did not report the use of laxatives during the study as monitored via GI questionnaires.
Table 2. Gastrointestinal transit and stool parameters before and after AXOS and Placebo intervention.
AXOS intervention modulates gut microbiota
AXOS intervention significantly reduced alpha diversity (P< .001) and changed the microbiota composition (P= .05) compared to placebo ((a)) after adjustment for age and sex. Furthermore, 15.1% of the variation in microbiota composition was explained by time (P < 1*10−5), and 4.4% (P= .05) by the time*intervention effect. Gut microbiota changes after AXOS intervention were mainly related to increased Bifidobacterium ASVs and, to a lesser extent, increased Akkermansia, Prevotellaceae NK3831 group, Lactobacillus and decrease of Blautia, Eubacterium Hallii group, Coriabacteriaceau UCG-003, and Dorea ASVs ((b)). Nonetheless, the overall microbial responses to AXOS showed distinct individual patterns as exemplified by the Blautia and Dorea ASVs ((c)).
Figure 1. AXOS induces changes in gut microbiota. (a) Inverse Simpson index for alpha-diversity is reduced after AXOS intake. (b) Principal Response Curve summarizing the multivariate response of AXOS intervention versus Placebo over time (P = .05). ASVs with large deviations between AXOS and Placebo have high weights while taxa equally present in AXOS and Placebo have zero weight. ASVs with the highest weight plotted vertically on the right axis are the main drivers of the differences between interventions. ASVs that have a negative weight on the response curve follow the observed AXOS curve, whereas those with positive weights follow the opposite pattern. (c) Individual intervention responses of important ASVs. Individual changes depict the AXOS group (n = 21) and placebo (n = 17) before and after the intervention. ASV Amplicon sequence variant, AXOS Arabinoxylan-Oligosaccharides.
Fecal and plasma SCFA
Fecal SCFA, BCFA, succinate or lactate were unchanged after AXOS intervention compared to placebo ((a–c), Supplemental Figure 6). Plasma acetate and butyrate decreased over time both after AXOS and placebo intervention with no differences between groups ((d–f)).
Figure 2. Short-chain fatty acid concentrations and gut permeability before and after AXOS (n = 24) and placebo intervention (n = 24). Data are given as means ± SEM. Data were analyzed using 2-way repeated measure ANOVA with time (pre/post) and intervention as covariates. There are no differences between fecal (a) acetate (b) propionate, (c) butyrate or fasting and postprandial plasma (d) acetate, (e) propionate, (f) butyrate between groups as a result of intervention (time*intervention, ns). Urinary sugar excretions and ratios were compared with Wilcoxon signed-rank test pre vs. post within groups. There were no differences in urinary excretion rates of (g) 0–5 h sucrose (gastro-duodenal permeability) (h) 0–5 h Lactulose:Rhamnose ratio (small intestinal permeability) (i) 5–24 h Sucralose:Erytrithol ratio (colonic permeability). AXOS Arabinoxylan-Oligosaccharides, PLA placebo.
Gut permeability and inflammation
Gut permeability, plasma LBP, fecal calprotectin, plasma IL-6, IL-8, TNF-α, and IL-1β were unchanged after AXOS intervention compared to placebo ((g–i), Supplemental Table 5).
Energy metabolism, plasma metabolites and adipose tissue function
Postprandial fat oxidation tended to increase after AXOS intervention (iAUC0-5h, ANOVA P = .008, post-hoc AXOS P = .073, placebo P = .089, (a,b)). AXOS intervention did not affect energy expenditure, respiratory quotient and carbohydrate oxidation ((c–f)), yet AXOS intervention decreased early postprandial GLP-1 AUC 0–90min/min concentrations after a standardized breakfast meal as compared to placebo (ANOVA P = .043, post-hoc AXOS P= .033, placebo P = .972. (g,h)) while PYY was unchanged after intervention ((i)). Glucose, insulin, FFA, TAG, glycerol and appetite, hunger, satiety, and fullness ratings were not affected by AXOS intervention compared to placebo (, Supplemental Figure 7). AXOS intervention had no effect on adipocyte size and AT mRNA expression of lipolytic enzymes (adipose tissue triglyceride lipase (ATGL), hormone-sensitive lipase (HSL), comparative gene identification 58 (CGI-58), lipid-droplet-associated protein (PLIN-1, Supplemental Figure 8)).
Table 3. Circulating metabolites and insulin before and after AXOS and Placebo intervention.
Figure 3. Energy expenditure, substrate metabolism, GLP-1 and PYY before and after AXOS (n = 24) and Placebo (n = 24) intervention. Data are mean ± SEM and analyzed using 2-way repeated measure ANOVA with time (pre/post) and intervention as covariates. (a,b) Postprandial fat oxidation iAUC0-5h tended to increase after AXOS intervention (time*intervention P< .01, post-hoc AXOS P = .073, placebo P = .089). (c) Energy expenditure, (d) CHO oxidation, (e) CHO oxidation iAUC and (f) RQ were unchanged between groups after intervention. (g,h) Postprandial GLP-1 AUC0-90min decreased after AXOS intervention compared to placebo (time*intervention P = .043, post hoc AXOS P= .33, placebo P= .972). (i) PPY was not affected by the intervention. AXOS Arabinoxylan-Oligosaccharides, CHO carbohydrate, GLP-1 glucagon-like peptide-1, PYY peptide YY, iAUC incremental area under the curve, EE energy expenditure, RQ respiratory quotient, * P < .05.
Microbiota composition relates to decreased WGTT after AXOS
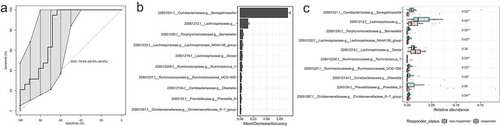
To identify responders and non-responders, we defined responders as a ≥ 10% decrease in WGTT and non-responders as unchanged/increase in WGTT after AXOS intervention. We used Random Forests analysis to determine gut microbiota patterns characteristic for responders or non-responders after AXOS intervention. With a good classification accuracy (Area Under the Receiver Operating Characteristics curve, AUROC of 0.80, ), we observed that overall microbiota composition classified decreased WGTT (responders) compared to unchanged/increased WGTT (non-responders) after AXOS intervention. ASVs important for this classification were mainly ASV 22851231 from the genus Senegalimassilia, family Coriobacteriaceae and an unclassified ASV 22851212 from the family Lachnospiraceae (), which showed higher abundances in responders compared to non-responders ((c)).
Figure 4. Identification of microbial ASVs as markers for responders with decreased WGTT after AXOS intervention by random forests models with 500-fold cross-validation. (a) The cross-validation error-based AUC was 79.9% with 10 000 bootstraps for a 95% confidence interval (65.8–94.0%). (b) The top 10 microbial ASVs that were important for the classification of responders with decreased WGTT. On the x-axis, MeanDecreaseAccuracy displays the decrease of model accuracy if the predictor ASV would be removed. (c)The abundance of the top 10 microbial groups in responders and non-responders after AXOS intervention. FDR adjusted P-values are given of a Wilcoxon signed-rank test between responders and non-responders. WGTT whole-gut transit time. AUC, area under the curve, AXOS, Arabinoxylan-Oligosaccharides, FDR false discovery rate.
Discussion
This is the first study investigating the effects of 12-week AXOS intake on combined measures of gastrointestinal functioning and metabolic health in healthy participants with a slow GI transit. AXOS intervention did not affect whole-gut transit (WGTT) but significantly increased fecal Bifidobacterium, decreased microbial diversity and softened stool consistency compared to placebo. Further, responder analysis showed that overall microbiota composition accurately classified responders with decreased WGTT as well as non-responders with unchanged/increased WGTT after AXOS intervention. Postprandial fat oxidation tended to increase and early postprandial GLP-1 significantly decreased after AXOS while upper intestinal transit, stool frequency, SCFA, gut permeability, inflammatory markers as well as glucose, insulin and lipid metabolism and adipose tissue functioning were not affected by AXOS.
Bifidobacterium spp. has been shown to accelerate gastrointestinal transit in healthy humans when administered as probiotics.Citation52,Citation53 In this study, the AXOS-mediated bifidogenic effect did not translate into changes in quantitative measures of gastrointestinal transit but was accompanied by softer stool consistency consistent with previous studies.Citation23-Citation25 WGTT and BSS were not correlated in this study which may explain the different outcomes between the rather subjective BSS and the quantitative radio-opaque marker method. After the AXOS intervention, we observed an average BSS change of 0.5, which may be debatable with regards to its clinical relevance. According to FDA guidelines, change in a BSS of more than 1 is considered clinically relevant in inflammatory bowel disease diarrhea and constipation subtypes.Citation54 However, to date, there is no specific suggestion for clinically relevant changes in BSS in the healthy population. Thus, an increase of 0.5 in the Bristol stool score may be regarded as normalization of the stool consistency while the clinical relevance in a healthy population needs yet to be validated.
Despite being of lower avDP than other Arabinoxylans or other well-known prebiotics, AXOS with avDP <10 have been shown to induce a bifidogenic effect in animals and humans.Citation20,Citation22,Citation55,Citation56 This indicates that AXOS indeed reaches the colon inducing changes in the gut microbiota composition, which most likely occurs mainly in the proximal colon. Possible AXOS-mediated mechanisms contributing to softer stools may be an increased fecal bacterial biomass, increased water binding capacity or stimulation of host mucus production.Citation57 Further, AXOS intake decreased microbial alpha diversity, while high microbial diversity is commonly regarded as a biomarker for a stable, healthy gut ecosystem. However, hard stool has been associated with increased alpha diversity reflecting a diversification as an adaption to a changing ecosystem during long colonic passage (i.e., depletion of nutrients, switch from microbial saccharolytic to proteolytic fermentation, microbial competition, decreased water availability).Citation10 Thus, microbial diversity should be interpreted within the physiological context: in participants with slow GI transit, softer stool after AXOS intervention may have contributed to the observed reduced alpha diversity which may reflect the AXOS induced shifts in the microbial and colonic ecosystem. Further, reduced alpha diversity may have been a result of the selective stimulation of Bifidobacterium growth, and not necessarily represent a reduced microbiota stability. Despite observing no changes in WGTT after AXOS intake compared to placebo, the within-participants variability was remarkable in response to the AXOS intervention. Thus, we further explored the association between responders with a decreased WGTT and non-responders with an unchanged/increased WGTT after AXOS intervention and the gut microbiota composition. We observed that the overall gut microbiota composition could accurately classify responder status indicating that the relationship between gut microbiota and GI transit is potentially bidirectional. Responsible for this classification were mainly Senegalimassilia ASV (family Coriobacteriaceae, phylum Actinobacteria), and an unclassified ASV from the family Lachnospiraceae (phylum Firmicutes) which were significantly more abundant in the responders compared to non-responders. Unfortunately, not much is known about Senegalimassilia and the ASV from the family of Lachnospiraceae, which is among the most abundant in the human gut, making it difficult to speculate on their mode of action. Other predictors were common members of the gut microbiota from different families and phyla. Hence, changes in GI transit may be mediated by a microbial network comprising species of these families rather than the selective stimulation of Bifidobacterium.
Colonic SCFA may affect gastrointestinal motility via stimulation of enterochromaffin cells amongst other mechanisms.Citation58 Despite the increase of acetate-producing Bifidobacterium, plasma and fecal SCFA concentrations were not affected by AXOS intervention. Of note, we observed a time-dependent decrease in plasma acetate and butyrate in both groups reflecting a high temporal variability in SCFA metabolism. Circulating acetate and butyrate have several sources: 1) direct exogenous ingestion via food sources, 2) indirect exogenous production by colonic bacterial fermentation of non-digested food components, and 3) endogenous production from protein, lipid, and carbohydrate catabolism in mainly the liver.Citation4 Plasma SCFA concentrations are thus the net result of SCFA production, absorption and splanchnic extraction/hepatic metabolism, and are therefore difficult to interpret. Since rate of appearance from endogenous or exogenous sources can only be acquired by using stable isotope tracer techniques, we cannot provide this information for the present study.
Early postprandial GLP-1 was reduced after AXOS intervention, whilst PYY, insulin, glucose concentrations as well as ratings of hunger and satiety were unchanged. Acute AXOS studies reported inconsistent effects on GLP-1,Citation19,Citation59 however, arabinose derived from arabinoxylan fermentation has been proposed to be rapidly fermented in the small intestine as observed by an early postprandial increase of plasma arabinose and xylan after ingestion of wheat-bran rich pasta accompanied by a reduced rate of endogenous glucose appearance rate compared to control wheat bread.Citation60 The authors of the latter study propose that the increased availability of arabinoxylans may have increased luminal viscosity and thereby may interfere with small intestinal glucose breakdown and absorption. Further, arabinose itself has been shown to partly inhibit sucrase and maltase activity in in vitro and in rodent models,Citation61-Citation63 which potentially may attenuate breakdown of glucose and thus early glucose-dependent GLP-1 stimulation as observed in our study. While AXOS intervention tended to increase postprandial fat oxidation, there was no effect of AXOS on other metabolic outcomes including energy expenditure, glucose, and insulin, or lipids or adipocyte functioning nor on gut permeability, plasma LBP, fecal calprotectin or other systemic inflammatory markers.
A strength of this study was the thorough phenotypical characterization of participants regarding the subjective and quantitative assessment of gastrointestinal parameters and metabolic profile, as well as the controlled randomized design. A limitation of this study is that the inclusion of healthy participants may have left less room for improvement in metabolic health parameters compared to metabolically compromised individuals with obesity or type 2 diabetes. To summarize, 12-week of AXOS intervention strongly increases Bifidobacterium, reduces microbiota diversity and softens stool consistency without changes in WGTT and metabolic health. Overall microbiota accurately classifies responders with decreased WGTT indicating that changes in transit were associated with gut microbiota composition independent of Bifidobacterium. Hereby, we substantiate the current notion that there is a complex bidirectional interaction between the gut microbiota and GI transit and that prebiotic stimulation of Bifidobacterium was not effective in improving GI transit in this study population. Further studies are warranted to disentangle the connections between the gut microbiota and GI functioning and whether these play a role in metabolic health.
Abbreviations
| ASV | = | amplicon sequence variant |
| AT | = | adipose tissue |
| AUC | = | area under the curve |
| AXOS | = | arabinoxylan-Oligosaccharides |
| CID | = | clinical investigation day |
| FFA | = | free fatty acids |
| GE | = | gastric emptying |
| GLP-1 | = | glucagon-like peptide-1 |
| OCTT | = | oro-cecal transit time |
| PYY | = | peptide YY |
| GPR | = | g-protein coupled receptor |
| LBP | = | lipopolysaccharide-binding protein |
| OGTT | = | oral glucose tolerance test |
| SCFA | = | short-chain fatty acid |
| T2DM | = | type 2 diabetes mellitus |
| TAG | = | triacylglycerol |
| TNF-α | = | tumor necrosis factor-α |
| IL | = | interleukin |
| WGTT | = | whole-gut transit time |
Disclosure of potential conflict of interest
No potential conflicts of interest were disclosed.
Data sharing
Sequence data have been deposited in the European Nucleotide Archive, accession number [ENA: PRJEB32919].
Supplemental Material
Download MS Word (1,012.2 KB)Acknowledgments
We would kindly like to thank the study participants, Laura Arkenbosch, Gabby Hul, Wendy Sluijsman, Yvonne Essers, Nicole Hoebers and Jos Stegen for their excellent technical support.
Supplementary material
Supplemental data for this article can be accessed on the publisher’s website.
Additional information
Funding
References
- Gibson GR, Hutkins R, Sanders ME, Prescott SL, Reimer RA, Salminen SJ, Scott K, Stanton C, Swanson KS, Cani PD, et al. Expert consensus document: the International Scientific Association for Probiotics and Prebiotics (ISAPP) consensus statement on the definition and scope of prebiotics. Nat Rev Gastroenterol Hepatol. 2017;14:491–15. doi:10.1038/nrgastro.2017.75.
- Kellow NJ, Coughlan MT, Reid CM. Metabolic benefits of dietary prebiotics in human subjects: a systematic review of randomised controlled trials. Br J Nutr. 2014;111:1147–1161. doi:10.1017/S0007114513003607.
- Carlson JL, Erickson JM, Lloyd BB, Slavin JL. Health effects and sources of prebiotic dietary fiber. Curr Dev Nutr. 2018;2:nzy005. doi:10.1093/cdn/nzy005.
- Canfora EE, Jocken JW, Blaak EE. Short-chain fatty acids in control of body weight and insulin sensitivity. Nat Rev Endocrinol. 2015;11:577–591. doi:10.1038/nrendo.2015.128.
- Wilson B, Rossi M, Dimidi E, Whelan K. Prebiotics in irritable bowel syndrome and other functional bowel disorders in adults: a systematic review and meta-analysis of randomized controlled trials. Am J Clin Nutr. 2019;109:1098–1111. doi:10.1093/ajcn/nqy376.
- Colantonio AG, Werner SL, Brown M. The effects of prebiotics and substances with prebiotic properties on metabolic and inflammatory biomarkers in individuals with type 2 diabetes mellitus: a systematic review. J Acad Nutr Diet. 2019. doi:10.1016/j.jand.2018.12.013.
- Fernandes R, Do Rosario VA, Mocellin MC, Kuntz MGF, Trindade E. Effects of inulin-type fructans, galacto-oligosaccharides and related synbiotics on inflammatory markers in adult patients with overweight or obesity: a systematic review. Clin Nutr. 2017;36:1197–1206. doi:10.1016/j.clnu.2016.10.003.
- Müller M, Canfora EE, Blaak EE. Gastrointestinal transit time, glucose homeostasis and metabolic health: modulation by dietary fibers. Nutrients. 2018;10(3):275. doi:10.3390/nu10030275
- Cremer J, Arnoldini M, Hwa T. Effect of water flow and chemical environment on microbiota growth and composition in the human colon. Proc Natl Acad Sci USA. 2017;114:6438–6443. doi:10.1073/pnas.1619598114.
- Falony G, Vieira-Silva S, Raes J. Richness and ecosystem development across faecal snapshots of the gut microbiota. Nat Microbiol. 2018;3:526–528. doi:10.1038/s41564-018-0143-5.
- Fandriks L. Roles of the gut in the metabolic syndrome: an overview. J Intern Med. 2017;281:319–336. doi:10.1111/joim.2017.281.issue-4.
- Holst JJ, Gribble F, Horowitz M, Rayner CK. Roles of the gut in glucose homeostasis. Diabetes Care. 2016;39:884–892. doi:10.2337/dc16-0351.
- Steinert RE, Feinle-Bisset C, Asarian L, Horowitz M, Beglinger C, Geary N. Ghrelin, CCK, GLP-1, and PYY(3-36): secretory controls and physiological roles in eating and glycemia in health, obesity, and after RYGB. Physiol Rev. 2017;97:411–463. doi:10.1152/physrev.00031.2014.
- Roager HM, Hansen LB, Bahl MI, Frandsen HL, Carvalho V, Gobel RJ, Dalgaard MD, Plichta DR, Sparholt MH, Vestergaard H, et al. Colonic transit time is related to bacterial metabolism and mucosal turnover in the gut. Nat Microbiol. 2016;1:16093. doi:10.1038/nmicrobiol.2016.93.
- McRorie JW Jr., McKeown NM. Understanding the physics of functional fibers in the gastrointestinal tract: an evidence-based approach to resolving enduring misconceptions about insoluble and soluble fiber. J Acad Nutr Dietetics. 2017;117:251–264. doi:10.1016/j.jand.2016.09.021.
- de Vries J, Miller PE, Verbeke K. Effects of cereal fiber on bowel function: a systematic review of intervention trials. World J Gastroenterol. 2015;21:8952–8963. doi:10.3748/wjg.v21.i29.8952.
- Collado Yurrita L, San Mauro Martin I, Ciudad-Cabanas MJ, Calle-Puron ME, Hernandez Cabria M. Effectiveness of inulin intake on indicators of chronic constipation; a meta-analysis of controlled randomized clinical trials. Nutricion Hospitalaria. 2014;30:244–252. doi:10.3305/nh.2014.30.2.7565.
- Christodoulides S, Dimidi E, Fragkos KC, Farmer AD, Whelan K, Scott SM. Systematic review with meta-analysis: effect of fibre supplementation on chronic idiopathic constipation in adults. Aliment Pharm Ther. 2016;44:103–116. doi:10.1111/apt.2016.44.issue-2.
- Boll EV, Ekstrom LM, Courtin CM, Delcour JA, Nilsson AC, Bjorck IM, Östman EM. Effects of wheat bran extract rich in arabinoxylan oligosaccharides and resistant starch on overnight glucose tolerance and markers of gut fermentation in healthy young adults. Eur J Nutr. 2016;55:1661–1670. doi:10.1007/s00394-015-0985-z.
- Cloetens L, Broekaert WF, Delaedt Y, Ollevier F, Courtin CM, Delcour JA, Rutgeerts P, Verbeke K. Tolerance of arabinoxylan-oligosaccharides and their prebiotic activity in healthy subjects: a randomised, placebo-controlled cross-over study. Br J Nutr. 2010;103:703–713. doi:10.1017/S0007114509992248.
- Maki KC, Gibson GR, Dickmann RS, Kendall CW, Chen CY, Costabile A, Comelli EM, McKay DL, Almeida NG, Jenkins D, et al. Digestive and physiologic effects of a wheat bran extract, arabino-xylan-oligosaccharide, in breakfast cereal. Nutrition. 2012;28:1115–1121. doi:10.1016/j.nut.2012.02.010.
- Francois IE, Lescroart O, Veraverbeke WS, Marzorati M, Possemiers S, Hamer H, Windey K, Welling GW, Delcour JA, Courtin CM, et al. Effects of wheat bran extract containing arabinoxylan oligosaccharides on gastrointestinal parameters in healthy preadolescent children. J Pediatr Gastroenterol Nutr. 2014;58:647–653. doi:10.1097/MPG.0000000000000285.
- Damen B, Cloetens L, Broekaert WF, Francois I, Lescroart O, Trogh I, Arnaut F, Welling GW, Wijffels J, Delcour JA, et al. Consumption of breads containing in situ-produced arabinoxylan oligosaccharides alters gastrointestinal effects in healthy volunteers. J Nutr. 2012;142:470–477. doi:10.3945/jn.111.146464.
- Walton GE, Lu C, Trogh I, Arnaut F, Gibson GR. A randomised, double-blind, placebo controlled cross-over study to determine the gastrointestinal effects of consumption of arabinoxylan-oligosaccharides enriched bread in healthy volunteers. Nutr J. 2012;11:36. doi:10.1186/1475-2891-11-36.
- Francois IE, Lescroart O, Veraverbeke WS, Windey K, Verbeke K, Broekaert WF. Tolerance and the effect of high doses of wheat bran extract, containing arabinoxylan-oligosaccharides, and oligofructose on faecal output: a double-blind, randomised, placebo-controlled, cross-over trial. J Nutr Sci. 2014;3:e49. doi:10.1017/jns.2014.52.
- American Diabetes A. Diagnosis and classification of diabetes mellitus. Diabetes Care. 2010;33:S62–S9.
- Lacy BE, Mearin F, Chang L, Chey WD, Lembo AJ, Simren M, Spiller R. Bowel disorders. Gastroenterology. 2016
- Wendel-Vos GC, Schuit AJ, Saris WH, Kromhout D. Reproducibility and relative validity of the short questionnaire to assess health-enhancing physical activity. J Clin Epidemiol. 2003;56:1163–1169. doi:10.1016/S0895-4356(03)00220-8.
- Lewis SJ, Heaton KW. Stool form scale as a useful guide to intestinal transit time. Scand J Gastroenterol. 1997;32:920–924. doi:10.3109/00365529709011203.
- Ware JE Jr., Sherbourne CD. The MOS 36-item short-form health survey (SF-36). I. Conceptual framework and item selection. Med Care. 1992;30:473–483. doi:10.1097/00005650-199206000-00002.
- Metcalf AM, Phillips SF, Zinsmeister AR, MacCarty RL, Beart RW, Wolff BG. Simplified assessment of segmental colonic transit. Gastroenterology. 1987;92:40–47. doi:10.1016/0016-5085(87)90837-7.
- van Wijck K, van Eijk HM, Buurman WA, Dejong CH, Lenaerts K. Novel analytical approach to a multi-sugar whole gut permeability assay. J Chromatogr B Anal Technol Biomed Life Sci. 2011;879:2794–2801. doi:10.1016/j.jchromb.2011.08.002.
- Goossens GH, Bizzarri A, Venteclef N, Essers Y, Cleutjens JP, Konings E, Jocken JWE, Čajlaković M, Ribitsch V, Clément K, et al. Increased adipose tissue oxygen tension in obese compared with lean men is accompanied by insulin resistance, impaired adipose tissue capillarization, and inflammation. Circulation. 2011;124:67–76. doi:10.1161/CIRCULATIONAHA.111.027813.
- Weir JB. New methods for calculating metabolic rate with special reference to protein metabolism. J Physiol. 1949;109:1–9. doi:10.1113/jphysiol.1949.sp004363.
- Frayn KN. Calculation of substrate oxidation rates in vivo from gaseous exchange. J Appl Physiol Respir Environ Exerc Physiol. 1983;55:628–634. doi:10.1152/jappl.1983.55.2.628.
- Maes BD, Geypens BJ, Ghoos YF, Hiele MI, Rutgeerts PJ. 13C-Octanoic acid breath test for gastric emptying rate of solids. Gastroenterology. 1998;114:856–859. doi:10.1016/S0016-5085(98)70608-0.
- Ghoos YF, Maes BD, Geypens BJ, Mys G, Hiele MI, Rutgeerts PJ, Vantrappen G. Measurement of gastric emptying rate of solids by means of a carbon-labeled octanoic acid breath test. Gastroenterology. 1993;104:1640–1647. doi:10.1016/0016-5085(93)90640-X.
- Clegg M, Shafat A. Gastric emptying and orocaecal transit time of meals containing lactulose or inulin in men. Br J Nutr. 2010;104:554–559. doi:10.1017/S0007114510000905.
- Vilsbøll T, Krarup T, Sonne J, Madsbad S, Vølund A, Juul AG, Holst JJ. Incretin secretion in relation to meal size and body weight in healthy subjects and people with type 1 and type 2 diabetes mellitus. J Clin Endocrinol Metab. 2003;88:2706–2713. doi:10.1210/jc.2002-021873.
- Schols AM, Buurman WA, Staal van den Brekel AJ, Dentener MA, Wouters EF. Evidence for a relation between metabolic derangements and increased levels of inflammatory mediators in a subgroup of patients with chronic obstructive pulmonary disease. Thorax. 1996;51:819–824. doi:10.1136/thx.51.8.819.
- van Eijk HM, Bloemen JG, Dejong CH. Application of liquid chromatography-mass spectrometry to measure short chain fatty acids in blood. J Chromatogr B Anal Technol Biomed Life Sci. 2009;877:719–724. doi:10.1016/j.jchromb.2009.01.039.
- Ramiro-Garcia J, Hermes G, Giatsis C, Sipkema D, Zoetendal E, Schaap P, Smidt H. NG-Tax, a highly accurate and validated pipeline for analysis of 16S rRNA amplicons from complex biomes [version 2; referees: 1 approved, 1 approved with reservations, 1 not approved]. F1000Research. 2016;5. doi:10.12688/f1000research.
- Caporaso JG, Lauber CL, Walters WA, Berg-Lyons D, Lozupone CA, Turnbaugh PJ, Fierer N, Knight R. Global patterns of 16S rRNA diversity at a depth of millions of sequences per sample. Proc Natl Acad Sci USA. 2011;108(Suppl 1):4516–4522. doi:10.1073/pnas.1000080107.
- Callahan B. Silva taxonomic training data formatted for DADA2 (Silva version 132) [Data set]. Zenodo. 2018. doi:10.5281/zenodo.1172783.
- Lozupone C, Knight R. UniFrac: a new phylogenetic method for comparing microbial communities. Appl Environ Microbiol. 2005;71:8228–8235. doi:10.1128/AEM.71.12.8228-8235.2005.
- Shankar V, Agans R, Paliy O. Advantages of phylogenetic distance based constrained ordination analyses for the examination of microbial communities. Sci Rep. 2017;7:6481. doi:10.1038/s41598-017-06693-z.
- van den Brink PJ, Braak CJFT. Principal response curves: analysis of time-dependent multivariate responses of a biological community to stress. Environ Toxicol Chem. 1999;18:138–148. doi:10.1002/etc.5620180207.
- Oksanen J, Blanchet FG, Kindt R, Legendre P, Minchin PR, O'Hara RB, Simpson GL, Solymos P, Stevens MHH, Wagner H. Vegan: community Ecology Package. R package version 2.3-0; R Foundation for Statistical Computing. 2015.
- Kuhn M. Contributions from Jed Wing SW, Andre Williams, Chris Keefer, Allan Engelhardt, Tony Cooper, Zachary Mayer, Brenton, Kenkel tRCT, Michael Benesty, Reynald Lescarbeau, Andrew, Ziem LS, Yuan Tang and Can Candan. caret:Classification and Regression Training. R package version 2016.
- Robin X, Turck N, Hainard A, Tiberti N, Lisacek F, Sanchez J-C, Müller M. pROC: an open-source package for R and S+ to analyze and compare ROC curves. BMC Bioinf. 2011;12:77. doi:10.1186/1471-2105-12-77.
- Camps G, Mars M, Witteman BJM, de Graaf C, Smeets PAM. Indirect vs direct assessment of gastric emptying: a randomized crossover trial comparing C-isotope breath analysis and MRI. Neurogastroenterol Motil. 2018;30:e13317. doi:10.1111/nmo.13317.
- Marteau P, Cuillerier E, Meance S, Gerhardt MF, Myara A, Bouvier M, Bouley C, Tondu F, Bommelaer G, Grimaud JC. Bifidobacterium animalis strain DN-173 010 shortens the colonic transit time in healthy women: a double-blind, randomized, controlled study. Aliment Pharm Ther. 2002;16:587–593. doi:10.1046/j.1365-2036.2002.01188.x.
- Waller PA, Gopal PK, Leyer GJ, Ouwehand AC, Reifer C, Stewart ME, Miller LE. Dose-response effect of Bifidobacterium lactis HN019 on whole gut transit time and functional gastrointestinal symptoms in adults. Scand J Gastroenterol. 2011;46:1057–1064. doi:10.3109/00365521.2011.584895.
- FDA. Guidance for industry: irritable bowel syndrome-clinical evaluation of drugs for treatment; 2012. http://www.fda.gov/downloads/Drugs/Guidances/UCM205269.pdf.
- Kjolbaek L, Benitez-Paez A, Gomez Del Pulgar EM, Brahe LK, Liebisch G, Matysik S, Rampelli S, Vermeiren J, Brigidi P, Larsen LH, et al. Arabinoxylan oligosaccharides and polyunsaturated fatty acid effects on gut microbiota and metabolic markers in overweight individuals with signs of metabolic syndrome: a randomized cross-over trial. Clin Nutr. 2019. doi:10.1016/j.clnu.2019.01.012.
- Suriano F, Bindels LB, Verspreet J, Courtin CM, Verbeke K, Cani PD, Neyrinck AM, Delzenne NM. Fat binding capacity and modulation of the gut microbiota both determine the effect of wheat bran fractions on adiposity. Sci Rep. 2017;7:5621. doi:10.1038/s41598-017-05698-y.
- Cummings JH, Macfarlane GT, Englyst HN. Prebiotic digestion and fermentation. Am J Clin Nutr. 2001;73:415s–20s. doi:10.1093/ajcn/73.2.415s.
- Lund ML, Egerod KL, Engelstoft MS, Dmytriyeva O, Theodorsson E, Patel BA, Schwartz TW. Enterochromaffin 5-HT cells – A major target for GLP-1 and gut microbial metabolites. Mol Metab. 2018;11:70–83. doi:10.1016/j.molmet.2018.03.004.
- Lafond DW, Greaves KA, Maki KC, Leidy HJ, Romsos DR. Effects of two dietary fibers as part of ready-to-eat cereal (RTEC) breakfasts on perceived appetite and gut hormones in overweight women. Nutrients. 2015;7:1245–1266. doi:10.3390/nu7021245.
- Pantophlet AJ, Wopereis S, Eelderink C, Vonk RJ, Stroeve JH, Bijlsma S, van Stee L, Bobeldijk I, Priebe MG. Metabolic profiling reveals differences in plasma concentrations of arabinose and xylose after consumption of fiber-rich pasta and wheat bread with differential rates of systemic appearance of exogenous glucose in healthy men. J Nutr. 2016;147:152–160. doi:10.3945/jn.116.237404.
- Jurgoński A, Krotkiewski M, Juśkiewicz J, Billing-Marczak K. Suppression of postprandial glycaemia by L-arabinose in rats is more associated with starch than sucrose ingestion - short report. Pol J Food Nutr Sci. 2015;65:57.
- Seri K, Sanai K, Matsuo N, Kawakubo K, Xue C, Inoue S. L-arabinose selectively inhibits intestinal sucrase in an uncompetitive manner and suppresses glycemic response after sucrose ingestion in animals. Metab Clin Exp. 1996;45:1368–1374. doi:10.1016/S0026-0495(96)90117-1.
- Osaki S, Kimura T, Sugimoto T, Hizukuri S, Iritani N. L-arabinose feeding prevents increases due to dietary sucrose in lipogenic enzymes and triacylglycerol levels in rats. J Nutr. 2001;131:796–799. doi:10.1093/jn/131.3.796.