
ABSTRACT
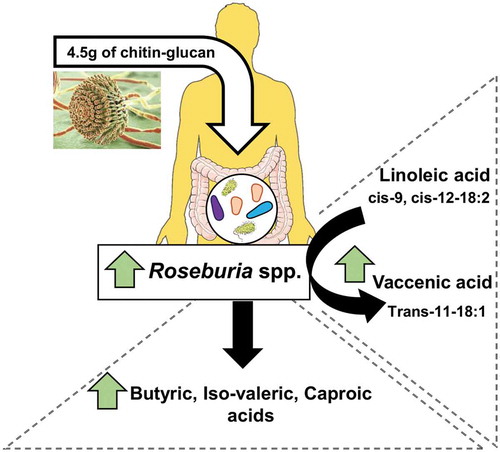
Dietary fibers are considered beneficial nutrients for health. Current data suggest that their interaction with the gut microbiota largely contributes to their physiological effects. In this context, chitin-glucan (CG) improves metabolic disorders associated with obesity in mice, but its effect on gut microbiota has never been evaluated in humans. This study explores the effect of a 3-week intervention with CG supplementation in healthy individuals on gut microbiota composition and bacterial metabolites. CG was given to healthy volunteers (n = 15) for three weeks as a supplement (4.5 g/day). Food diary, visual analog and Bristol stool form scales and a “quality of life” survey were analyzed. Among gut microbiota-derived metabolites, bile acids (BA), long- and short-chain fatty acids (LCFA, SCFA) profiling were assessed in stool samples. The gut microbiota (primary outcome) was analyzed by Illumina sequencing. A 3-week supplementation with CG is well tolerated in healthy humans. CG induces specific changes in the gut microbiota composition, with Eubacterium, Dorea and Roseburia genera showing the strongest regulation. In addition, CG increased bacterial metabolites in feces including butyric, iso-valeric, caproic and vaccenic acids. No major changes were observed for the fecal BA profile following CG intervention. In summary, our work reveals new potential bacterial genera and gut microbiota-derived metabolites characterizing the interaction between an insoluble dietary fiber -CG- and the gut microbiota.
Graphical abstract
Introduction
The nutritional interest of dietary fibers (DF) comes from the recognition of their benefits for health based on a large body of literature. DF is a category of non-digestible food components that includes lignin, cellulose, resistant starches, non-starch-polysaccharides, oligosaccharides, and analogous polysaccharides with associated health benefits.Citation1 The concept of prebiotics, initially elaborated with non-digestible oligosaccharides specifically fermented by gut bacteria,Citation2 was recently revisited.Citation3,Citation4 Prebiotics include fermentable DF which, through their interaction with the gut microbiota, modulate its composition and functions with beneficial effects for the host. On the basis of studies in animals and humans, it has been proposed that fermentable-prebiotic DF might increase satiety, improve metabolic disorders, and modulate gut-related immunity through mechanisms related to SCFA influencing endocrine and metabolic functions and intestinal epithelial integrity.Citation5–9 However, it remains unclear which are the key health physiological effects generated by insoluble DF, and whether they rely on the gut microbiota.
In this context, chitin-glucan (CG) is a novel insoluble DF considered as safe food ingredient by the European Food Safety Authority.Citation10 It is extracted from the cell walls of the fungi Aspergillus niger. For almost all fungi, the central core of the cell wall is a branched β-1,3/1,6 glucan that is linked to chitin via a β-1,4 linkage. Given CG insolubility, it is expected to be hardly fermented by the resident microbiota. However, using an in vitro approach with a Simulator of the Human Intestinal Microbial Ecosystem (SHIME), Marzorati et al. discovered that CG was fermented in all colon segments.Citation11 This was shown by an increased distal colonic acidification, an enhanced SCFA production (mainly propionate and butyrate) and low levels of gas production. Our laboratory previously showed that a 4-week administration of CG significantly improved metabolic parameters in mice on a high fat (HF) diet (body weight gain, glucose tolerance, hepatic steatosis).Citation12 In parallel to the metabolic outcomes, an increase of Roseburia spp., a butyrate-producing bacterium, was also detected in mice supplemented with CG.Citation12 Another in vivo study demonstrated the beneficial effects of CG in lowering plasma triglycerides and reducing the area of aortic fatty streak deposition in hamsters fed with an atherogenic diet.Citation13 In humans, in a 6-week, randomized, double-blind and placebo-controlled study, CG also exhibited beneficial effects by reducing blood levels of oxidized low-density lipoproteins (LDL).Citation14 However, to our knowledge, no studies evaluated the impact of CG on both gut microbiota composition and on gut-derived metabolites such as the SCFA production in humans.
In the context of the project FiberTAG (Joint Programming Initiative “A Healthy Diet for a Healthy Life” 2017–2020 https://www.fibertag.eu/), we aimed at establishing a set of biomarkers of gut barrier function and bacterial co-metabolites linking DF intake and gut-microbiota related health effect.Citation15 For this purpose, a monocentric longitudinal intervention study was conducted to characterize gut microbiota composition and major lipid and fiber-derived metabolites before and after a daily supplementation of 4.5 g of CG for 3 weeks in healthy volunteers.
Results
Subjects
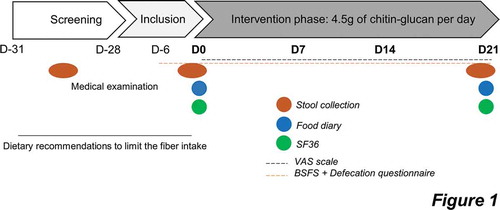
Sixteen subjects were initially included in the study. Fifteen subjects (seven men and eight women) completed the study; only one volunteer dropped out on the last test day (no reason was given). The mean age of participants was 21 years old (21 ± 1) and their body mass index was 22.1 ± 0.5 kg/m2. All volunteers (n = 15) were included in the analysis. The study was conducted from April to May 2018. The experimental design is presented in . There was 96.5% compliance in the participants. Energy intake decreased by approximately 15% after 3 weeks of CG supplementation (). Macronutrient, alcohol, and fiber intake were not significantly affected by the intervention.
Table 1. Nutrient intake before and after 3 weeks of chitin-glucan supplementation in healthy volunteers.
Figure 1. Protocol design of the intervention.
Quality of life and gastrointestinal tolerance
The 36-item short form survey used allowed us to evaluate the level of eight health outcomes including components of both physical and mental health. In our study, CG supplementation did neither alter physical nor mental health of participants (Supplemental ). Those results suggested that 3 weeks of CG supplementation had no impact on the quality of life of human volunteers.
Throughout the intervention, no statistical differences were found regarding stool frequency (p = .729) or consistency (p = .094) and empty feeling (p = .860, ). However, we observed a significant regulation of both defecation facility (p = .048) and the level of emergency (p = .023) by the treatment throughout the intervention, as assessed by mixed-effect model. Multiple comparisons only highlighted a significant change only between the day 14 and baseline, for both parameters (p = .035 for defecation facility and p = .020 for level of emergency, ). In order to evaluate the tolerance to CG by the participants, VAS scores for eight gastrointestinal symptoms were reported every day during the intervention protocol at day 0 and day 21. The evolution of the gastrointestinal parameters between the baseline and the end of intervention were not significantly modified following the intake of fibers ().
Figure 2. Gastrointestinal tolerance.
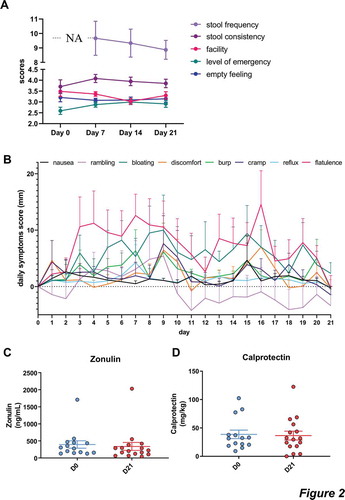
We then analyzed the impact of CG on the gut barrier by measuring the levels of zonulin in the feces, known to regulate the tight junctions and for which a high concentration of this marker is associated with increased permeability.Citation16 We did not observe any significant variation of fecal zonulin (p = .119, ). In addition, we evaluated the concentration of fecal calprotectin, a marker for gut inflammation and we did not observe any changes for this marker after CG intervention (p = .855, ).
CG impact on gut microbiota composition
The impact of CG intake on gut microbial changes was analyzed by comparing the gut microbiota of participants at baseline and after 3 weeks of intervention. The α-diversity indices, related to bacterial richness (Observed OTU), evenness (Pielou) or both (Shannon), were not significantly affected by CG supplementation (-c). Moreover, the β-diversity characterizing the overall gut microbiota composition was not modified by the treatment as shown by the principal coordinate analysis of the Bray-curtis and the Weighted UniFrac distance (,e). No changes in the gut microbiota composition were observed after the CG intervention at the phylum level (). At the family level, the only significant change detected was a decrease in the Weeksellaceae family (, ).
Table 2. Bacterial taxa and ASV significantly different after 3 weeks of CG intake.
Figure 3. CG did not change the overall composition of the gut microbiota.
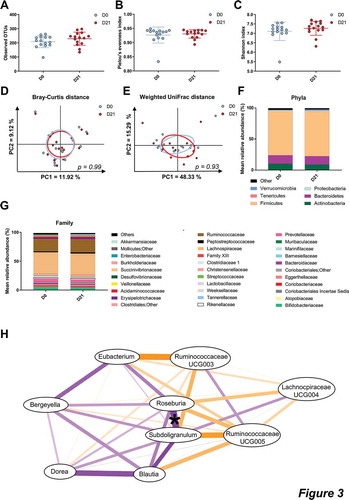
Using univariate analyzes, we found that 3 weeks of CG intake significantly altered relative abundance of nine bacterial genera (), increasing Lachnospiraceae UCG-004, Roseburia, Eubacterium, Ruminococcaceae UCG-003 and UCG-005, whereas it decreased Subdoligranulum, Bergeyella, Blautia and Dorea. The variation of Subdoligranulum genus was significantly correlated with the changes of Roseburia spp. (). In order to see if the level of these nine genera could be influenced at the individual level independently of CG supplementation, we compared their relative abundance at two time points before CG intervention: at time −30 days and at time 0 (just before the intervention). As shown in Supplemental , most of these genera were stable prior to CG intervention (no difference at −30 days versus time 0). Only the relative abundance of Bergeyella and Dorea was less expressed 30 days before the study than at day 0.
Since the abundance of specific amplicon sequence variants (ASV) within the same genus could be differentially affected by the treatment, we also performed the gut microbiota analysis based on ASV variation (). We found only two ASV significantly up-regulated by CG intervention: ASV241 related to the species Roseburia hominis, consistently with the increase of Roseburia genus, and ASV130 belonging to Terrisporobacter genus, which was not impacted by CG. Another set of 11 ASV was decreased by 3-weeks of CG intake, including ASV belonging to Blautia, Coprococcus, Subdoligranulum, Actinomyces, Collinsella or Eubacterium. Some of these genera (Blautia, Eubacterium and Subdoligranulum) were also impacted by CG.
These data suggest that a 3-week CG supplementation did not induce major changes in the overall gut microbiota composition but resulted in rather specific changes to bacterial genera and species.
CG impact on fecal microbial metabolites
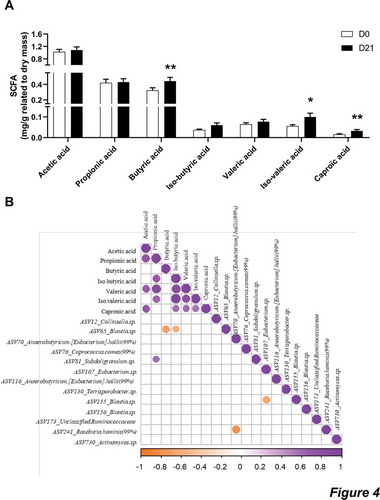
We measured the fecal concentrations of SCFA (). CG intake led to an increase of butyric, iso-valeric and caproic acids (p = .004, p = .049 and p = .003, respectively) and tended to increase iso-butyric acid (p = .091). Fecal acetic, propionic and valeric acids remained unchanged after 3 weeks of CG intake. Correlative analysis between the measured SCFA and the ASV regulated by CG showed that the decrease of the ASV65 belonging to Blautia is correlated with the increase of both butyric and iso-butyric acids (r = −0.688 and p = .008 for butyric acids; r = −0.574 and p = .03 for iso-butyric acids, ).
Figure 4. CG increased the fecal concentration of butyric, iso-valeric and caproic acids.
We found minor differences in the fecal BA concentrations after the intervention. The only detectable effect was a tendency to decrease trihydroxycholestanoic acid (THCA), a precursor of cholic acid synthesis, whose change approached significance (p = .09, ).
Figure 5. CG increased the fecal concentrations of vaccenic acid.
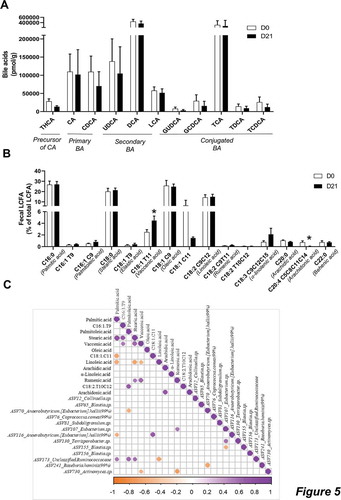
Finally, we also measured fecal LCFA, including conjugated-polyunsaturated fatty acids (cPUFA) or trans-fatty acids (). We found that CG supplementation significantly increased the levels of vaccenic acid (C18:1 trans-11) whereas it decreased the levels of arachidonic acid (C20:4 cis-5, cis-8, cis-11, cis-14). We found that the regulation of vaccenic acid correlated with the decreased ASV730 belonging to Actinomyces, upon CG intervention (r = −0.538 and p = .038, ).
Discussion
In the current study, we have shown that 3 weeks of CG intake was well tolerated by healthy subjects, had no effect on gut transit or well-being, and induced significant changes in the gut microbiota composition. In addition, CG intake also led to a significant regulation of some fecal gut microbiota-derived metabolites that correlated with specific bacteria modulated by CG.
CG was previously administered to healthy volunteers in order to evaluate its effects on oxidized low-density proteins.Citation14 In their study, the authors did not report any adverse effects after six weeks of CG supplementation (with 1.5 g or 4.5 g/day of CG). Coherently, we noticed that 3 weeks of CG intake neither altered the stool frequency nor consistency. However, the treatment significantly increased the level of emergency and decreased defecation facility throughout the study to finally become similar, compared to day 0, at the end of the study. Although this change in bowel habits observed at the day 14 compared to baseline are not favorable, it is important to note that these effects are disappearing further on upon treatment. In addition, the CG supplementation did not induce gastrointestinal symptoms in the participants. Moreover, CG did not alter the general health, assessed by questionnaires and the stool form score assessed by the BSFS was around 4, corresponding to a normal transit, all along the study.Citation17 The intake of fibers can be associated with side-effects such as gastrointestinal symptoms,Citation18 partly due to a rapid fermentation causing gas production or bloating. It is interesting to remind that CG is slowly and gradually fermented as demonstrated in vitro,Citation11 and did not induce gastrointestinal symptoms in our study. Moreover, side effects could lead to poor compliance and intake of less than the recommended dose, that it was not the case during the intervention with an observed 96% compliance. This confirms that CG seems to be well-tolerated by healthy volunteers.
We then assessed the concentrations of fecal zonulin and fecal calprotectin, which are biomarkers of gut barrier and gut inflammatory disorders, respectively.Citation19,Citation20 The fecal level of these two markers was not affected by CG treatment.
Importantly, our intervention study allowed to evaluate, for the first time in humans, the bacterial changes upon CG supplementation. Previous studies highlighted that fungal CG intake was associated with an increase of the butyrate-producing bacteria Roseburia spp. in both an in vitro model using a SHIME and in a preclinical model of high-fat diet mice.Citation11,Citation12 Here, we confirmed in healthy human volunteers that 3 weeks of CG supplementation is sufficient to increase the relative abundance of the genus Roseburia spp. and particularly an ASV belonging to the Roseburia hominis species. Given that CG is consistently linked with an increase in Roseburia spp. (i.e. in vitro, in vivo in mice, and in healthy humans) led us to propose Roseburia spp. as a target of CG intake. Furthermore, Roseburia strains are known for their considerable ability to utilize diet-derived polysaccharides and in turn produce butyrate.Citation21 In our study, we highlighted a consistent increase of butyric acid in fecal samples after CG supplementation. In association with Roseburia genus, literature indicated that another abundant group of butyrate-producing bacteria in the human colon is Faecalibacterium prausnitzii.Citation21 In accordance with these findings, we only observed that an ASV belonging to Faecalibacterium genus tended to increase upon CG intervention (p = .097, data not shown).
Other species regulated by CG in our study are also known for their ability to produce butyrate, including Anaerostipes hadrus or Anaerobutyricum [Eubacterium] hallii.Citation22 However, we found that CG significantly decreased the abundance of two ASV belonging to Anaerobutyricum [Eubacterium] hallii and only tended to increase the abundance of an ASV belonging to the Anaerostipes genus (p = .1, data not shown). CG also strongly increased Eubacterium genus. Interestingly, this genus was positively correlated with some circulating cPUFA (cis-9, cis-11-18:2; trans-9,trans-11-18:2 and cis-9,trans-11,cis-15-18:3) in a cohort of obese women supplemented with inulin-type fructans as prebiotics.Citation23 In our study these specific cPUFA were not detected in the feces of healthy subjects. However, it may be unlikely that similar associations occurred between bacterial genera and cPUFA detected in different samples such as feces or in plasma. We also found that CG intake increased the fecal levels of iso-valeric acid, a product from proteolytic fermentation, especially issued from leucine bacterial catabolism.Citation24 Furthermore, we detected an increase of fecal caproic acid. This metabolite has been recently shown to be produced from lactate oxidation.Citation25 In this model, lactate oxidation provides acetyl-CoA which enters elongation process to form butyrylCoA and hexanoylCoA (also called caproylCoA). Regarding this hypothesis, the increase of both butyric and caproic acids following the CG intake could be consistent in our study.
Secondary bile acids are produced by gut microbes via biotransformation of host-derived primary bile acids.Citation26 Regarding the bacterial metabolites produced from cholesterol, we did not detect any differences in bile acid profile after CG intake, except a tendency of CG to decrease a precursor of bile acid synthesis, the THCA. Secondary bile acids are not the sole lipidic metabolites produced by the gut microbes from lipids. Indeed, PUFA may be also reduced by bacteria, leading to trans and conjugated fatty acids. We observed that CG intake significantly increased the concentration of fecal vaccenic acid, another type of lipid-derived bacterial metabolites.Citation27 It is interesting to observe an increase of vaccenic acid in parallel to an increase of Roseburia after the CG supplementation. Indeed, a previous study identified the ability of Roseburia spp. to actively metabolize linoleic acid, forming either vaccenic acid or an hydroxy-18:1 fatty acid.Citation28 Interestingly, two species are able to produce vaccenic acid: Roseburia hominis and Roseburia inulinivorans. The ability of these species to produce vaccenic acid was confirmed in pure cultures from linoleic acid in deuterium-oxide enriched medium.Citation29 Although we did not find any statistical significant correlation between vaccenic acid and an ASV belonging to Roseburia hominis, a consistent increase of this metabolite in parallel to a higher abundance of this ASV was observed in participants receiving CG, suggesting that the increase of vaccenic acid could also be a biomarker of CG interaction with gut microbiota. Interestingly, vaccenic acid (C18:1 trans-11) level correlated positively with other trans isomers of mono-unsaturated fatty acids (C16:1 trans-9), and with the final product of bacterial reduction of rumenic acid, stearic acid (C18:0); in addition, it inversely correlated with linoleic acid (C18:2 cis-9, cis-12), the precursor of rumenic acid reduction pathway of bacteria. This is in favor of the bacterial origin of vaccenic acid increase by CG. Several studies evaluated the impact of vaccenic acid on health, and suggest a beneficial effect by this LCFA on cardiometabolic disease risk, linked namely to changes in blood lipids, both in animal models and in humans.Citation30–34 The contribution of dietary supplementation versus the “endogenous”, meaning gut microbial production of vaccenic acid to lipid metabolism, remains to be established.
In the present study, the dose of CG administered corresponds to the recommendations made by EFSA (range from 2 to 5 g per day).Citation10 Regarding some other commonly used prebiotics, a similar dose of arabino-xylan-oligosaccharides (AXOS, 4.8 g/day during 3 weeks) was sufficient to induce a selective increase of Bifidobacterium in healthy individuals.Citation35 In another work, 10 g of wheat bran extract (enriched in AXOS) consumption for 3 weeks increased Bifidobacterium in healthy adults and increased butyric acid (p = .05) by approximately 4.5% compared to a previous placebo period.Citation36 Here, we observed a 28% increase in fecal butyric acid after CG intervention, compared to baseline. For other prebiotics, including inulin-type fructans, a higher dose is commonly used (around 15–20 g/day) to induce significant changes on the gut microbiota, with mostly a focus on the bifidogenic effect.Citation5,Citation37 A dietary intervention with a higher consumption of vegetables enriched in fructans allowed to largely increase the intake of fructans (that reached 15 g per day), and lead to the increase in bifidobacteria.Citation38 Three weeks of daily supplementation (16 g/day) with a mix of inulin and fructo-oligosaccharides (FOS) in healthy individuals did not change SCFA, increased Bifidobacterium and decreased Dorea, Coprococcus and Ruminococcus.Citation39 Interestingly Dorea genus and an ASV belonging to Coprococcus also decreased in our study with CG. Another study from Baxter et al. revealed that not all fermentable fibers are equally capable of stimulating SCFA production.Citation40 Contrary to a high-amylose maize seeds (20–24 g/day) or inulin from chicory root (20 g/day), resistant potato starch (28–34 g/day) significantly induces a 29% increase of fecal butyric acid in healthy participants. Given the ability to increase fecal butyric acid after CG supplementation and knowing the beneficial health effect attributed to butyrate, it could be relevant to test this fiber in the context of metabolic and bowel disorders.Citation41
One limitation of our study is the lack of a control group (placebo intervention) since we made the choice to compare the data after versus prior intervention in the same subjects. A previous study supported the strategy to use the same individual as own control in order to highlight microbial signature of a prebiotic DF.Citation38 By taking advantage of samples collected in 13 individuals enrolled in the chitin-glucan intervention protocol 30 days before the start of the study, we were able to show that a shift in the gut microbiota composition after 3 weeks – including in particular an increase of Roseburia and Eubacterium genera- could clearly be attributed to CG treatment, and is not due to intra-individual variations of microbiome with time.
In conclusion, our study performed in healthy volunteers identified some fecal biomarkers of CG interactions with the gut microbiota. Previous evidence obtained in preclinical models suggest that CG intake could offer many benefits in the context of metabolic alterations. In this study, we confirm that some CG effects could be interesting to investigate in the context of metabolic disorders. This is for instance the case for the increase of Roseburia spp., as well as for the increase in butyric acid and vaccenic acid levels. In consequence, we think that our future effort will focus on the interest of CG supplementation in the management of metabolic alterations patients with cardiometabolic disorders, a study under investigation in the FiberTAG project.Citation15
Materials and methods
Power analysis and sample size
The primary outcome of the study was the gut microbiota composition by Illumina sequencing of 16S rRNA. Sample size was estimated using the software PASS 14.0.7 and the paired mean power analysis test. Since it is an exploratory experiment aiming to study for the first time the impact of CG on the gut microbiota in humans, we calculated the sample size based on a study performed with prebiotic with similar outcomesCitation38 and by hypothesizing a regulation of an abundant genus previously regulated in vivo by CG, namely Roseburia. In order to detect a significance difference for an abundant genus, we calculated sample size for a difference of 2% in the relative abundance with a variance of 2% between and within individuals, a significance of 0.05 and a power of 80%. For this, 15 subjects were sufficient and 16 subjects were included in the study to allow for a 10% drop out.
Human study
The recruitment was conducted from February to March 2018. Thirty-four healthy males and females were recruited by the Center of Investigation in Clinical Nutrition (CICN), the platform from the Université catholique de Louvain (Louvain-la-Neuve, Belgium) and underwent the screening test. Among them, 16 subjects were included in the study based on the predefined inclusion and exclusion criteria and therefore received the allocated intervention. Fifteen completed the study.
For this study, healthy subjects were chosen to investigate the relevance of supplementing CG in the context of a healthy lifestyle. The inclusion criteria were: men or women, aged 18–40 years, body mass index (BMI) between 18 and 25 kg/m2, Caucasian, nonsmoker, in good general health as evidenced by medical history and physical examination, the use of effective contraception for women, and need to be H2-producer. Subjects were pre-screened by a phone or mail questionnaire and they were then invited to perform a lactulose screening test to assess if they are H2-producers and stool were collected. Screening lactulose test was performed at least 4 weeks before the intervention in order to assess if they are producer of H2. Briefly, fasted subjects (at least 10 hours) received on oral load of 10 g of lactulose; then, exhaled H2 were measured every 30 minutes during 4 hours (using Lactotest 202, Medical Electronic Construction, MEC). A minimal increase of 10 ppm of H2 during three successive measurements is needed to select the H2-producers.Citation42 No increase should be observed in the first 30 minutes to avoid subjects with small intestinal bacteria overgrowth. Participants provided informed consent as well as stated willingness to comply with all study procedures and availability for the duration of the study.
The exclusion criteria were: gastro-intestinal disorders, chronic or intestinal diseases (such as ulcers, diverticulitis or inflammatory bowel diseases), smoking, current or recent use of antibiotics, pro/prebiotics (as a dietary supplement) or any products affecting the gut transit (such as laxatives) within 4 weeks before starting the study, use of drugs that modify the composition of gut microbiota (antidiabetic drugs, cholesterol-lowering drugs, and proton pump inhibitors), pregnant or lactating woman (and woman who did not use highly effective contraception), psychiatric problems (and/or using antipsychotics), chronic intake of drugs, following a particular diet (e.g., vegetarian, high-fiber, or high-protein diets), allergy or food intolerance (e.g., lactose or gluten), presence of allergy or intolerance to one component of the tested product, excessive alcohol consumption (more than 3 units/day) and participation in another clinical trial 1 month before the screening visit.
Following the screening test, selected subjects performed the medical examination with the physician investigator to verify that they were healthy. After this medical examination, subjects were advised by a dietician to avoid diets too rich in DF, from at least two weeks before the intervention. Food products consumption containing high amounts of dietary fibers (including whole grains, artichokes, Jerusalem artichokes, salsifies, leeks, onions) was limited to once a week. During the intervention, subjects were contacted frequently by mail or phone to verify that they still met the inclusion/exclusion criteria, that they followed the dietary advices and for the stool collection. Moreover, subjects were asked to complete an electronic questionnaire (via a software called REDCap, Research Electronic Data Capture) every day during the intervention, which allowed monitoring subjects’ side effects and compliance.
This study was approved by the local ethical committee (Comité d’Ethique Hospitalo-Facultaire UCLouvain/Cliniques Universitaires Saint-Luc) and written informed consent was obtained from all subjects before inclusion in the study. The trial was carried out in accordance with the Good Clinical Practice (GCP) as required by the following regulations: the Belgian law of 7 May 2004 regarding experiments on the human persons and the EU Directive 2001/20/EC on Clinical Trials. The trial was registered at ClinicalTrials.gov under identification number NCT03505177; Registered 23 April 2018).
Study design
This is a monocentric, longitudinal interventional study consisting of a daily supplementation of 4.5 g of CG during three weeks. Empty and unused packets were returned to measure compliance. The detailed protocol is schematized in . Within 2 days before day 0 and day 21, all subjects were asked to provide fresh stool samples. The detailed protocol is schematized in . The volunteers were their own control in the design of the study. The subjects were asked to complete a food diary for 3 days at day 0 and day 21 to assess the impact of the nutritional intervention on nutrient intake. The Nubel Pro program and the table of composition from Nubel 2010 were used to assess macronutrient and total fiber intake.
During the intervention, the participants were asked to fill out 100-mm visual analog scales (VAS) describing their gastrointestinal symptoms (discomfort, nausea, flatulence, cramp, burp, bloating, rumbling and reflux) every day. Each subject completed separate scales, one for each symptom. The scales were scored by measuring the distance (in millimeters) from 0. The stool frequency and consistency were investigated through daily self-assessment using the Bristol Stool Form Scale (BSFS), 3 days before the intervention and throughout the entire CG intervention. For stool frequency, scores recorded were added per week, meaning that the first result is presented seven days after the start of the study. The BSFS classifies stools into seven categories, including type 1, separate hard lumps, like nuts; type 2, sausage-shaped, but lumpy; type 3, like a sausage but with cracks on the surface; type 4, like a sausage or snake, smooth and soft; type 5, soft blobs with clear-cut edges; type 6, fluffy pieces with ragged edges, a mushy stool; type 7, watery, no solid pieces.Citation17,Citation43 A defecation questionnaire for the stools produced during the last 24 hours was also submitted and completed every day (from day −6 until day 21). A 5-point Likert’s scale assessed the ease of passage (from “very difficult” to “very easy”), the level of emergency (from “not at all urgent” to “very urgent”) and the empty feeling (“not at all empty” to “completely empty”). In addition, a generic “quality of life” questionnaire (a 36-item short form (SF36) survey) that has been widely validated,Citation44,Citation45 has been completed at day 0 and day 21. The items are grouped into eight domain scores: physical functioning, role limitations due to physical health, pain, general health, energy, social functioning, role limitations due to emotional problems and emotional well-being. Domain scores can be collapsed to a physical component summary “Physical health” (PCS) and a mental component summary “Mental health” (MHS). Each score ranges from 0 to 100, with higher values representing better self-perceived health-related quality of life.
Study outcomes
The primary outcome of the study was the evaluation of 3-weeks of CG supplementation on the gut microbiota composition. Secondary outcomes measures concern the analysis of fecal concentrations of gut microbiota-derived metabolites (including BA, LCFA and SCFA).
Fecal sample collection and processing
Stool samples were collected (within 4 days before each test day: n = 15 for D0 and n = 15 for D21) in tubes labeled with each individual’s code number, frozen (and transported to the lab) at −20°C and then stored at −80◦C for the following analysis. During the screening test (30 days prior to intervention), stool samples were also collected in order to evaluate potential time-effect based on the 16S rRNA gene sequencing prior intervention (n = 13).
Fecal microbiome sequencing and analysis
Bacterial DNA was extracted from fecal samples using the QIAamp DNA Stool Mini Kit (QIAGEN, Hilden, Germany), following the ‘Protocol Q’ that was described by Costea and colleagues,Citation46 with a slight modification: a reduction in time of bead beating step. Cells are mechanically lysed by running the Fastprep™ Instrument for 2 min at max speed (beating 1 min and resting 5 min).
Library construction and the Illumina sequencing protocol has been previously described in detail.Citation47 In brief, the V5-V6 regions of the 16S rRNA gene were targeted for PCR amplification using primers 784 F [5′-RGGATTAGATACCC-3′] and 1064 R [5′-CGACRRCCATGCANCACCT-3′]. 16S rRNA gene amplicons were sequenced by the MiSeq platform (300 bp paired-end length) at the University of Minnesota Genomics Center. All samples of this study were sequenced in the same run.
Paired-end reads were merged, demultiplexed and conducted quality control implementation (length = 281 bp, mean sequence quality score≥30) using QIIME2Citation48 pipeline with DADA2,Citation49 which we refer to herein as amplicon sequences variants (ASV). The average of the sequence in all samples (n = 31) was 29,373. An even depth of 18,750 sequences per sample was used to conduct microbiome diversity. We assigned the sequences to taxonomic categories including kingdom, phylum, class, order, family and genus levels using a pre-trained Naive Bayes classifier based on Silva 132 99% OTUs database.Citation50 Phylogenetic position of ASV is presented in the supplemental and is based on the Silva database using the Qiime2 pipeline. For significant ASV, in order to have a higher resolution of the ASV identification, online 16S rRNA databases on both NCBI blast and JGI IMG platforms were also used.
Raw sequences are deposited into the Sequence Read Archive (SRA) of NCBI (http://www.ncbi.nlm.nih.gov/sra) and can be assessed with the accession number PRJNA636138.
SCFA analysis
For SCFA analysis the native fecal samples were homogenized and subsamples of 400–500 mg were diluted 1:4 in ultrapure water and stored at −80°C. Prior to analysis 0.1 ml of 50% ortho-phosphoric acid (AppliChem GmbH, Darmstadt, Germany) was added before the samples were filtered using polyester syringe filters (REF: 729033; Macherey-Nagel GmbH & Co. KG, Düren, Germany). Afterwards, 1 µl filtrate was analyzed using a capillary gas chromatograph (HP6890 Series; Hewlett Packard Corp., Paolo Alto, California, USA) with a flame ionization detector using the column OPTIMA-FFAP (REF: 726344.10; Macherey-Nagel GmbH & Co. KG, Düren, Germany) with standards for all SCFAs measured (all: Merck Schuchardt OHG, Hohenbrunn, Germany). Fecal dry mass was assessed by drying 300–500 mg of native sample overnight at 103°C.
Markers of intestinal permeability
Zonulin and calprotectin were measured using enzyme-linked immunosorbent assay kits (K5600; K6927; Immundiagnostik AG, Bensheim, Germany) following the manufacturer’s protocol. The fecal samples were diluted to the working concentration in sample buffer using stool sample tubes (K6998SAS; Immundiagnostik AG, Bensheim, Germany).
Bile acids analysis
Bile acids were analyzed using an LTQ-Orbitrap mass spectrometer (ThermoFisher Scientific) coupled to an Accela HPLC system (ThermoFisher Scientific) with a method adapted from Guillemot-Legris et al.Citation51 Briefly, 5 mg of lyophilized feces were homogenized in ice-cold distilled water and proteins were precipitated using acetone containing seven deuterated bile acids used as internal standards. Samples were next centrifuged, and the supernatant was evaporated to dryness under nitrogen steam. The resulting residue was resuspended in methanol and injected in the HPLC-MS system.
LCFA analysis
To determine the LCFA profile in feces, we used 40 mg of previously lyophilized feces during 48 h (Labconco, freeze dryer 4.5). Forty microliter of C19 were added as extraction standard for homogenization with methanol:chloroform (1:2 V/V) by brief sonication in ice (Labsonic U, B. Braun). Homogenates were then filtered with Whatman filters n°1 (10 μm of porosity). Filters were rinsed with 2 ml of chloroform and 1 ml of methanol. Homogenates were purified with KCl 0.88% and KCl 0.88%: methanol (1:1 V/V). After centrifugation (1500 g, 5 min), the chloroform phase was collected in new tubes and evaporated under nitrogen flux until samples were completely dry. The esterified fatty acids were then subjected to alkaline hydrolysis (saponification) and free fatty acids were methylated and quantified by gas chromatography with flame ionization detector as previously described.Citation27
Statistical analysis
Data are expressed as mean ± SEM. Mixed-effects models were used for analyzing the gastrointestinal tolerance of CG throughout the study and performed on JMP Pro 14 software (with time as fixed effects and subjects as random effects). For markers of intestinal permeability, gut microbiota composition and gut-derived metabolites, statistical analyses were evaluated using a Wilcoxon paired test (from baseline to 21 days of intervention). For gut microbiota analysis, relative abundances performed in Qiime2 are expressed as means and SEM and were calculated on R for each taxa and ASV. To avoid analyzing spurious sequences, ASV with a relative abundance below 0.1% in all samples were removed. The same cutoff was applied for analysis of bacterial genera. At the genus level, if there were multiple taxa groups that all had the same genus name and belonged to the same family, we combined them together. For instance, Eubacterium genus includes [Eubacterium] brachy group, [Eubacterium] nodatum group, [Eubacterium] eligens group, [Eubacterium] fissicatena group, [Eubacterium] hallii group, [Eubacterium] ruminantium group, [Eubacterium] ventriosum group and [Eubacterium] xylanophilum group.
The p-value of the Wilcoxon test was adjusted (q-value, significant if q < 0.05) to control for the false discovery rate (FDR < 0.05) for multiple tests according to the Benjamini-Hochberg procedure.Citation52
Beta-diversity indices were evaluated on Qiime2 and visualized with a PcoA performed on R software, using ade4 package. A Monte Carlo rank test was assessed for Beta-diversity based PcoA.
Correlation network analysis was visualized using the qgraph package on R software.
Associations between the changes of ASV significantly regulated by CG and the changes of gut-derived metabolites between the day 21 and baseline were assessed by Spearman’s correlation tests. A significance level of p < .05 was adopted for all analyses. Heatmaps of correlation were visualized with the corrplot package on R software.
Abbreviations
Supplemental Material
Download Zip (156.2 KB)Acknowledgments
We are very grateful to Barbara Pachikian from the UCLouvain platform CICN (Center of Investigation in Clinical Nutrition) for her helpful support and criticism during the preparation of the study and the investigation with volunteers. We thank Remi Selleslagh and Véronique Allaeys for the excellent technical assistance. We would like to thank Céline Druart and Florence Mailleux for their precious help and implication for the LCFA analysis. PDC is a senior research associate at FRS-FNRS (Fonds de la Recherche Scientifique), Belgium. We also thank the volunteers who participated in this study. CRS is a beneficiary of a postdoctoral fellowship program fromFUNDACIÓN ALFONSO MARTÍN ESCUDERO.
Disclosure statement
The authors declare that they have no competing interests.
Supplementary material
Supplemental data for this article can be accessed on the publisher’s website.
Additional information
Funding
References
- Stephen AM, Champ MM, Cloran SJ, Fleith M, van Lieshout L, Mejborn H, Burley VJ. Dietary fibre in Europe: current state of knowledge on definitions, sources, recommendations, intakes and relationships to health. Nutr Res Rev. 2017;30:149–15.
- Gibson GR, Roberfroid MB. Dietary modulation of the human colonic microbiota: introducing the concept of prebiotics. J Nutr. 1995;125:1401–1412.
- Bindels LB, Delzenne NM, Cani PD, Walter J. Towards a more comprehensive concept for prebiotics. Nat Rev Gastroenterol Hepatol. 2015;12:303–310.
- Gibson GR, Hutkins R, Sanders ME, Prescott SL, Reimer RA, Salminen SJ, Scott K, Stanton C, Swanson KS, Cani PD, et al. Expert consensus document: the international scientific association for probiotics and prebiotics (ISAPP) consensus statement on the definition and scope of prebiotics. Nat Rev Gastroenterol Hepatol. 2017;14:491–502.
- Delzenne NM, Olivares M, Neyrinck AM, Beaumont M, Kjølbæk L, Larsen TM, Benítez-Páez A, Romaní-Pérez M, Garcia-Campayo V, Bosscher D, et al. Nutritional interest of dietary fiber and prebiotics in obesity: lessons from the MyNewGut consortium. Clin Nutr. 2020;39:414–424.
- Delzenne NM, Neyrinck AM, Cani PD. Modulation of the gut microbiota by nutrients with prebiotic properties: consequences for host health in the context of obesity and metabolic syndrome. Microb Cell Fact. 2011;10:S10.
- Delzenne NM, Neyrinck AM, Backhed F, Cani PD. Targeting gut microbiota in obesity: effects of prebiotics and probiotics. Nat Rev Endocrinol. 2011;7:639–646.
- Lordan C, Thapa D, Ross RP, Cotter PD. Potential for enriching next-generation health-promoting gut bacteria through prebiotics and other dietary components. Gut Micro. 2020;11:1–20.
- Holscher HD. Dietary fiber and prebiotics and the gastrointestinal microbiota. Gut Micro. 2017;8:172–184.
- EFSA Panel on Dietetic Products NaAN. Scientific Opinion on the safety of ‘Chitin-glucan’ as a Novel Food ingredient. Efsa J. 2010;8:1687.
- Marzorati MMV, Possemiers S. Fate of chitin-glucan in the human gastrointestinal tract as studied in a dynamic gut simulator (SHIME). J Funct Foods. 2017;30:313–320.
- Neyrinck AM, Possemiers S, Verstraete W, De Backer F, Cani PD, Delzenne NM. Dietary modulation of clostridial cluster XIVa gut bacteria (Roseburia spp.) by chitin-glucan fiber improves host metabolic alterations induced by high-fat diet in mice. J Nutr Biochem. 2012;23:51–59.
- Berecochea-Lopez A, Decorde K, Ventura E, Godard M, Bornet A, Teissedre PL, Cristol JP, Rouanet JM. Fungal chitin-glucan from Aspergillus niger efficiently reduces aortic fatty streak accumulation in the high-fat fed hamster, an animal model of nutritionally induced atherosclerosis. J Agric Food Chem. 2009;57:1093–1098.
- Bays HE, Evans JL, Maki KC, Evans M, Maquet V, Cooper R, Anderson JW. Chitin-glucan fiber effects on oxidized low-density lipoprotein: a randomized controlled trial. Eur J Clin Nutr. 2013;67:2–7.
- Neyrinck AM, Rodriguez J, Vinoy S, Maquet V, Walter J, Bischoff SC, Laville M, Delzenne NM. The FiberTAG project: tagging dietary fibre intake by measuring biomarkers related to the gut microbiota and their interest for health. Nutr Bull. 2020;45:59–65.
- Schwiertz A, Spiegel J, Dillmann U, Grundmann D, Burmann J, Fassbender K, Schafer KH, Unger MM. Fecal markers of intestinal inflammation and intestinal permeability are elevated in Parkinson’s disease. Parkinsonism Relat Disord. 2018;50:104–107.
- Alyousif Z, Miller JL, Sandoval MY, MacPherson CW, Nagulesapillai V, Dahl WJ. The effects of Bifidobacterium animalis ssp. lactis B94 on gastrointestinal wellness in adults with Prader-Willi syndrome: study protocol for a randomized controlled trial. Trials. 2018;19:256.
- Eswaran S, Muir J, Chey WD. Fiber and functional gastrointestinal disorders. Am J Gastroenterol. 2013;108:718–727.
- Leech B, McIntyre E, Steel A, Sibbritt D. Risk factors associated with intestinal permeability in an adult population: A systematic review. Int J Clin Pract. 2019;73:e13385.
- Bischoff SC, Barbara G, Buurman W, Ockhuizen T, Schulzke JD, Serino M, Tilg H, Watson A, Wells JM. Intestinal permeability–a new target for disease prevention and therapy. BMC Gastroenterol. 2014;14:189.
- Louis P, Flint HJ. Diversity, metabolism and microbial ecology of butyrate-producing bacteria from the human large intestine. FEMS Microbiol Lett. 2009;294:1–8.
- Louis P, Flint HJ. Formation of propionate and butyrate by the human colonic microbiota. Environ Microbiol. 2017;19:29–41.
- Druart C, Dewulf EM, Cani PD, Neyrinck AM, Thissen JP, Delzenne NM. Gut microbial metabolites of polyunsaturated fatty acids correlate with specific fecal bacteria and serum markers of metabolic syndrome in obese women. Lipids. 2014;49:397–402.
- Barker HA. Amino acid degradation by anaerobic bacteria. Annu Rev Biochem. 1981;50:23–40.
- Zhu X, Tao Y, Liang C, Li X, Wei N, Zhang W, Zhou Y, Yang Y, Bo T. The synthesis of n-caproate from lactate: a new efficient process for medium-chain carboxylates production. Sci Rep. 2015;5:14360.
- Winston JA, Theriot CM. Diversification of host bile acids by members of the gut microbiota. Gut Micro. 2020;11:158–171.
- Druart C, Bindels LB, Schmaltz R, Neyrinck AM, Cani PD, Walter J, Ramer-Tait AE, Delzenne NM. Ability of the gut microbiota to produce PUFA-derived bacterial metabolites: proof of concept in germ-free versus conventionalized mice. Mol Nutr Food Res. 2015;59:1603–1613.
- Devillard E, McIntosh FM, Duncan SH, Wallace RJ. Metabolism of linoleic acid by human gut bacteria: different routes for biosynthesis of conjugated linoleic acid. J Bacteriol. 2007;189:2566–2570.
- McIntosh FM, Shingfield KJ, Devillard E, Russell WR, Wallace RJ. Mechanism of conjugated linoleic acid and vaccenic acid formation in human faecal suspensions and pure cultures of intestinal bacteria. Microbiology. 2009;155:285–294.
- Tyburczy C, Major C, Lock AL, Destaillats F, Lawrence P, Brenna JT, Salter AM, Bauman DE. Individual trans octadecenoic acids and partially hydrogenated vegetable oil differentially affect hepatic lipid and lipoprotein metabolism in golden Syrian hamsters. J Nutr. 2009;139:257–263.
- Wang Y, Lu J, Ruth MR, Goruk SD, Reaney MJ, Glimm DR, Vine DF, Field CJ, Proctor SD. Trans-11 vaccenic acid dietary supplementation induces hypolipidemic effects in JCR:LA-cp rats. J Nutr. 2008;138:2117–2122.
- Wang Y, Jacome-Sosa MM, Ruth MR, Goruk SD, Reaney MJ, Glimm DR, Wright DC, Vine DF, Field CJ, Proctor SD. Trans-11 vaccenic acid reduces hepatic lipogenesis and chylomicron secretion in JCR:LA-cp rats. J Nutr. 2009;139:2049–2054.
- Tholstrup T, Raff M, Basu S, Nonboe P, Sejrsen K, Straarup EM. Effects of butter high in ruminant trans and monounsaturated fatty acids on lipoproteins, incorporation of fatty acids into lipid classes, plasma C-reactive protein, oxidative stress, hemostatic variables, and insulin in healthy young men. Am J Clin Nutr. 2006;83:237–243.
- Gebauer SK, Chardigny JM, Jakobsen MU, Lamarche B, Lock AL, Proctor SD, Baer DJ. Effects of ruminant trans fatty acids on cardiovascular disease and cancer: a comprehensive review of epidemiological, clinical, and mechanistic studies. Adv Nutr. 2011;2:332–354.
- Maki KC, Gibson GR, Dickmann RS, Kendall CW, Chen CY, Costabile A, Comelli EM, McKay DL, Almeida NG, Jenkins D, et al. Digestive and physiologic effects of a wheat bran extract, arabino-xylan-oligosaccharide, in breakfast cereal. Nutrition. 2012;28:1115–1121.
- Francois IE, Lescroart O, Veraverbeke WS, Marzorati M, Possemiers S, Evenepoel P, Hamer H, Houben E, Windey K, Welling GW. Effects of a wheat bran extract containing arabinoxylan oligosaccharides on gastrointestinal health parameters in healthy adult human volunteers: a double-blind, randomised, placebo-controlled, cross-over trial. Br J Nutr. 2012;108:2229–2242.
- Le Bastard Q, Chapelet G, Javaudin F, Lepelletier D, Batard E, Montassier E. The effects of inulin on gut microbial composition: a systematic review of evidence from human studies. Eur J Clin Microbiol Infect Dis. 2020;39:403–413.
- Hiel S, Bindels LB, Pachikian BD, Kalala G, Broers V, Zamariola G, Chang BPI, Kambashi B, Rodriguez J, Cani PD, et al. Effects of a diet based on inulin-rich vegetables on gut health and nutritional behavior in healthy humans. Am J Clin Nutr. 2019;109:1683–1695.
- Healey G, Murphy R, Butts C, Brough L, Whelan K, Coad J. Habitual dietary fibre intake influences gut microbiota response to an inulin-type fructan prebiotic: a randomised, double-blind, placebo-controlled, cross-over, human intervention study. Br J Nutr. 2018;119:176–189.
- Baxter NT, Schmidt AW, Venkataraman A, Kim KS, Waldron C, Schmidt TM. Dynamics of human gut microbiota and short-chain fatty acids in response to dietary interventions with three fermentable fibers. mBio. 2019:10.
- Canfora EE, Jocken JW, Blaak EE. Short-chain fatty acids in control of body weight and insulin sensitivity. Nat Rev Endocrinol. 2015;11:577–591.
- Eisenmann A, Amann A, Said M, Datta B, Ledochowski M. Implementation and interpretation of hydrogen breath tests. J Breath Res. 2008;2:046002.
- Lewis SJ, Heaton KW. Stool form scale as a useful guide to intestinal transit time. Scand J Gastroenterol. 1997;32:920–924.
- Matcham F, Norton S, Steer S, Hotopf M. Usefulness of the SF-36 Health Survey in screening for depressive and anxiety disorders in rheumatoid arthritis. BMC Musculoskelet Disord. 2016;17:224.
- Ramin S, Mysz MA, Meyer K, Capistrant B, Lazovich D, Prizment A. A prospective analysis of dietary fiber intake and mental health quality of life in the Iowa Women’s health study. Maturitas. 2020;131:1–7.
- Costea PI, Zeller G, Sunagawa S, Pelletier E, Alberti A, Levenez F, Tramontano M, Driessen M, Hercog R, Jung FE, et al. Towards standards for human fecal sample processing in metagenomic studies. Nat Biotechnol. 2017;35:1069–1076.
- Deehan EC, Yang C, Perez-Munoz ME, Nguyen NK, Cheng CC, Triador L, Zhang Z, Bakal JA, Walter J. Precision microbiome modulation with discrete dietary fiber structures directs short-chain fatty acid production. Cell Host Microbe. 2020.
- Bolyen E, Rideout JR, Dillon MR, Bokulich NA, Abnet CC, Al-Ghalith GA, Alexander H, Alm EJ, Arumugam M, Asnicar F, et al. Reproducible, interactive, scalable and extensible microbiome data science using QIIME 2. Nat Biotechnol. 2019;37:852–857.
- Callahan BJ, McMurdie PJ, Rosen MJ, Han AW, Johnson AJ, Holmes SP. DADA2: high-resolution sample inference from Illumina amplicon data. Nat Methods. 2016;13:581–583.
- Wang Q, Garrity GM, Tiedje JM, Cole JR. Naive Bayesian classifier for rapid assignment of rRNA sequences into the new bacterial taxonomy. Appl Environ Microbiol. 2007;73:5261–5267.
- Guillemot-Legris O, Mutemberezi V, Cani PD, Cani PD, Muccioli GG. Obesity is associated with changes in oxysterol metabolism and levels in mice liver, hypothalamus, adipose tissue and plasma. Sci Rep. 2016;6:19694.
- Benjamini YHY. Controlling the false discovery rate: a practical and powerful approach to multiple testing. J Royal Statist Soc. 1995;57:289–300.