
ABSTRACT
The etiology of Crohn’s disease (CD) is multifactorial. Bacterial and fungal microbiota are involved in the onset and/or progression of the disease. A bacterial dysbiosis in CD patients is accepted; however, less is known about the mycobiome and the relationships between the two communities. We investigated the interkingdom relationships, their metabolic consequences, and the changes in the fungal community during relapse and remission in CD.
Two cohorts were evaluated: a British cohort (n = 63) comprising CD and ulcerative colitis patients, and controls. The fungal and bacterial communities of biopsy and fecal samples were analyzed, with the fecal volatiles; datasets were also integrated; and a Dutch cohort (n = 41) comprising CD patients and healthy controls was analyzed for stability of the gut mycobiome.
A dysbiosis of the bacterial community was observed in biopsies and stool. Results suggest Bacteroides is likely key in CD and may modulate Candida colonization. A dysbiosis of the fungal community was observed only in the Dutch cohort; Malassezia and Candida were increased in patients taking immunosuppressants. Longitudinal analysis showed an increase in Cyberlindnera in relapse. Saccharomyces was dominant in all fecal samples, but not in biopsies, some of which did not yield fungal reads; amino acid degradation was the main metabolic change associated with CD and both bacteria and fungi might be implicated.
We have shown that Bacteroides and yeasts may play a role in CD; understanding their role and relationship in the disease would shed new light on the development and treatment of CD.
Introduction
The etiology of inflammatory bowel disease (IBD) is multifactorial. There are perturbations of immune regulation and the microbiota,Citation1 and over 200 risk alleles.Citation2 The incidence of IBD has increased with Westernization: in countries where IBD was rare, the incidence is approaching that in Europe.Citation3 Environmental factors influence the intestinal microbiota.Citation4 Many observations suggest a link between fungi and IBD. There are increased fungal metabolites in the feces of patients with active Crohn’s disease (CD).Citation5 Anti-Saccharomyces cerevisiae antibodies (ASCA) in CD patients are linked with genetic mutations involved in the immune response to fungi and IBD.Citation6 Many studies have reported changes in the bacterial community in IBDCitation7,Citation8 but fewer have looked at the role of fungi in IBD.Citation9–19 In general, the mycobiome of IBD patients contains significantly more Candida than that of healthy controlsCitation11–14 and an increase of Malassezia has been reported in CD patients.Citation18 A recent study has also shown that Debaryomyces (a yeast commonly found in food products) prevents healing in the inflamed mucosa of CD patients.Citation20
Murine studies support a role for fungi in IBD. Iliev et al.Citation21 demonstrated that ASCA increases in a murine colitis model induced by ingestion of dextran sodium sulfate (DSS). Analysis of the fecal mycobiome showed that C. tropicalis dominated the community in DSS-treated mice, and nonpathogenic Saccharomyces was decreased. Tissue damage appears to be regulated by Dectin-1, a C-type lectin receptor used for fungal cell wall recognition. Increased susceptibility to DSS and increased fungal burden (Candida) was also observed in Dectin-3-deficient mice.Citation22 Susceptibility to colitis in Dectin-1 deficient mice was ameliorated by the antifungal agent fluconazole. This is controversial because broad-spectrum antifungals may exacerbate colitisCitation23,Citation24 and increase bacterial diversity, resulting in increases of pathogenic species.Citation23 A study on CX3CR1+ expressing mononuclear phagocytes (MNPs) reported that these are involved in the immune response to intestinal fungi; selective depletion of intestinal CX3CR1+ MNPs in mice treated with DSS was associated with severe colitis (ameliorated by the use of fluconazole); and an impaired immune response to fungi in CD subjects with a polymorphism of CX3CR1 gene.Citation25 These studies imply that fungi have a complex role in IBD. They also indicate an interaction between fungi and bacteria. Interkingdom communications in the intestinal environment, where organisms are physically closely located, appears intuitive. Indeed, both positiveCitation13,Citation26 and negativeCitation27 connections between bacteria and fungi have been reported (summarized inCitation28).
Microbiome studies are typically costly and incur confounding technical challenges. The fecal volatile metabolome is relatively inexpensive to investigate. Biomarker amplicon sequencing focuses on the composition of a community. The metabolome can potentially provide a clearer indication of the functional activity of a microbial community. We have undertaken metabolomics studies of volatile compounds from feces of patients with IBD and other disorders,Citation29,Citation30 and reported the changes in volatile organic compounds (VOCs) associated with CD and ulcerative colitis (UC).Citation5 Some of these metabolites appeared to be of fungal originCitation5 and this led us to investigate the fecal mycobiome of patients with IBD.
The need to integrate multiple high-dimensional biology approaches to further understanding of the function of gut microbiota in IBD has been proposed.Citation1 A recent study showed the potential of combining omics approach to integrate metabolomics and microbiome results.Citation31 Other studies have investigated the bacterial and fungal community of the same cohort (e.g.Citation12,Citation13), and recently a study combined metabolomics data to bacterial and fungal community datasets.Citation19 In here, a similar multi-omics approach was undertaken to explore the underlying biological mechanisms, using an optimized genomic analysis of the fecal mycobiome of patients with IBDCitation32 and a dedicated tool to integrate datasets.Citation33
This study investigated the hypothesis that interactions between fungal and bacterial communities and consequential metabolic changes would be observed in patients with CD, and that the mycobiome would evolve during periods of disease activity and remission. Specifically, we performed a cross-sectional analysis of a British cohort of 23 patients with CD, 20 with UC and 20 non-IBD controls. In addition, we analyzed the fungal community longitudinally, in a Dutch cohort of CD patients (n = 26), sampled multiple times in relapse and remission, and healthy controls (n = 15). Analysis of the bacterial community of the Dutch cohort was beyond the scope of this work and it has been already published in a separate study.Citation34 We investigated the fecal microbiome samples from both cohorts of IBD patients and the mucosal microbiome and fecal volatile metabolome from the British cohort. State-of-the-art multi-omics integration tools were deployed.
Results
Patients’ demographics
The demographic and clinical characteristics of the British cohort are given in . Stool samples from 63 subjects were analyzed. For a subset of patients (n = 41), biopsies from the ileum (n = 34) and/or the colon (n = 80) were analyzed. Active disease was defined based on fecal calprotectin (>200 μg/g) for both CD and UC.
Table 1. Demographic of the participants from the British cohort. Continuous variables are expressed as median (interquartile range, IQR), the other variables (sex, smoking, distribution and medications use) are shown as n and percentage. L1 = ileal CD, L2 = colonic CD, L3 = ileo-colonic distribution of CD. BMI = body mass index, TI = terminal ileum, TC = transverse colon, SC = sigmoid colon, bdl = below detection limit. * refers to the whole cohort of 63 subjects. ** use of antibacterial drugs in the 3 months prior collection of the sample
Table 2. Demographic of the participants from the Dutch cohort at baseline (n = 41). Continuous variables are expressed as median (interquartile range, IQR), the other variables (sex, smoking, status and distribution) are shown as n and percentage. L1 = ileal CD, L2 = colonic CD, L3 = ileo-colonic distribution of CD
Table 3. Medication use and clinical data (Dutch cohort) for remission and active samples (n = 44). T1 = time point 1, T2 = time point 2. Continuous variables are expressed as median (interquartile range, IQR), the other variables (distribution and medications use) are shown as n and percentage. L1 = ileal, L2 = colonic, L3 = ileo-colonic distribution of CD. CRP = C-reactive protein. * use of antibiotics in the 2 months prior collection of the sample
For the Dutch cohort, 53 samples were collected from 26 CD patients during relapse and remission. Activity of CD was based on fecal calprotectin as described in Tedjo et al.Citation34 Stool was also donated by 15 healthy individuals, 14 of these were sampled twice on different occasions. Demographic and clinical characteristics for this cohort are presented in .
Bacterial microbiome of the British cohort
The bacterial community of stool and biopsy samples was analyzed. After filtering, the median number of reads per sample was 100,905.5 (min 4401, max 2,511,360 reads). Alpha diversity, which looks at and compares groups in terms of number for species and their abundance, () was lower in CD (biopsy and stool) compared with control and/or UC, but this was not observed when comparing controls and UC patients.
Figure 1. Alpha and Beta diversity results of the bacterial gut microbiome (British cohort). A1 to A4: Alpha diversity of the bacterial microbiome from the four specimen types: terminal ileum, transverse colon, sigmoid colon and stool. Samples were grouped according to diagnosis: Crohn’s disease (CD), ulcerative colitis (UC) and Controls. Three indices were considered: Fisher alpha, richness and Shannon index. Pair-wise ANOVA was calculated between the groups (CD, UC and Controls) and if significant, stars are shown on top (* p < .05, ** p < .01 and *** p < .001). B1 to B4: Nonmetric distance scaling (NMDS) showing clustering of samples. To produce these charts, samples (n = 176) from patients for which terminal ileum (TI), transverse colon (TC), sigmoid colon (SC) and stool were available. In B3 only samples from CD patients (n = 72) were considered. The charts were produced using Bray–Curtis (Operational taxonomy units (OTUs) level). The ellipses represent 95% confidence interval of standard error for a given group. The table in B2 summarizes permutational multivariate analysis of variance (PERMANOVA) results for all the distances, Bray–Curtis, unweighted UniFrac (UniFrac) and weighted (W. UniFrac). R2 refers to the percentage of variability among samples’ microbiome that can be explained by that factor/metadata
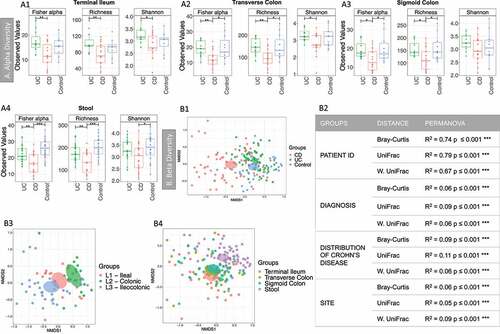
Sample similarity was explored using beta diversity, that is, how similar samples were in terms of distribution of taxa (using Bray-curtis distance), or phylogeny (unweighted Unifrac distance), or a combination of both (weighted Unifrac distance) (). Permutational multivariate analysis of variance (PERMANOVA) analysis (2) showed that the main sources of variability in community structure were the patient ID, followed by the diagnosis and the site/specimen type. Samples clustered according to the diagnosis ) and the distribution of the disease (), with clear segregation between patients with exclusively ileal or colonic disease. PERMANOVA analysis was also performed for all the predictors (Supplemental material 2, Table S1). Significant variability in community structure was found for age, BMI, sex, ASCA, antibiotics, mesalamine- and immunosuppressant-use. Significant results were obtained for the use of antibiotics, but no sample was excluded, as none was an outlier (see Supplemental material 3, Figure S1).
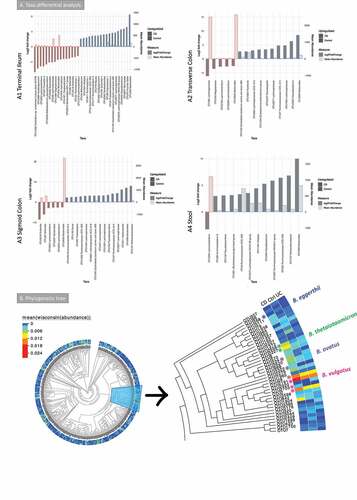
Taxa differential analysis (enrichment analysis to highlight taxa that are log2 fold different) results are shown in . Operational taxonomy units (OTUs) assigned to Lachnoclostridium were increased in all mucosa sites and the stool in CD. Some OTUs assigned to Bacteroides were increased in the mucosa in CD, whereas others were decreased. Bacteroides was decreased in stool samples in CD. The butyrate producers Faecalibacterium and Roseburia were depleted in CD in most of the sites analyzed. The same was observed for Methanobrevibacter.
Figure 2. A Taxa differential analysis results and phylogenetic tree of the bacterial gut microbiome (British cohort). A Taxa differential analysis comparing CD and control samples. Results are presented according to sample type: A1: Terminal Ileum (TI); A2: Transverse colon (TC); A3: sigmoid colon (SC); A4: stool. The bar charts show Log2 fold change in abundance between groups (y axis on the left and dark gray bar) and the mean abundance across all the samples (y axis on the right and light gray bar). Taxa increased in CD patients have bars with a red border, meanwhile taxa increased in controls have bars with a blue border. A subset of the most important and abundant OTUs selected using Random Forest are shown; these are taxa that allowed to achieve a 70–80% of accuracy in discriminating between groups are shown (details are in Supplemental material 1). A complete list of taxa that had significant different abundance, and further details, including adjusted p values, is in Supplemental material 4. B Phylogenetic tree of bacterial 16S rRNA OTUs. Samples (n = 176) were from TI, TC, SC and stool (British cohort) with the Bacteroides branch magnified. The tree was visualized with EvolView, which was also used to add the heatmap. The * indicates OTUs that were increased in the groups analyzed or selected in the subsets (BV-STEP analysis) that best correlated with the whole OTU table
Taxonomy summary and environmental filtering results are shown in Supplemental material 3, Figure S2. Environmental filtering assumes that microbial communities under a stronger environmental pressure are more phylogenetically similar (clustered) either on a global scale (net relatedness index, NRI) or in terms of terminal clades (nearest taxon index, NTI), as closer taxa phylogenies are likely to share similar functionality. Interestingly, CD patients had higher values of both phylogenetic alpha diversity measures NRI and NTI than controls (stool and colon), and UC (all sites) implying that CD creates an environmental pressure on the microbiota (Supplemental material 3, Figure S2).
BV-STEP routine, as used previously by the authors,Citation35–37 was applied to reduce the complexity of the OTU table and find subsets of relevant OTUs. This algorithm calculates distances (Bray–Curtis) between samples by permuting through the subsets of OTUs in such a way that the distances (using fewer OTUs) remain roughly conserved in beta diversity space with the distances between samples using all the OTUs, that is, the correlation is maximized between the distances obtained from reduced subset of OTUs with that of full set of OTUs. PERMANOVA was used on the subsets obtained to see if these have discriminatory power, and whether calprotectin (an indicator of intestinal inflammation) could explain the variability of microbial communities based on these subsets (Supplemental material 2, Table S2). Seven subsets were found with the OTU table from stool, with a correlation (R) > 0.6. Up to 16% of the variability of five of these subsets could be explained by calprotectin. Similar subsets were obtained for the terminal ileum, transverse and sigmoid colon; Bacteroides OTUs were often found in the mucosa subsets, along with butyrate producers (Dorea, Roseburia, Faecalibacterium and Blautia) and Escherichia-Shigella (see Supplemental material 2, Table S2).
Taxa differential analysis and BV-STEP showed that some Bacteroides OTUs were more relevant in CD, whilst others were more abundant in controls. In order to understand whether the OTUs increased in one group (CD or control) or site (mucosa sites or stool) where different from those increased in the others, further analysis was carried out. The Evolview website was used to visualize the phylogenetic tree with the Bacteroides branch () isolated and magnified. These results suggested that these OTUs were phylogenetically different. These OTUs were subsequently blasted against NCBI NT database (see methods). OTUs that were significantly increased in CD cohort were assigned to B. ovatus (OTU234 and OTU3322) (terminal ileum) and B. thetaiotaomicron (OTU2656 and OTU2227) (transverse colon). B. eggerthii (OTU268) was significantly more abundant in controls (TI, TC and stool). Other relevant OTUs (OTU2191, OTU2703, OTU2 and OTU28) were assigned to B. vulgatus. These were increased both in CD and controls compared to UC.
Fungal microbiome of the British cohort
The majority of the 63 stool samples provided fungal reads, suggesting a strong fungal 18S rRNA signal. After filtering, the median number of reads per sample was 143,310 (min 3,480, max 975,102 reads). All biopsy samples (n = 119) were sequenced for fungal 18S rRNA; 38 yielded a low number of, or mainly spurious, reads and were discarded during analysis (see Methods and Supplemental material 3, Figure S3), leaving 81 samples. After filtering, the median number of reads per sample was 54,614 (min 1,314, max 225,544 reads).
Alpha diversity results describing microbial richness and diversity (-A1 and A2) found few (<20) OTUs per sample, with no significant differences between the three groups (controls, CD and UC) for Richness and the two indices (Shannon and Fisher Alpha). Beta diversity results revealed no inherent clustering based on stool samples. Analysis of all biopsy samples, using PERMANOVA analysis with unweighted UniFrac distance, found that the patient ID, diagnosis and CD status (relapse vs remission) explained the variability of the microbial community (-B1, B2 and table in B4). A difference in community signature was observed between IBD (CD and UC) in relapse and controls (-B3). No significant difference was observed in alpha diversity and minimal change in taxa differential analysis between these groups.
Figure 3. Fungal microbiome results (British cohort). Samples were from stool (n = 63) and biopsies (n = 81): terminal ileum, transverse colon and sigmoid colon. A Alpha diversity (richness) of samples from the mucosa (A1) and stool (A2). Samples were grouped according to diagnosis: Crohn’s disease (CD), ulcerative colitis (UC) and Controls. Pair-wise ANOVA was calculated between the groups (CD, UC and Controls) but was not significant. B Beta diversity analysis of the fungal microbiome from the biopsy samples. B1 to B3: Nonmetric distance scaling (NMDS) showing clustering of samples. B1 compares samples according to diagnosis. In B2 only samples from CD patients were considered, meanwhile inflammatory bowel disease (IBD) active vs Control samples are compared in B3. A dashed line links samples from the same patient. The charts were produced using unweighted UniFrac (Operational taxonomy units (OTUs) level). The ellipses represent 95% confidence interval of standard error for a given group. The table in B4 summarizes permutational multivariate analysis of variance (PERMANOVA) results for distances for which significant results were obtained. R2 refers to the percentage of variability among samples’ microbiome that can be explained by that factor/metadata. Only significant comparisons are presented (* p < .05, ** p < .01 and *** p < .001)
PERMANOVA analysis (Supplemental material 2, Table S3) was also performed for clinical/demographic metadata as previously described. Samples from all the sites were analyzed together (separately no significant results were obtained for most comparison), many parameters gave significant results (i.e. age, sex, smoking, calprotectin and medications); for most of these the R2 was low (up to 3%), non-metric multidimensional scaling (NMDS) charts were produced for all metadata that gave significant results (Supplemental material 3, Figure S4). These did not show any clustering. BV-STEP analysis was performed, but no significant results were obtained.
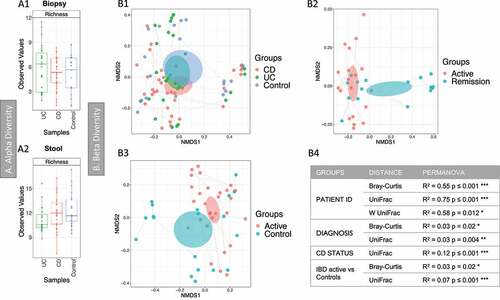
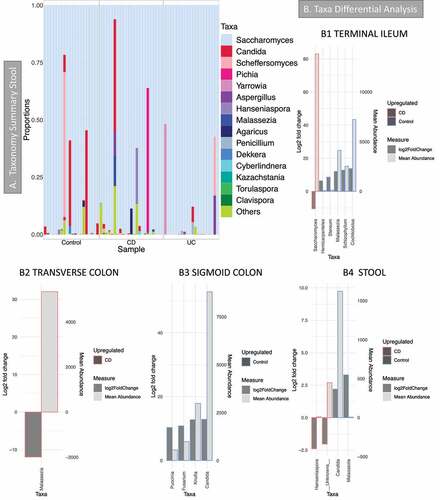
Taxonomy summary of dominant taxa in stool samples () showed that Saccharomyces was the most common genus: it was present in every stool sample and was the most abundant genus in biopsies, but it is not present in every mucosa sample (Supplemental material 3, Figure S5). Other common genera were Candida and Malassezia. Taxa differential analysis (-B1 to B4, details in Supplemental material 5) show that Candida was reduced in CD in the sigmoid colon and stool compared with controls; Malassezia increased in the transverse colon and stool of CD patients but was reduced in the ileum in the same patients. However, Malassezia abundance in stool was rather low (-4), and as the bar chart in and Supplemental material 8 show, it was observed only in a few samples.
Figure 4. Fungal microbiome results (British cohort). Samples were from stool (n = 63) and biopsies (n = 81): terminal ileum, transverse colon and sigmoid colon. A Taxonomy summary for stool at genus level. B Taxa differential analysis (CD vs Controls) at genus level. Results are presented according to sample type: B1: Terminal Ileum samples; B2: Transverse colon samples; B3: sigmoid colon samples; B4: stool. The bar charts show Log2 fold change in abundance between groups (y axis on the left and dark gray bar) and the mean abundance across all the samples (y axis on the right and light gray bar). Taxa increased in CD patients have bars with a red border, meanwhile taxa increased in controls have bars with a blue border. Detail of these results, including adjusted p values, is in Supplemental material 5
Fungal microbiome of the Dutch cohort
The median number of reads per sample, after filtering, was 109,459.5 (min 5822, max 392,780 reads). Initial analysis compared baseline samples from healthy controls and CD patients (cross-sectional analysis) (). Subsequently, longitudinal analysis enabled comparison of relapse and remission in the same patients (). The comparison of healthy controls and CD patients at baseline showed that there was a dysbiosis in the fungal community in CD. This was characterized by a reduction in diversity (); beta diversity analysis also showed a separation of samples between CD and controls (). The number of OTUs in these samples was low, similar to the British cohort. Saccharomyces was again the most abundant genus () followed by Candida. PERMANOVA analysis, considering demographic and clinical data, gave significant results (Supplemental material 2, Table S4) for two medications: biologics and immunosuppressants. Clustering analysis (Principal Coordinate Analysis (PCoA)) showed that the samples of patients receiving these treatments formed a separate cluster (-B2 and B3). Taxa differential analyses showed that Saccharomyces was significantly higher in healthy controls and Candida in CD patients, Malassezia was also increased in subjects with CD (, details in Supplemental material 6). Patients who were taking immunosuppressants had an increase of Candida and Malassezia (). As observed in the British cohort, Malassezia abundance was low, and it was prevalent only in a few samples (, Supplemental material 8).
Figure 5. Results of the fungal microbiome analysis of the Dutch cohort comparing baseline samples (time point 1). Samples were grouped according to diagnosis: Crohn’s disease (CD, n = 26) and healthy controls (HC, n = 15). A Alpha diversity results (Operational taxonomy units (OTUs) level), three indices were considered: richness, Fisher alpha and Shannon. B Beta diversity results (OTUs level), clustering was made with Principal Coordinate Analysis (PCoA) using unweighted UniFrac distance. B1 samples grouped according to diagnosis. B2 yes = individuals given immunosuppressants (n = 11), no = individuals not taking the medication (n = 29). B3 yes = individuals given biologics (n = 12), no = individuals not taking the medication (n = 28). Permutational multivariate analysis of variance (PERMANOVA) results (R2 and p value) are reported in the bottom of each chart. C Taxonomy summary at genus level. D Taxa differential analysis, bar charts showing the OTUs that were significantly different between the two groups (HC and CD) and CD patients on Immunosuppressant (yes) vs CD patients that were not given the medication (no). The bar charts show Log2 fold change in abundance between groups (y axis on the left and dark gray bar) and the mean abundance across all the samples (y axis on the right and light gray bar). Detail of these results, including adjusted p values, is in Supplemental material 6
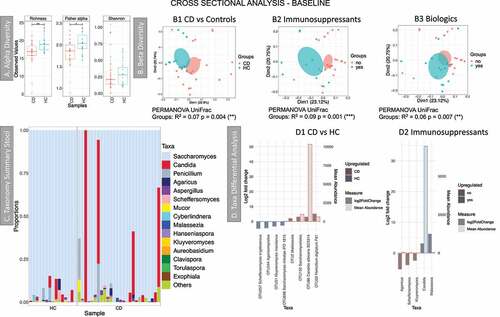
Figure 6. Results of the longitudinal analysis of the Dutch cohort; HC: T1 vs T2. RA: from remission to active, RR: stayed in remission. A Delta alpha diversity, average of changes in alpha diversity for each sample in each group. B Beta diversity (Principal Coordinate Analysis) describes the differences among samples/groups considering the species observed and their phylogeny (unweighted UniFrac distance). The link between points indicates that the two samples are from the same subject. The ellipses represent 95% confidence interval of standard error for a given group. PERMANOVA results (R2 and p value) are reported in the bottom of the PCoa chart. C Beta diversity distance describes the stability of the community during time within the same subject. A higher value indicates that there is less stability during time. Significant results are presented with an * (* p < .05, ** p < .01 and *** p < .001). D Beta-dispersion box plot comparing variance of samples from the group centroid, RA vs RR. E Taxa differential analysis, showing OTUs that were significantly different between RA and RR at time point 1 (E1) and RA and RR at time point 2 (E2). The bar charts show Log2 fold change in abundance between groups (y axis on the left and dark gray bar) and the mean abundance across all the samples (y axis on the right and light gray bar). Detail of these results, including adjusted p values, is in Supplemental material 6
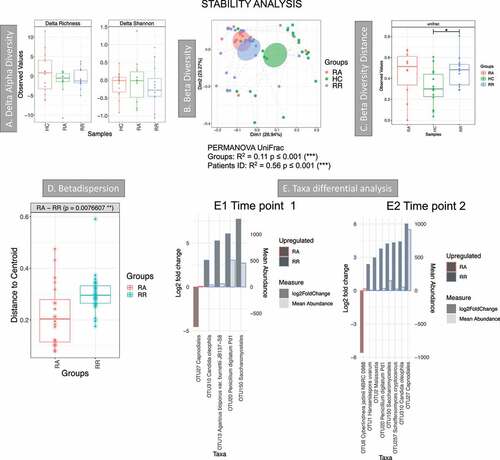
Stability analysis compared two time points for three different groups: 1) RA patients that were in remission at time point 1 and in relapse at time point 2, 2) RR patients that were in remission at both time points and 3) HC healthy controls at two time points (T1 and T2) (). Delta alpha diversity () calculated the changes in alpha diversity (delta) for each individual and the average changes were then compared between groups. This analysis shows that these estimates were stable over time for all groups. Overall, the community was mildly conserved within the same individual, as the ID explains almost 60% of the variability among samples (PERMANOVA results in ). Beta diversity estimates, describing the stability of the community during time within the same subject (), also showed that the community of healthy individuals was more stable over time, and this is significant when comparing HC and RR. Beta diversity analysis (), show that RA samples cluster tightly compared to RR and HC, suggesting that RA samples are similar to one another. This was also confirmed by the beta-dispersion analysis of the spread of samples (), which showed that RA samples have a significantly smaller variance when compared to RR.
Taxa differential analysis showed that at T1 a Capnodiales OTU was more abundant in RA, but it was more abundant in RR at T2 ( and E2). Cyberlindnera was increased during relapse at T2 (-E2). This suggests that Capnodiales may be associated with remission and that Cyberlindnera may thrive during inflammation.
Metabolomic profiles of the British cohort
The metabolomics profiles of CD patients and healthy controls, from the British cohort, were compared using PLS-DA (partial least-squares projection to latent structures-discriminant analysis): CD patients formed a separate cluster (Supplemental material 3, Figure S6-A). Part of this separation was driven by two compounds related to fungal metabolism: 3,7-dimethylocta-1,6-dien-3-ol and octanal;Citation5,Citation38–40 although these may also be derived from bacteria. Branched chain fatty acids (BCFA), that is, 3-methylbutanoic acid, 2-methylpropanoic acid and 2-methylbutanoic acid, were also increased in CD, along with esters (propyl propanoate, 2-methylpropyl propanoate and 2-methylpropyl butanoate), butanoic acid, nonanal and indole (Supplemental material 3, Figure S6-B).
Multi-omics analysis of the British cohort data
VOCs, bacterial and fungi microbiome data from stool were integrated with the DIABLO algorithm, a multi-group derivative of sparse PLS-DA. The DIABLO algorithm reduces each multivariate dataset of multiple features (VOCs, bacteria, and fungi) to components (derived by a linear combination of features in these multi-omics dataset) such that the first few components can be used to explain the majority of variability of samples. Furthermore, the algorithm has a Mfold cross-validation step to mask out outliers and gives control on the tuning of the number of components to achieve the best performance. The CD patients and controls were all compared. A model with two components was chosen: this had a classification error rate >41% (Mahalanobis distance, Supplemental material 3, Figure S7). Because of the high error rate these results were not presented. The second analysis compared CD patients in relapse and controls. The BER (balanced error rate) was lower than that in the previous comparison (around 34%, Supplemental material 3, Figure S8). Bacterial and metabolomics data were the best to discriminate between the two groups (Supplemental material 3, Figure S9-A) and showed the highest correlation for both components 1 and 2 (Supplemental material 2, Figure S9-B1 and B2). In CD in relapse, the Circo plot correlations (Supplemental material 3, Figure S9-C) showed positive correlation between BCFA (2-methylbutanoic acid, 3-methylbutanoic acid and 2-methylpropanoic acid) with fungal OTUs assigned to Saccharomyces. OTUs assigned to Pichia, Candida and Aspergillus (higher in controls) were negatively correlated with both Saccharomyces and BCFA (higher in active CD). Saccharomyces OTUs and BCFA were also positively correlated to many bacterial OTUs assigned to Hafnia, Proteus, Lachnoclostridium, Lactobacillus, Proteus etc. (Supplemental material 3, Figure S9-C).
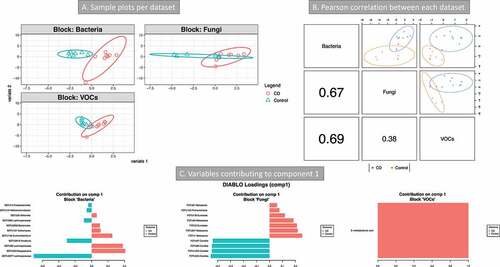
A third integration was done by combining the micro- and myco-biome data from the transverse colon mucosa and VOCs from stool (). CD patients were compared with controls. The lowest error rate (34%) was obtained with 1 component (Mahalanobis distance, Supplemental material 3, Figure S10). The bacterial community, followed by the metabolome, was the best dataset to discriminate between the two categories (). The features from component 1 allowed the separation of the two groups for all three datasets (). These features are presented in . The majority of the bacterial OTUs found by this analysis were also implicated in taxa differential analysis and BV-STEP analysis. In particular, OTU2656 (B. thetaiotamicron, ). The fungal OTUs that were discriminant in component 1 space () were assigned to Malassezia and Eurotiales (increased in CD) and Candida (increased in control). Only one metabolite was included in this component: 3-methylbutanoic acid. Correlations of variables of different datasets are between 3-methylbutanoic acid and most of the bacterial OTUs increased in CD (positive correlations), including OTU2656 Bacteroides. Candida OTUs were negatively correlated to most of the bacterial OTUs increased in CD (including OTU2656 B. thetaiotamicron) and positively correlated to those increased in control (Supplemental material 2, Table S7).
Figure 7. Integration of metabolomics (volatile organic compounds, VOCs) and metagenomics (bacterial and fungi) data (Crohn’s disease (CD) vs Controls). 16S and 18S rRNA datasets were from transverse colon biopsy samples, and VOCs from stool samples. Samples groups were CD (n = 9) vs Controls (n = 7). A three omics sample plots are shown separately. B Pearson’s correlation of the three data set for component 1. C variables contributing to component 1
Discussion
This study is the first to investigate the microbiome and the mycobiome from stool and biopsies, and the fecal volatile metabolome in parallel in patients with Crohn’s disease and controls. These three datasets were integrated with a statistical procedure, that allows a consolidated view of multi-omics datasets. An optimized protocolCitation32 was used for the investigation of fungal communities and standardized approaches to the microbiomeCitation41 and metabolome.Citation42 We have clearly shown relationships between volatile metabolites involved in the degradation of amino acids and intestinal microbiota in CD and found fungal species (Malassezia and Cyberlindnera) increased in CD that may have a role to play in the disease (e.g. pathogenesis or they thrive in inflammation).
The British cohort enabled us to integrate three omics datasets (matching disease and controls); in addition, paired biopsies and feces were available from many donors. In stool, the most abundant genus was Saccharomyces, followed by Candida, as already reported.Citation43 The limited amount of fungal material observed in the mucosa suggests the widespread presence of Saccharomyces in stool to the subjects’ dietary habits, as also recently suggested.Citation44 However, our multi-omics analysis has shown Saccharomyces increased in active CD as compared to controls and is positively correlated with some of the metabolites. A potential role of Saccharomyces in CD has been proposed,Citation45 although this theory was quickly opposed by Sendid et al.Citation46 and by the observation of S. cerevisiae reduced in active IBD and that it could actually be beneficial.Citation12
In stool (British cohort), a decrease of Candida abundance in CD patients was observed. This is in contrast to the current literatureCitation11–13 (and that observed in the Dutch cohort) that show Candida increased in IBD; we relate our observation to the small size of the cohort. However, we identified the negative correlation between Candida and B. thetaiotamicron (Bt), and we might speculate that the low abundance of Candida is related to the presence of Bt in the British cohort. Others have reported that Bt is able to prevent Candida colonization.Citation27 A recent study also showed in a mouse model how Bt actually eliminates Candida species through enzymatic degradation.Citation47 Evidence for inter-kingdom relationships is shown by the increase in Ascomycota and decrease of Bacteroidetes observed in cirrhotic patients that is predictive of hospitalization within 90 days.Citation48 We believe that the inter-kingdom relationship between Candida and Bacteroides in IBD requires further exploration.
Malassezia was increased in the colonic mucosa but reduced in the stool samples of CD patients (British cohort). It was increased in CD patients from the Dutch cohort. Suhr et al. 2015Citation49 reported that Malassezia is often found in stool and it is probably able to grow in the intestine.Citation50 Further evidence comes from a recent study that showed Malassezia increased in the colonic mucosa of CD patients and that it exacerbated colitis in mice.Citation18 Our observation of an increase of this yeast within the colon of CD patients supports the findings of this earlier study suggesting further research opportunities to clarify Malassezia’s role in CD.
In the Dutch cohort ( and supplemental material 6) Candida abundance increased with the disease (CD vs HC at baseline), meanwhile, Saccharomyces decreased, in agreement with earlier reports.Citation11–13 Incorporating explanatory variables, that is, medication, has shown that variation in the fungal community at baseline can be explained by two medications: immunosuppressants and biologics. Patients who took immunosuppressants had significantly more Candida (OTU and genus level) and more Malassezia (genus level) ( and Supplemental material 6), although its abundance was low. Candidiasis are not uncommon in IBD patients treated with immunosuppressants,Citation51 however, the mechanisms of how these classes of medications influence the fungal community is unknown. The temporal analysis of CD cohort has shown that the fungal community is less stable in CD patients and this was significant for patients who achieved remission. However, RA patients had a less variable community (lower beta-dispersion) when compared to patients achieving remission. We also observed that when they transitioned from remission to relapse, Cyberlindnera increased. An increase of Cyberlindnera during relapse has been previously reported.Citation16
The analysis of the fungal community in the two cohorts has highlighted some discrepancies. Differences in diet, the use of healthy controls in the Dutch cohort, opposed to non-IBD individuals referred to gastroenterology clinic in the British cohort, and differences in the DNA extraction method may account for some of these. The British cohort also had fewer samples and the lack of separation between CD and controls in stool samples may be because the study was underpowered. However, even studies with a higher sampling struggled to find a separation between CD and controls, as was reported only when IBD and controls were compared.Citation12
A dysbiosis of the bacterial community was observed both in the feces and biopsies of CD patients (British cohort), who were more dysbiotic than UC, as expected.Citation52 The CD microbiome had lower alpha diversity estimates, formed a separate cluster in beta-diversity analysis, and was found to be more phylogenetically similar. Both the pathogenesis of CD and its distribution contributed to the variability in the microbiome. Disease distribution explains 15% of the diversity and there was a clear separation of CD patients with and without ileal involvement (-B3). Other factors also influenced the microbiome composition (PERMANOVA analysis); the strongest predictor being patient ID, showing that the community was conserved in the mucosa and feces within an individual (R2 up to 79%). A similar pattern of samples originating from the same subject has been observed previously.Citation53 The site of the biopsy was less relevant (circa 6%) ( and table in B2, Bray-Curtis distance). Extrinsic parameters (including clinical data) were also implicated in explaining the variability in the microbiome structure: in particular BMI, age, ASCA antibodies and some medications. However, it is difficult to confirm these influences as the CD patients were younger, leaner and more likely to have ASCA antibodies, as compared to UC and control subjects (). Therefore, these interpretations should be approached with caution. Drugs, including mesalamine and immunosuppressantsCitation54 can influence the gut microbiome.Citation55 Mesalamine is taken by the majority of the patients with UC (15/20, ) and we are unable to separate the influence of UC and mesalamine treatment. However, mesalamine has been shown to influence microbial metabolism and to reduce bacterial colonization of the mucosa.Citation56
Taxa differential analysis has shown a reduction of Faecalibacterium in the colon and feces in CD, which is in agreement with other studies.Citation52 Other microorganisms considered beneficial were also reduced in the colon and feces of CD patients: RoseburiaCitation16 and Methanobrevibacter. Lachnoclostridium was increased in CD, in every mucosa site and in the feces. L. bolteae (previously known as Clostridium bolteae), was proposed as a marker of dysbiosis related to the use of antibioticsCitation57 and inflammation;Citation58 however, it was decreased in CD pediatric patients.Citation8 Further studies are indicated to clarify its role in dysbiosis and CD.
Bacteroides OTUs have shown mixed trends as some were increased in the mucosa of CD patients, although others were reduced. We found that B. thetaiotamicron (Bt) was increased in the colonic mucosa of CD patients (British cohort). Bt is crucial to the maturation of the gut immunityCitation59 and microbiota,Citation60 however, it can also have deleterious effects in the gut.Citation61–63 Its interaction with F. prausnitzii (Fp) is particularly relevant in gut homeostasis; Bt prepares the gut environment for Fp to colonize, by reducing the redox potential;Citation60 at the same time, Fp counterbalances and attenuates Bt effects in the gut.Citation60 The decrease of Fp is likely to be one of the main events during dysbiosis and it is related to the increase in redox potential in the gut.Citation64,Citation65 Our observation of an increase of Bt and a simultaneous decrease of Fp in the colon of CD patients confirms that reduction of the latter actually causes the dysbiosis; a loss of Fp means that not only its anti-inflammatory action is lost,Citation66 but also its counterbalancing effect on Bt. Moreover, the host susceptibility is likely to be a key factor in Bt impact in IBD.Citation61–63
B. vulgatus was amongst the representative OTUs being part of the subsets that best correlated with the whole OTUs table (Supplemental material 2, Tables S2). OTUs assigned to this species were highly abundant in CD and controls. Both mechanistic and observational studies have shown that it causes inflammation only in susceptible hosts.Citation63,Citation67 Metatranscriptomic analysis shows that this is active in IBD patients.Citation68
A final note on Bacteroides OTUs, many were part of the subsets obtained with the BV-STEP analysis, whose variability could be explained by calprotectin and increased in CD biopsies, showing a link between Bacteroides and inflammation, observed also by others.Citation69,Citation70
The analysis of VOCs in stool has shown an increase of metabolites associated with active CD,Citation5 that is, 3,7-dimethylocta-1,6-dien-3-ol; nonanal; 2-methylpropyl butanoate; propyl 2-methyl propanoate; propyl propanoate. 3,7-dimethylocta-1,6-dien-3-ol is a monoterpene in culinary herbs and produced by some fungi,Citation37 including Saccharomycetales yeasts.Citation39 Nonanal is an aldehyde, and these molecules are often increased in CD: we reported this both in human CDCitation29 and in a mouse model of IBD.Citation71 This has been linked to inflammation and oxidative stress;Citation5 in this context, these molecules are produced endogenously during a non-enzymatic lipid peroxidation.Citation72
The observation of other compounds is less consistent with previously published literature, as these were actually proposed as discriminatory compounds for healthy subjects: indole; butanoic acid; 2-methylbutanoic acid; 3-methylbutanoic acid; 2-methylpropanoic acid; 2-pentanone.Citation5 Other studies confirm our observation that indole increases in CD.Citation73,Citation74 Indole is produced during the catabolism of tryptophan by bacteria in the distal colon, in the presence of the free amino acid and absence of carbohydrates.Citation75,Citation76 SCFA (short chain fatty acid) are commonly produced in the colon during fiber degradation. In contrast, BCFA are exclusively produced by fermentation of branched-chained amino acids in the distal colon.Citation76 Their increase in CD, observed here and by others,Citation74 may be related to an increase in the fermentation of host amino acids obtained from luminal blood, mucins and inflamed tissue.Citation73 Marchesi et al. linked the presence of amino acids (including the precursors of BCFA) in the colon of CD patients to malabsorptionCitation77 .
The integration of the mucosa associated micro- and myco-biome and VOCs from stool of the British cohort was the most informative of the three cases considered. It confirmed Bt to be a signature feature in the mucosa of CD patients. This was positively correlated to 3-methylbutanoic acid and negatively correlated with Candida. These analyses have also shown Malassezia as a diagnostic modality to discriminate between the CD and controls cohort.
The comparison of active CD patients and controls cohort has shown that OTUs assigned to Sacchromycetales yeasts were correlated with BCFA, suggesting that these strains may be metabolically active. S. cerevisiae can produce this molecule by valine degradation.Citation78 2-pentylfuran was also correlated with Saccharomycetales OTUs. Production of aldehydes can occur spontaneously during oxidative stress and may indicate inflammation rather than the activity of fungi;Citation79 however, it may be consumed in some foods including soy milkCitation80 and cheese production.Citation81
Results of the comparison of all CD patients vs control were not included because the model gave an high error rate (close to 50%). This was likely related to the small sample size and to the high variability within the groups, due to many factors, such as the distribution and status of the disease.
To summarize, the use of Mixomics to integrate microbial with metabolomics data has shown that there is an increase of amino acid degradation in CD patients. Some of the VOCs were correlated with specific bacteria in addition to fungi in CD patients. This suggests that 1) fungi might be metabolically active in relapsing CD patients, 2) the degradation of amino acids is associated with CD and fungi might be involved in this. In the mucosa, this analysis confirmed that Bt and Malassezia are the representative features in CD. The role of Bt in controlling Candida colonization warrants further investigation.
There are some limitations in our study. The British cohort was relatively small which caused two issues: the analysis of the mycobiome did not support the hypothesis that it changes in diseased patients; the second issue was related to the multi-omics integration algorithm; the small cohort size gave a high BER that limits our ability to draw conclusive interpretations from our results. It is recently demonstrated that most of the mycobiome observed in the stool of healthy individuals is from food or the mouth,Citation44 with the only exception of C. albicans, the only colonizer found so far in healthy individuals.Citation82 This was also confirmed in our study, as we observed fungi only in a fraction of mucosa samples. In stool, the presence of fungi from the diet makes it difficult to discriminate between the mycobiota and fungi that are simply in transit. A recent study confirmed this discrepancy between mycobiome profiles from stool compared to biopsies, showing that Debaryomyces was prevalent (and viable) in the inflamed mucosa, but not in non-inflamed tissue or stool samples from the same individual.Citation20 The use of a multi-omics approach may partially solve this issue, as the correlation of fungi with metabolites can be an indication of their activity, although a higher sample size is required in order to reduce the error rate and get more reliable correlations. The analysis of the transcriptome instead of the metagenome as a template for mycobiome analysis, coupled with metabolomics analysis, may overcome this issue altogether. Nonetheless, we have shown that an integrative approach such as the one considered in this study, informed by the latest in multivariate statistics, should be able to divulge underlying biological mechanisms that not otherwise possible by analyzing these datasets in isolation. Criticisms may rise by the use of 18S rRNA as target gene for the analysis of the mycobiome instead of the more commonly used ITS; however, we have already shown its efficacy in discriminating taxa relevant to the human gut.Citation32
These data add a new layer of complexity to the microbial community in the intestine. Fungi reside in the mucosa and appear to interact with the bacterial community – especially Bacteroides. Mining these interactions is key to understanding the role of fungi on the disease and will lead to new potential therapies, i.e. manipulation of the microbiomeCitation28 informed by the individual micro- and myco-biota (personalized medicine). Our study did not show a direct link between fungi and CD, However, as discussed by Richard et al.Citation28 only when specific opportunistic fungi are present, these appear to have a role in the severity of inflammation. Therefore, the use of antifungal and antibacterial agents should be used with care; and it is worth remembering that many drugs have off-target effects that act on microbes.Citation55,Citation83,Citation84 Another aspect of our study was the integration of fungal and bacterial datasets with VOCs metabolomics data. We are aware that the small cohort did not allow to draw definite conclusions on the involvement of fungi in the production of fungal metabolites.Citation5 However, we firmly believe that by carrying out integrated analysis on larger cohorts or on cohorts of patients with a confirmed fungal involvement, we will be able to show this direct link VOCs-fungi and to produce a very powerful diagnostic method that would greatly facilitate the application of personalized treatments.
In conclusion, our findings suggest that i) some fungal species, not only Candida but also Malassezia and Cyberlindnera, are likely to have a role in the pathogenesis and/or course of CD. Immunosuppression may increase Candida and Malassezia colonization in CD patients, ii) the low abundance of fungi in the mucosa means that fungi are not involved in all CD patients, iii) Bacteroides strains play a substantial role in CD and may modulate Candida colonization, and iv) amino acid degradation is associated with CD, and we identified bacterial and fungal species involved in their production or that are members of this trophic network.
Methods
Design and participants
This was an observational study of two cohorts from different geographic areas in Liverpool, UK, and Maastricht, The Netherlands. Patients recruited at the Royal Liverpool University Hospital (UK), between August 2015 and May 2017, were part of the European Union Seventh Framework Programme (EU-FP7) funded SysMedIBD (Systems Medicine of chronic Inflammatory Bowel Disease) Project (https://www.sysmedibd.eu/); they had CD or UC, or were non-IBD patients referred to the gastroenterology clinic who underwent diagnostic colonoscopy (controls). Demographic and clinical data including the diagnosis, disease phenotype (Montreal classification) and fecal calprotectin were collected. Donors from Maastricht were part of the Inflammatory Bowel Disease South Limburg Cohort (IBDSL) (The Netherlands):Citation85 they included CD patients and healthy controls who were followed-up and sampled at least twice. All donors gave written informed consent before they were enrolled in the studies in accordance with ethical approval (reference 15/NW/0045 (Liverpool) and NL24572.018.08 (South Limburg)).
Specimens
The British cohort stool samples were collected at home, stored chilled and brought to the hospital on the same day, or after overnight storage. Samples for DNA extraction were aliquoted immediately, transferred to the laboratory and stored at −80°C. Aliquots for VOCs analysis by gas chromatography mass spectrometry (GC-MS) were stored at −20°C. Biopsies of the ileum and colon were flash frozen in liquid nitrogen immediately, brought to the laboratory and stored at −80°C for later DNA extraction. Blood samples were collected in heparinized vials at 5 U/mL (Wockhardt UK Ltd; Wrexham; Wales): plasma was collected and stored at −20°C for later enzyme-linked immunosorbent assay (ELISA) for ASCA.
Only fecal samples were collected from the Dutch cohort: their collection and processing, including DNA extraction, performed with a modified protocol of the PSP stool DNA kit (Stratec), has been described in detail elsewhere:Citation34 the extracted DNA was sent to the Liverpool laboratory for mycobiome studies.
DNA extraction
Stool samples, from British subjects, were extracted using two kits to maximize extraction of fungal DNA, specifically a modified version of the PSP stool DNA kit (Stratec), and the QIAamp Fast DNA Stool mini kit (QIAGEN), details are described in Frau et al.Citation32 DNA was extracted from the biopsies with the QIAamp cador Pathogen Mini Kit (Pretreatments T2, B1) (QIAGEN, Manchester, UK); it was quantified and normalized for downstream analysis as for feces.Citation32
Amplicons sequencing
Fungal 18S rRNA amplicons were sequenced for both cohorts, while bacterial 16S rRNA amplicons were sequenced only for the British cohort. A 2-step PCR universal tail tag dual index barcoding approach was used.Citation41 Fungal amplicons were generated as previously described.Citation32 For bacterial 16S rRNA gene (V4 region) sequencing, the method described by D’Amore et al.Citation41 was used with a modified forward primer (Supplemental material 1, Table S1). Details are in the Supplemental material 1 (Supplementary Methods).
VOCs
VOCs were analyzed following the method by Reade at al.Citation42 Frozen stool samples were aliquoted (450–500 mg) and dispensed in 10 mL vials. VOCs were extracted from the headspace using a divinylbenzene-carboxen-polydimethylsiloxane solid-phase micro-extraction fiber (Sigma-Aldrich, Dorset, UK) and analyzed in a PerkinElmer Clarus 500 GC/MS quadrupole benchtop system (Beaconsfield, UK) fitted with a 60 m Zebron ZB-624 column (inner diameter 0.25 mm, length 60 m, film thickness 1.4 μm (Phenomenex, Macclesfield, UK)).Citation42 Chromatograms were analyzed with Automated Deconvolution System (AMDIS) using the NIST mass spectral library to identify the peaks. This library included compounds related to fungi and CD markers.Citation5 Statistical analysis was performed in Metaboanalyst,Citation86 adjusting first the NA values to half of the minimum value for each compound and normalization by log transform (glog) and Pareto-scaling was performed, and reported using partial least squares discriminant analysis.
ASCA ELISA
Anti-Saccharomyces cerevisiae antibody ELISA (IgG) was carried out with a commercial kit (EUROIMMUN cat. EV 2841–9601 G, Luebeck, Germany) using plasma samples which were analyzed in triplicate.
All experimental procedures were carried out following manufacture’s protocols and risk assessments were produced.
Bioinformatics and statistical analysis
Details are in the Supplementary Methods (Supplemental material 1).
Declarations
Ethical statements
For specimens collected in Liverpool (UK), the ethical approval for the use of stool samples (SysMedIBD; EU-FP7 project, under grant agreement no. 305564) was granted by NRES Committee North West – Liverpool East, reference (15/NW/0045). For the specimens collected in the Netherlands (Inflammatory Bowel Disease South Limburg Cohort (IBDSL) (The Netherlands)), ethical approval was given by the Medical Ethics Committee of Maastricht University Medical Center and was executed according to the revised Declaration of Helsinki (59th General Assembly of WMA, Seoul, South Korea, Oct. 2008). The study has been registered in the Central Committee on Research Involving Human Subjects (CCMO) registry under file number NL24572.018.08.
Availability of data and materials
The datasets of the sequencing raw reads supporting the conclusions of this article are available in the European Nucleotide Archive, under study accession numbers: PRJEB38969 (16S rRNA, stool and biopsy samples, British cohort), PRJEB29083 and PRJEB39119 (18S rRNA, stool samples, British cohort), PRJEB39016 (18S rRNA, biopsy samples, British cohort), PRJEB39063 (18S rRNA, stool samples, Dutch cohort).
Competing interests
The authors declare no competing interests.
Supplemental Material
Download Zip (3 MB)Acknowledgments
Samples of the British cohort were collected in the context of the EU-FP7 project, SysMedIBD [FP7/2012–2017] under the SysmedIBD grant, agreement no. 305564; therefore, we would like to thank the colleagues involved in the project, particularly the research nurses involved in the collection of the sample. The authors would also like to thank: the technical support of CGR, in particular Dr Anita Lucaci for carrying out the experiments concerning the sequencing of the samples and Dr Richard Gregory for the bioinformatics support; and Dave Berry, the technical support in Gastroenterology Research Unit (University of Liverpool), for his constant support in the lab.
Supplementary material
Supplemental data for this article can be accessed here
Additional information
Funding
References
- Segal JP, Mullish BH, Quraishi MN, Acharjee A, Williams HRT, Iqbal T, Hart AL, Marchesi JR. The application of omics techniques to understand the role of the gut microbiota in inflammatory bowel disease. Therap Adv Gastroenterol. 2019;12:1–21. doi:10.1177/1756284818822250.
- Ye BD, McGovern DPB. Genetic variation in IBD: progress, clues to pathogenesis and possible clinical utility. Expert Rev Clin Immunol. 2016;12:1091–1107. doi:10.1080/1744666X.2016.1184972.
- Barreiro-de Acosta M, Alvarez Castro A, Souto R, Iglesias M, Lorenzo A, Dominguez-Muñoz JE. Emigration to western industrialized countries: a risk factor for developing inflammatory bowel disease. J Crohn’s Colitis. 2011;5:566–569. doi:10.1016/j.crohns.2011.05.009.
- David LA, Maurice CF, Carmody RN, Gootenberg DB, Button JE, Wolfe BE, Ling AV, Devlin AS, Varma Y, Fischbach MA, et al. Diet rapidly and reproducibly alters the human gut microbiome. Nature. 2014;505:559–563. doi:10.1038/nature12820.
- Ahmed I, Greenwood R, Costello B, Ratcliffe N, Probert CS. Investigation of faecal volatile organic metabolites as novel diagnostic biomarkers in inflammatory bowel disease. Aliment Pharmacol Ther. 2016;43:596–611. doi:10.1111/apt.13522.
- Miyoshi J, Sofia MA, Pierre JF. The evidence for fungus in Crohn’s disease pathogenesis. Clin J Gastroenterol. 2018;11:449–456. doi:10.1007/s12328-018-0886-9.
- Manichanh C. Reduced diversity of faecal microbiota in Crohn’s disease revealed by a metagenomic approach. Gut. 2006;55:205–211. doi:10.1136/gut.2005.073817.
- Gevers D, Kugathasan S, Denson LA, Vázquez-Baeza Y, Van Treuren W, Ren B, Schwager E, Knights D, Song SJ, Yassour M, et al. The treatment-naive microbiome in new-onset Crohn’s disease. Cell Host Microbe. 2014;15:382–392. doi:10.1016/j.chom.2014.02.005.
- Ott SJ, Kühbacher T, Musfeldt M, Rosenstiel P, Hellmig S, Rehman A, Drews O, Weichert W, Timmis KN, Schreiber S. Fungi and inflammatory bowel diseases: alterations of composition and diversity. Scand J Gastroenterol. 2008;43:831–841. doi:10.1080/00365520801935434.
- Li Q, Wang C, Tang C, He Q, Li N, Li J. Dysbiosis of gut fungal microbiota is associated with mucosal inflammation in Crohn’s disease. J Clin Gastroenterol. 2014;48:513–523. doi:10.1097/MCG.0000000000000035.
- Liguori G, Lamas B, Richard ML, Brandi G, Da Costa G, Hoffmann TW, Di Simone MP, Calabrese C, Poggioli G, Langella P, et al. Fungal dysbiosis in mucosa-associated microbiota of Crohn’s disease patients. J Crohn’s Colitis. 2016;10:296–305. doi:10.1093/ecco-jcc/jjv209.
- Sokol H, Leducq V, Aschard H, Pham H-P, Jegou S, Landman C, Cohen D, Liguori G, Bourrier A, Nion-Larmurier I, et al. Fungal microbiota dysbiosis in IBD. Gut. 2016;66:1039–1048. doi:10.1136/gutjnl-2015-310746.
- Hoarau G, Mukherjee PK, Gower-Rousseau C, Hager C, Chandra J, Retuerto MA, Neut C, Vermeire S, Clemente J, Colombel JF, et al. Bacteriome and mycobiome interactions underscore microbial dysbiosis in familial Crohn’s disease. MBio. 2016;7:e01250–16. doi:10.1128/mBio.01250-16.
- Imai T, Inoue R, Kawada Y, Morita Y, Inatomi O, Nishida A, Bamba S, Kawahara M, Andoh A. Characterization of fungal dysbiosis in Japanese patients with inflammatory bowel disease. J Gastroenterol. 2018;54:149–159. doi:10.1007/s00535-018-1530-7.
- Chehoud C, Albenberg LG, Judge C, Hoffmann C, Grunberg S, Bittinger K, Baldassano RN, Lewis JD, Bushman FD, Wu GD. Fungal signature in the gut microbiota of pediatric patients with inflammatory bowel disease. Inflamm Bowel Dis. 2015;21:1. doi:10.1097/MIB.0000000000000454.
- Lewis JD, Chen EZ, Baldassano RN, Otley AR, Griffiths AM, Lee D, Bittinger K, Bailey A, Friedman ES, Hoffmann C, et al. Inflammation, antibiotics, and diet as environmental stressors of the gut microbiome in pediatric Crohn’s disease. Cell Host Microbe. 2015;18:489–500. doi:10.1016/j.chom.2015.09.008.
- Mukhopadhya I, Hansen R, Meharg C, Thomson JM, Russell RK, Berry SH, El-Omar EM, Hold GL. The fungal microbiota of de-novo paediatric inflammatory bowel disease. Microbes Infect. 2014;17:304–310. doi:10.1016/j.micinf.2014.12.001.
- Limon JJ, Tang J, Li D, Wolf AJ, Michelsen KS, Funari V, Gargus M, Nguyen C, Sharma P, Maymi VI, et al. Malassezia is associated with Crohn’s disease and exacerbates colitis in mouse models. Cell Host Microbe. 2019;25(377–388.e6):377–388.e6. doi:10.1016/j.chom.2019.01.007.
- Nelson A, Stewart CJ, Kennedy NA, Lodge JK, Tremelling M, Probert CS, Parkes M, Mansfield JC, Smith DL, Hold GL, et al. The impact of NOD2 genetic variants on the gut mycobiota in Crohn’s disease patients in remission and individuals without gastrointestinal inflammation. J Crohn’s & Colitis. 2021;15(5):800–812. doi: 10.1093/ecco-jcc/jjaa220
- Jain U, Ver Heul AM, Xiong S, Gregory MH, Demers EG, Kern JT, Lai CW, Muegge BD, Barisas DAG, Steven Leal-Ekman J, et al. Debaryomyces is enriched in Crohn’s disease intestinal tissue and impairs healing in mice. Science. 2021;371:1154–1159. doi:10.1126/science.abd0919.
- Iliev ID, Funari VA, Taylor KD, Nguyen Q, Reyes CN, Strom SP, Brown J, Becker CA, Fleshner PR, Dubinsky M, et al. Interactions between commensal fungi and the C-type lectin receptor Dectin-1 influence colitis. Science. 2012;336:1314–1317. doi:10.1126/science.1221789.
- Wang T, Pan D, Zhou Z, You Y, Jiang C, Zhao X, Lin X. Dectin-3 deficiency promotes colitis development due to impaired antifungal innate immune responses in the gut. PLoS Pathog. 2016;12:e1005662. doi:10.1371/journal.ppat.1005662.
- Qiu X, Zhang F, Yang X, Wu N, Jiang W, Li X, Li X, Liu Y. Changes in the composition of intestinal fungi and their role in mice with dextran sulfate sodium-induced colitis. Sci Rep. 2015;5:1–12. doi:10.1038/srep10416.
- Wheeler ML, Limon JJ, Bar AS, Leal CA, Gargus M, Tang J, Brown J, Funari VA, Wang HL, Crother TR, et al. Immunological consequences of intestinal fungal dysbiosis. Cell Host Microbe. 2016;19:865–873. doi:10.1016/j.chom.2016.05.003.
- Leonardi I, Li X, Semon A, Li D, Doron I, Putzel G, Bar A, Prieto D, Rescigno M, McGovern DPB, et al. CX3CR1+, mononuclear phagocytes control immunity to intestinal fungi. Science. 2018;359:232–236. doi:10.1126/science.aao1503.
- Sovran B, Planchais J, Jegou S, Straube M, Lamas B, Natividad JM, Agus A, Dupraz L, Glodt J, Da Costa G, et al. Enterobacteriaceae are essential for the modulation of colitis severity by fungi. Microbiome. 2018;6:1–16. doi:10.1186/s40168-018-0538-9.
- Fan D, Coughlin LA, Neubauer MM, Kim J, Kim MS, Zhan X, Simms-Waldrip TR, Xie Y, Hooper LV, Koh AY. Activation of HIF-1α and LL-37 by commensal bacteria inhibits Candida albicans colonization. Nat Med. 2015;21:808–814. doi:10.1038/nm.3871.
- Richard ML, Sokol H. The gut mycobiota: insights into analysis, environmental interactions and role in gastrointestinal diseases. Nat Rev Gastroenterol Hepatol. 2019;16:331–345. doi:10.1038/s41575-019-0121-2.
- Ahmed I, Greenwood R, Costello BDL, Ratcliffe NM, Probert CS. An Investigation of Fecal Volatile Organic Metabolites in Irritable Bowel Syndrome. PLoS One. 2013;8:e58204. doi:10.1371/journal.pone.0058204.
- Garner CE, Smith S, De Lacy Costello B, White P, Spencer R, Probert CSJ, Ratcliffe NM. Volatile organic compounds from feces and their potential for diagnosis of gastrointestinal disease. FASEB J. 2007;21:1675–1688. doi:10.1096/fj.06-6927com.
- Taylor H, Serrano-Contreras JI, McDonald JAK, Epstein J, Fell JM, Seoane RC, Li JV, Marchesi JR, Hart AL. Multiomic features associated with mucosal healing and inflammation in paediatric Crohn’s disease. Aliment Pharmacol Ther. 2020;52:1491–1502. doi:10.1111/apt.16086.
- Frau A, Kenny JG, Lenzi L, Campbell BJ, Ijaz UZ, Duckworth CA, Burkitt MD, Hall N, Anson J, Darby AC, et al. DNA extraction and amplicon production strategies deeply inf luence the outcome of gut mycobiome studies. Sci Rep. 2019;9:9328. doi:10.1038/s41598-019-44974-x.
- Rohart F, Gautier B, Singh A, Lê Cao K-A. mixOmics: an R package for ‘omics feature selection and multiple data integration. PLOS Comput Biol. 2017;13:e1005752. doi:10.1371/journal.pcbi.1005752.
- Tedjo DI, Smolinska A, Savelkoul PH, Masclee AA, Van Schooten FJ, Pierik MJ, Penders J, Jonkers DMAE. The fecal microbiota as a biomarker for disease activity in Crohn’s disease. Sci Rep. 2016;6:1–10. doi:10.1038/srep35216.
- Oksanen J, Blanchet FG, Friendly M, Kindt R, Legendre P, McGlinn D, Minchin PR, O'Hara RB, Simpson GL, Solymos P, et al. Vegan: community ecology package. 2020.
- Clarke KR, Warwick R. An approach to statistical analysis and interpretation. Chang Mar Communities. 1994;2:117–143.
- Ijaz UZ, Sivaloganathan L, McKenna A, Richmond A, Kelly C, Linton M, Stratakos AC, Lavery U, Elmi A, Wren BW, et al. Comprehensive longitudinal microbiome analysis of the chicken cecum reveals a shift from competitive to environmental drivers and a window of opportunity for campylobacter. Front Microbiol. 2018;9:2452. doi:10.3389/fmicb.2018.02452.
- Metabocard for 3,7-Dimethyl-1,6-octadien-3-ol (HMDB0036100) [Internet]. [cited 2020 May 5]; Available from: https://hmdb.ca/metabolites/HMDB0036100
- Drawert F, Barton H. Biosynthesis of flavor compounds by microorganisms. 3. production of monoterpenes by the yeast Kluyveromyces lactis. J Agric Food Chem. 1978;26:765–766. doi:10.1021/jf60217a029.
- Korpi A, Järnberg J, Pasanen A-L. Microbial volatile organic compounds. Crit Rev Toxicol. 2009;39:139–193. doi:10.1080/10408440802291497.
- D’Amore R, Ijaz UZ, Schirmer M, Kenny JG, Gregory R, Darby AC, Shakya M, Podar M, Quince C, Hall N. A comprehensive benchmarking study of protocols and sequencing platforms for 16S rRNA community profiling. BMC Genomics. 2016;17:1–20. doi:10.1186/s12864-015-2194-9.
- Reade S, Mayor A, Aggio R, Khalid T, Pritchard D, Ewer A, Probert C. Optimisation of sample preparation for direct SPME-GC-MS analysis of murine and human faecal volatile organic compounds for metabolomic studies. J Anal Bioanal Tech. 2014;5:2.
- Nash AK, Auchtung TA, Wong MC, Smith DP, Gesell JR, Ross MC, Stewart CJ, Metcalf GA, Muzny DM, Gibbs RA, et al. The gut mycobiome of the human microbiome project healthy cohort. Microbiome. 2017;5:153. doi:10.1186/s40168-017-0373-4.
- Auchtung TA, Fofanova TY, Stewart CJ, Nash AK, Wong MC, Gesell JR, Auchtung JM, Ajami NJ, Petrosino JF. Investigating colonization of the healthy adult gastrointestinal tract by fungi. mSphere. 2018;3:1–16. doi:10.1128/mSphere.00092-18.
- Chiaro TR, Soto R, Zac Stephens W, Kubinak JL, Petersen C, Gogokhia L, Bell R, Delgado JC, Cox J, Voth W, et al. A member of the gut mycobiota modulates host purine metabolism exacerbating colitis in mice. Sci Transl Med. 2017;9:9. doi:10.1126/scitranslmed.aaf9044.
- Sendid B, Jawhara S, Sarter H, Maboudou P, Thierny C, Gower-Rousseau C, Colombel JF, Poulain D. Uric acid levels are independent of anti-saccharomyces cerevisiae antibodies (ASCA) in crohn’s disease: a reappraisal of the role of S cerevisiae in this setting. Virulence. 2018;9:1224–1229.
- Charlet R, Bortolus C, Sendid B, Jawhara S. Bacteroides thetaiotaomicron and Lactobacillus johnsonii modulate intestinal inflammation and eliminate fungi via enzymatic hydrolysis of the fungal cell wall. Sci Rep. 2020;10:1–13. doi:10.1038/s41598-020-68214-9.
- Bajaj JS, Liu EJ, Kheradman R, Fagan A, Heuman DM, White M, Gavis EA, Hylemon P, Sikaroodi M, Gillevet PM. Fungal dysbiosis in cirrhosis. Gut. 2017;67:1146–1154. doi:10.1136/gutjnl-2016-313170.
- Suhr MJ, Banjara N, Hallen-Adams HE. Sequence-based methods for detecting and evaluating the human gut mycobiome. Lett Appl Microbiol. 2016;62:209–215. doi:10.1111/lam.12539.
- Suhr MJ, Hallen-Adams HE. The human gut mycobiome: pitfalls and potentials–a mycologists perspective. Mycologia. 2015;107:1057–1073. doi:10.3852/15-147.
- Dave M, Purohit T, Razonable R, Loftus EV. Opportunistic infections due to inflammatory bowel disease therapy. Inflamm Bowel Dis. 2014;20:196–212. doi:10.1097/MIB.0b013e3182a827d2.
- Pascal V, Pozuelo M, Borruel N, Casellas F, Campos D, Santiago A, Martinez X, Varela E, Sarrabayrouse G, Machiels K, et al. A microbial signature for Crohn’s disease. Gut. 2017;66:813–822. doi:10.1136/gutjnl-2016-313235.
- Nishino K, Nishida A, Inoue R, Kawada Y, Ohno M, Sakai S, Inatomi O, Bamba S, Sugimoto M, Kawahara M, et al. Analysis of endoscopic brush samples identified mucosa-associated dysbiosis in inflammatory bowel disease. J Gastroenterol. 2018;53:95–106. doi:10.1007/s00535-017-1384-4.
- Falony G, Joossens M, Vieira-Silva S, Wang J, Darzi Y, Faust K, Kurilshikov A, Bonder MJ, Valles-Colomer M, Vandeputte D, et al. Population-level analysis of gut microbiome variation. Science. 2016;352:560–564. doi:10.1126/science.aad3503.
- Maier L, Pruteanu M, Kuhn M, Zeller G, Telzerow A, Anderson EE, Brochado AR, Fernandez KC, Dose H, Mori H, et al. Extensive impact of non-antibiotic drugs on human gut bacteria. Nature. 2018;555:623–628. doi:10.1038/nature25979.
- Dahl J-U, Gray MJ, Bazopoulou D, Beaufay F, Lempart J, Koenigsknecht MJ, Wang Y, Baker JR, Hasler WL, Young VB, et al. The anti-inflammatory drug mesalamine targets bacterial polyphosphate accumulation. Nat Microbiol. 2017;2:16267. doi:10.1038/nmicrobiol.2016.267.
- Raymond F, Ouameur AA, Déraspe M, Iqbal N, Gingras H, Dridi B, Leprohon P, Plante PL, Giroux R, Bérubé È, et al. The initial state of the human gut microbiome determines its reshaping by antibiotics. ISME J. 2016;10:707–720. doi:10.1038/ismej.2015.148.
- Le Chatelier E, Nielsen T, Qin J, Prifti E, Hildebrand F, Falony G, Almeida M, Arumugam M, Batto JM, Kennedy S, et al. Richness of human gut microbiome correlates with metabolic markers. Nature. 2013;500:541–546. doi:10.1038/nature12506.
- Hoffmann TW, Pham HP, Bridonneau C, Aubry C, Lamas B, Martin-Gallausiaux C, Moroldo M, Rainteau D, Lapaque N, Six A, et al. Microorganisms linked to inflammatory bowel disease-associated dysbiosis differentially impact host physiology in gnotobiotic mice. ISME J. 2016;10:460–477. doi:10.1038/ismej.2015.127.
- Wrzosek L, Miquel S, Noordine M-L, Bouet S, Chevalier-Curt MJ, Robert V, Philippe C, Bridonneau C, Cherbuy C, Robbe-Masselot C, et al. Bacteroides thetaiotaomicron and Faecalibacterium prausnitzii influence the production of mucus glycans and the development of goblet cells in the colonic epithelium of a gnotobiotic model rodent. BMC Biol. 2013;11:1–13. doi:10.1186/1741-7007-11-61.
- Edwards LA, Lucas M, Edwards EA, Torrente F, Heuschkel RB, Klein NJ, Murch SH, Bajaj-Elliott M, Phillips AD. Aberrant response to commensal Bacteroides thetaiotaomicron in Crohn’s disease: an ex vivo human organ culture study. Inflamm Bowel Dis. 2011;17:1201–1208. doi:10.1002/ibd.21501.
- Hansen JJ, Huang Y, Peterson DA, Goeser L, Fan TJ, Chang EB, Sartor RB. The colitis-associated transcriptional profile of commensal Bacteroides thetaiotaomicron enhances adaptive immune responses to a bacterial antigen. PLoS One. 2012;7:1–10. doi:10.1371/journal.pone.0042645.
- Bloom SM, Bijanki VN, Nava GM, Sun L, Malvin NP, Donermeyer DL, Dunne WM, Allen PM, Stappenbeck TS. Commensal Bacteroides species induce colitis in host-genotype-specific fashion in a mouse model of inflammatory bowel disease. Cell Host Microbe. 2011;9:390–403. doi:10.1016/j.chom.2011.04.009.
- Rigottier-gois L. Dysbiosis in inflammatory bowel diseases : the oxygen hypothesis. ISME J. 2013;7:1256–1261. doi:10.1038/ismej.2013.80.
- Henson MA, Phalak P. Microbiota dysbiosis in inflammatory bowel diseases: in silico investigation of the oxygen hypothesis. BMC Syst Biol. 2017;11:1–15. doi:10.1186/s12918-017-0522-1.
- Kelly CJ, Zheng L, Campbell EL, Saeedi B, Scholz CC, Bayless AJ, Wilson KE, Glover LE, Kominsky DJ, Magnuson A, et al. Crosstalk between microbiota-derived short-chain fatty acids and intestinal epithelial HIF augments tissue barrier function. Cell Host Microbe. 2015;17:662–671. doi:10.1016/j.chom.2015.03.005.
- Ramanan D, Tang MS, Bowcutt R, Loke P, Cadwell K. Bacterial sensor Nod2 prevents inflammation of the small intestine by restricting the expansion of the commensal Bacteroides vulgatus. Immunity. 2014;41:311–324. doi:10.1016/j.immuni.2014.06.015.
- Schirmer M, Franzosa EA, Lloyd-Price J, McIver LJ, Schwager R, Poon TW, Ananthakrishnan AN, Andrews E, Barron G, Lake K, et al. Dynamics of metatranscription in the inflammatory bowel disease gut microbiome. Nat Microbiol. 2018;3:337–346. doi:10.1038/s41564-017-0089-z.
- Quince C, Ijaz UZ, Loman N, Eren AM, Saulnier D, Russell J, Haig SJ, Calus ST, Quick J, Barclay A, et al. Extensive modulation of the fecal metagenome in children with Crohn’s disease during exclusive enteral nutrition. Am J Gastroenterol. 2015;110:1718–1729. doi:10.1038/ajg.2015.357.
- Wishart DS, Tzur D, Knox C, Eisner R, Guo AC, Young N, Cheng D, Jewell K, Arndt D, Sawhney S, et al. HMDB: the human metabolome database. Nucleic Acids Res. 2007;35:D521–6. doi:10.1093/nar/gkl923.
- Reade S, Williams JM, Aggio R, Duckworth CA, Mahalhal A, Hough R, Pritchard DM, Probert CS. Potential role of fecal volatile organic compounds as biomarkers of chemically induced intestinal inflammation in mice. FASEB J. 2019;33:3129–3136. doi:10.1096/fj.201800076RR.
- Fritz KS, Petersen DR. An overview of the chemistry and biology of reactive aldehydes. Free Radic Biol Med. 2013;59:85–91. doi:10.1016/j.freeradbiomed.2012.06.025.
- Walton C, Fowler DP, Turner C, Jia W, Whitehead RN, Griffiths L, Dawson C, Waring RH, Ramsden DB, Cole JA, et al. Analysis of volatile organic compounds of bacterial origin in chronic gastrointestinal diseases. Inflamm Bowel Dis. 2013;19:2069–2078. doi:10.1097/MIB.0b013e31829a91f6.
- Walton C, Montoya MPB, Fowler DP, Turner C, Jia W, Whitehead RN, Grif L, Waring RH, Ramsden DB, Cole JA, et al. Enteral feeding reduces metabolic activity of the intestinal microbiome in Crohn’s disease: an observational study. Eur J Clin Nutr. 2016;70:1052–1056. doi:10.1038/ejcn.2016.74.
- Smith EA, Macfarlane GT. Formation of phenolic and indolic compounds by anaerobic bacteria in the human large intestine. Microb Ecol. 1997;33:180–188. doi:10.1007/s002489900020.
- Smith EA, Macfarlane GT. Dissimilatory amino acid metabolism in human colonic bacteria. Anaerobe. 1997;3:327–337. doi:10.1006/anae.1997.0121.
- Marchesi JR, Holmes E, Khan F, Kochhar S, Scanlan P, Shanahan F, Wilson ID, Wang Y. Rapid and noninvasive metabonomic characterization of inflammatory bowel disease. J Proteome Res. 2007;6:546–551. doi:10.1021/pr060470d.
- Hazelwood LA, Daran JM, Van Maris AJA, Pronk JT, Dickinson JR. The ehrlich pathway for fusel alcohol production: a century of research on Saccharomyces cerevisiae metabolism. Appl Environ Microbiol. 2008;74:2259–2266. doi:10.1128/AEM.02625-07.
- Heddergott C, Calvo AM, Latgé JP. The volatome of Aspergillus fumigatus. Eukaryot Cell. 2014;13:1014–1025. doi:10.1128/EC.00074-14.
- Bhandari S, Chambers S, Pearson J, Syhre M, Epton M, Scott-Thomas A. Determining the limits and confounders for the 2-pentyl furan breath test by gas chromatography/mass spectrometry. J Chromatogr B. 2011;879:2815–2820. doi:10.1016/j.jchromb.2011.08.010.
- Sørensen LM, Gori K, Petersen MA, Jespersen L, Arneborg N. Flavour compound production by Yarrowia lipolytica, Saccharomyces cerevisiae and Debaryomyces hansenii in a cheese-surface model. Int Dairy J. 2011;21:970–978. doi:10.1016/j.idairyj.2011.06.005.
- Raimondi S, Amaretti A, Gozzoli C, Simone M, Righini L, Candeliere F, Brun P, Ardizzoni A, Colombari B, Paulone S, et al. Longitudinal survey of fungi in the human gut: ITS profiling, phenotyping, and colonization. Front Microbiol. 2019;10:1575. doi:10.3389/fmicb.2019.01575.
- Imhann F, Bonder MJ, Vila AV, Fu J, Mujagic Z, Vork L, Tigchelaar EF, Jankipersadsing SA, Cenit MC, Harmsen HJM, et al. Proton pump inhibitors affect the gut microbiome. Gut. 2016;65:740–748. doi:10.1136/gutjnl-2015-310376.
- Wilson ID, Nicholson JK. Gut microbiome interactions with drug metabolism, efficacy, and toxicity. Transl Res. 2017;179:204–222. doi:10.1016/j.trsl.2016.08.002.
- Van Den Heuvel TR, Jonkers DM, Jeuring SF, Romberg-Camps MJ, Oostenbrug LE, Zeegers MP, Masclee AA, Pierik MJ. Cohort profile: the inflammatory bowel disease south limburg cohort (IBDSL). Int J Epidemiol. 2015;46:e7–e7. doi:10.1093/ije/dyv088.
- Xia J, Sinelnikov IV, Han B, Wishart DS. MetaboAnalyst 3.0—making metabolomics more meaningful. Nucleic Acids Res. 2015;43:W251–7. doi:10.1093/nar/gkv380.