
 ?Mathematical formulae have been encoded as MathML and are displayed in this HTML version using MathJax in order to improve their display. Uncheck the box to turn MathJax off. This feature requires Javascript. Click on a formula to zoom.
Abstract
Tyrosine kinase 2 (TYK2) is a Janus kinase (JAK) that is crucially involved in inflammation, carcinogenesis and defense against infection. The cytotoxic activity of natural killer (NK) cells in TYK2-deficient (Tyk2−/−) mice is severely reduced, although the underlying mechanisms are largely unknown. Using Tyk2−/− mice and mice expressing a kinase-inactive version of TYK2 (Tyk2K923E), we show that NK cell function is partly independent of the enzymatic activity of TYK2. Tyk2−/− and Tyk2K923E NK cells develop normally in the bone marrow, but the maturation of splenic Tyk2−/− NK cells (and to a lesser extent of Tyk2K923E NK cells) is impaired. In contrast, the production of interferon γ (IFNγ) in response to interleukin 12 (IL-12) or to stimulation through NK cell-activating receptors strictly depends on the presence of enzymatically active TYK2. The cytotoxic activity of Tyk2K923E NK cells against a range of target cells in vitro is higher than that of Tyk2−/− NK cells. Consistently, Tyk2K923E mice control the growth of NK cell-targeted tumors significantly better than TYK2-deficient mice, showing the physiological relevance of the finding. Inhibitors of TYK2's kinase activity are being developed for the treatment of inflammatory diseases and cancers, but their effects on tumor immune surveillance have not been investigated. Our finding that TYK2 has kinase-independent functions in vivo suggests that such inhibitors will leave NK cell mediated tumor surveillance largely intact and that they will be suitable for use in cancer therapy.
Abbreviations
| CCL3 | = | chemokine (C-C motif) ligand 3 |
| CFSE | = | carboxyfluorescein diacetate succinimidyl ester |
| GzmB | = | granzyme B |
| IFN | = | interferon |
| IFNAR | = | interferon α and β receptor |
| IL | = | interleukin |
| IL-12Rβ1 | = | interleukin-12 receptor subunit β-1 |
| iNK | = | immature natural killer |
| JAK | = | xJanus kinase |
| MACS | = | magnetic-activated cell sorting |
| MFI | = | mean fluorescence intensity |
| MHC | = | major histocompatibility complex |
| miR | = | microRNA |
| mNK | = | mature natural killer |
| NK | = | natural killer |
| NKP | = | natural killer precursor |
| Prf1 | = | perforin |
| SEM | = | standard error of the mean |
| STAT | = | signal transducer and activator of transcription |
| T-ALL | = | T cell acute lymphoblastic leukemia |
| TYK2 | = | tyrosine kinase 2 |
| TYK2K923E | = | kinase-inactive tyrosine kinase 2 |
| WT | = | wild-type |
Introduction
TYK2 is a member of JAK family of receptor-associated tyrosine kinases. Upon binding of cytokines or growth factors to their receptor complexes, JAKs undergo auto- and trans-phosphorylation and phosphorylate the signal transducing receptor chain(s), which then provide docking sites for signal transducers and activators of transcription (STATs). STATs translocate to the nucleus and initiate transcription to induce ligand specific cellular responses. Activation of TYK2 occurs upon binding of several different cytokines, such as type I and type III interferons (IFNs), interleukin (IL-) 10, IL-12, IL-22, IL-23 and cytokines utilizing the gp130 receptor chain.Citation1
The most prominent immunological alterations observed in gene-targeted TYK2-deficient miceCitation2-4 and a naturally occurring TYK2 mutant mouse strainCitation5 are high susceptibility to microbial infections, resistance to several inflammatory and autoimmune diseases and impaired tumor immune surveillance.Citation1,6 Breast cancer, thymoma and colon adenocarcinoma transplants grow more progressively in Tyk2−/− mice.Citation7–9 Similarly, TYK2 deficiency results in a higher incidence of Abelson-induced leukemia, which was attributed to an impaired NK cell cytotoxicity and NK cell-mediated tumor immune surveillance.Citation10,11 Impaired NK cell functions in the absence of TYK2 are not restricted to antitumor responses but were also observed in the context of Leishmania major infections.Citation12 To date, two TYK2-deficient patients have been reported who suffer from high susceptibility to infections among other immunological defects.Citation13,14 The first TYK2 specific inhibitors have been recently developed and are considered as promising therapeutic agents for the treatment of inflammatory and autoimmune diseases.Citation15-20
Very recently, tumor cell-intrinsic TYK2 activity has been linked to the development of T cell acute lymphoblastic leukemia (T-ALL) and cutaneous T cell lymphoma development in humans.Citation21,22 Therefore, specific inhibition of TYK2 activity might be considered as a new therapeutic opportunity for some hematologic malignancies. Furthermore, invasiveness of certain types of prostate and breast cancer could be blocked by TYK2 inhibition in vitro.Citation23,24
It becomes increasingly evident that, besides their canonical function, JAKs also exert functions independent of their catalytic activity and/or cytokine receptor association. Kinase-independent functions of human TYK2 were reported for IFNAR, IL-6R and IL-10R signaling complexes.Citation25-27 In murine cells, catalytically inactive TYK2 facilitates mitochondrial respiration and mediates crosstalk from the type I IFN receptor complex to the phosphoinositide 3-kinase (PI3K) pathway.Citation28,29 Interestingly, nuclear translocation and chromatin association of TYK2 has been reported, however, the significance of this observation remains to be elucidated.Citation30 Thus, before blocking TYK2 in therapy it is of great importance to assess its kinase-independent functions in vivo.
Using gene-targeted mice that harbor a point mutation in the ATP-binding pocket of the TYK2 kinase domain (Tyk2K923E) we have recently reported that TYK2 kinase activity is essential for type I IFN signaling as well as antiviral responses in vivo.Citation31 In this study, we further investigated the role of TYK2 in NK cells and tumor immune surveillance and present the first evidence for kinase-independent functions of TYK2 in vivo.
Results
NK cells in the bone marrow develop normally in the absence of TYK2 or in the presence of kinase-inactive TYK2
NK cells develop in the bone marrow before migrating to the periphery where they undergo full maturation. Citation32 They develop from NK precursors (NKPs: Lin−CD122+NK1.1−DX5−) via immature NK cells (iNK: Lin−CD122+NK1.1+DX5−) into mature NK cells (mNKs: Lin−CD122+NK1.1+DX5+). We found similar frequencies of total NK cells (Lin−CD122+) () and of all three developmental stages in the bone marrow of WT, Tyk2K923E and Tyk2−/− mice ().
Figure 1. NK cell maturation is impaired in Tyk2−/− but partially restored in Tyk2K923E mice. (A) Frequency of all NK cells in bone marrow (Lin−CD122+) was assessed by flow cytometry. (B) Total NK cells were divided into subpopulations of three developmental stages: NK precursor (NKP), immature (iNK) and mature (mNK) NK cells. Percentages of NKPs (DX5−NK1.1−), iNKs (DX5−NK1.1+) and mNKs (DX5+NK1.1+) among the Lin−CD122+ population in bone marrow obtained from WT, Tyk2K923E and Tyk2−/− mice are shown. (C) Percentages of NK cells in the spleen were assessed by flow cytometry. (D) Splenic CD3ε−NK1.1+ cells were analyzed for the expression of maturation markers CD27 and CD11b. Percentage of NK cells in each of the four maturation stages: CD27−CD11b−, CD27+CD11b−, CD27+CD11b+ and CD27−CD11b+ is shown. (E, F) The abundance of KLRG1+ cells among CD3ε−NK1.1+ population and the level of KLRG1 expression (MFI) were assessed in the spleen of WT, Tyk2K923E and Tyk2−/− mice. (G) Percentage of NK cells (CD3ε−TCRβ−NKp46+) among liver lymphocytes was assessed by flow cytometry. (H) Liver NK cells were divided into two subpopulations: liver resident NK cells (CD49a+) and conventional NK cells (CD49b+) and the total number of each population is presented. (A, C, E, F, G) Boxplots with whiskers from minimum to maximum show data derived from two (A, E, F, n = 6–8 per genotype) or three (C, G, n = 10 per genotype) independent experiments. (B, D, H) Mean ± SEM of two independent experiments is presented (n = 6–7 per genotype). (A–H) * P < 0.05, **P < 0.01, *** P < 0.001.
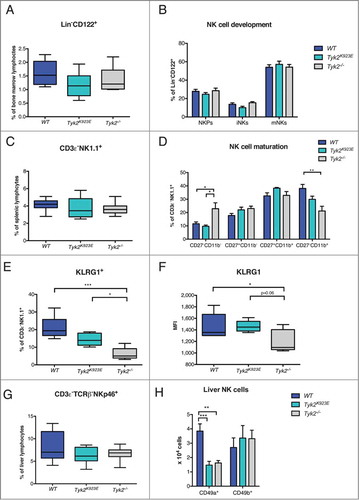
NK cell maturation depends on the presence of TYK2 and is partially restored by kinase-inactive TYK2
Next, we analyzed the frequency and maturation of splenic NK cells. The percentage of CD3ε−NK1.1+ NK cells was not differing from the WT () but their maturation was severely impaired in TYK2-deficient mice (). Compared to WT, NK cells from Tyk2−/− mice showed a lower percentage of the most mature (CD27−CD11b+) and a higher percentage of the least mature (CD27−CD11b−) NK cell population (). Surprisingly, this defect was partially restored in NK cells expressing TYK2K923E (). In line with this, we found an intermediate abundance of NK cells positive for the late maturation marker KLRG1 in Tyk2K923E between WT and Tyk2−/− NK cells (). Although less pronounced, this also applied for the expression levels of KLRG1 (). These results establish a novel function of TYK2 in driving NK cell maturation, which is partially independent of its kinase activity.
Liver NK cell development depends on TYK2 kinase activity
Liver-resident NK cells develop from a distinct lineage than conventional NK cells which are found in the spleen and circulate around the body.Citation33 Liver-resident and conventional NK cells are distinguished by their exclusive expression of CD49a and CD49b (DX5).Citation34 The percentage of NK cells among liver lymphocytes was not affected by the absence of TYK2 or its kinase activity (). However, we observed a strong reduction in the abundance of liver-resident NK cells (CD3ε−TCRβ−NKp46+CD49a+) in Tyk2K923E and Tyk2−/− mice, whereas the number of conventional NK cells was similar in all three genotypes (CD3ε−TCRβ−NKp46+CD49b+) ().
NK cell receptor expression is differentially affected by the absence of TYK2 or the presence of kinase-inactive TYK2
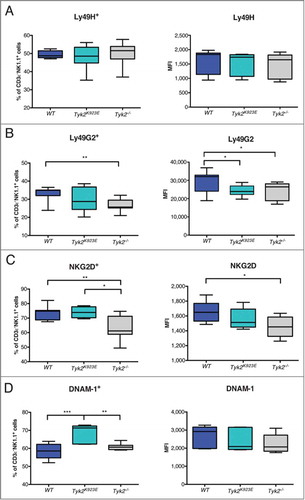
NK cell activity is controlled by the integration of signals derived from activating and inhibitory receptors.Citation35 We did not detect any differences in the expression of the activating receptor Ly49H () and NKp46 (Fig. S1A) but we found fewer Tyk2−/− than WT NK cells that express the inhibitory receptor Ly49G2 () and the activating receptor NKG2D (). In contrast, Tyk2K923E NK cells showed similar frequencies of Ly49G2+ and NKG2D+ cells as WT NK cells, although expression levels were slightly reduced (). Surprisingly, the abundance of DNAM-1+ NK cells was even higher in Tyk2K923E than in WT mice, although the absence of TYK2 did not have any effect (). Thus, expression of TYK2K923E not only restores some of the defects of Tyk2−/− but also has consequences that differ from both, WT and Tyk2−/− NK cells.
Figure 2. NK cells expressing NKG2D and DNAM-1 are more abundant in Tyk2K923E than in Tyk2−/− mice. Frequency of splenic NK cells expressing activating or inhibitory receptors and level of surface expression of these receptors (MFI) was assessed by flow cytometry. Boxplots with whiskers from minimum to maximum show percentage (left panel) and MFI (right panel) of CD3ε−NK1.1+ cells positive for receptors (A) Ly49H, (B) Ly49G2, (C) NKG2D and (D) DNAM-1. Data are derived from three (A, B, n = 10 per genotype) or two (C, D, n = 6−8 per genotype) independent experiments. (A-D) * P < 0.05, ** P < 0.01, *** P < 0.001.
Absence of TYK2 and presence of kinase-inactive TYK2 have distinct effects on the expression of miRNAs and mRNAs but not on the abundance of cytolytic proteins
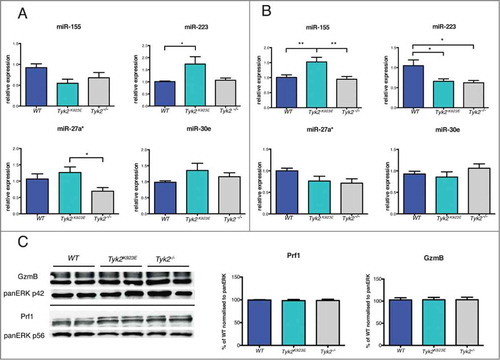
As it becomes increasingly evident that miRNAs regulate NK cell activity,Citation36 we determined the expression levels of selected miRNAs in WT, Tyk2K923E and Tyk2−/− cells. In general, the differences were rather subtle and the miRNA expression patterns differed between naive () and IL-2-activated NK cells (). miR-155 expression was not significantly different in NK cells ex vivo () but it was increased in IL-2-expanded Tyk2K923E NK cells (). miR-233 was increased in Tyk2K923E NK cells ex vivo () but decreased in Tyk2K923E and Tyk2−/− expanded NK cells (). miR-27a* showed reduced expression only in the absence of TYK2 in ex vivo NK cells, whereas we did not detect differences in miR-30e expression ().
Figure 3. miRNAs but not cytolytic proteins show differential expression patterns between WT, Tyk2K923E and Tyk2−/− NK cells. DX5+ cells were MACS-purified from spleens of WT, Tyk2K923E and Tyk2−/− mice and (A) directly used for RNA analysis or (B, C) expanded for 7 d with IL-2. (A, B) Expression levels of miR-155, miR-223, miR-27a* and miR-30e were analyzed using RT-qPCR. Mean ± SEM of two (A, n = 6−8 per genotype) or three (B, n = 9−11 per genotype) independent experiments is presented (*P < 0.05, ** P < 0.01, *** P < 0.001). (C) Protein levels of GzmB and Prf1 were analyzed by Western blot and quantified using ImageJ software. One representative blot and the mean values ± SEM of the quantifications (normalized to WT cells) derived from two independent experiments are shown (n = 4 per genotype).
We next analyzed the transcriptome of IL-2-expanded WT, Tyk2K923E and Tyk2−/− NK cells using microarray technology. We found very few differences between the genotypes: 27 transcripts were differentially expressed between Tyk2−/− and WT or Tyk2K923E and WT cells (≥ 2-fold change, P ≤ 0.05; Table S1). Among these transcripts, 11 differed at least 2-fold (P ≤ 0.05) between Tyk2−/− and Tyk2K923E NK cells (Table S1). Hierarchical cluster analysis of all genes (Fig. S2) confirmed that Tyk2K923E differ from both Tyk2−/− and WT NK cells.
IL-2 expansion of NK cells leads to a post-transcriptional upregulation of the cytolytic proteins granzyme B (GzmB) and perforin (Prf1).Citation37 Neither the absence of TYK2 nor the presence of TYK2K923E had an effect on the expression of GzmB and Prf1 ().
IFNγ production is dependent on TYK2 kinase activity
IFNγ is one of the main NK cell effector molecules.Citation38 Consistent with previous reports,Citation10,12 we found strongly reduced STAT3 and STAT4 activation and impaired production of IFNγ in the absence of TYK2 in response to IL-12 (). TYK2 is not acting as a receptor scaffolding protein as we found similar surface expression of IL-12 receptor β1 (IL-12Rβ1) in all three genotypes (Fig. S1D). JAK2 phosphorylation was strongly decreased in IL-12 stimulated Tyk2K923E and Tyk2−/− cells (), suggesting that the presence of enzymatically active TYK2 is required for full activation of JAK2.
Figure 4. IFNγ production by NK cells is dependent on TYK2 kinase activity. (A) DX5+ cells were MACS-purified from spleens of WT, Tyk2K923E and Tyk2−/− mice, expanded for 7 d with IL-2, stimulated with IL-12 for indicated time points or left untreated (w/o) and further analyzed for activation of STATs and JAK2 and for IFNγ production. Levels of pSTAT3, pSTAT4 and pJAK2 were assessed by Western blot and a representative blot out of two independent experiments is shown (left panel). The production of IFNγ by NK cells was assessed by ELISA (right panel) and mean ± SEM is presented from three independent experiments (n = 3 per genotype per treatment). (B) WT, Tyk2K923E and Tyk2−/− splenocytes were stimulated with anti-NK1.1 antibody for 5 h. Intracellular IFNγ levels were assessed by flow cytometry and the percentage of IFNγ+ cells within the CD3ε−DX5+ population (left panel) or level of IFNγ expression (MFI, right panel) is shown as boxplots with whiskers from minimum to maximum from three independent experiments (n = 6−8 per genotype). (C) WT, Tyk2K923E and Tyk2−/− splenocytes were stimulated with anti-NK1.1 antibody for 8 h. Intracellular CCL3 levels were assessed by flow cytometry and the percentage of CCL3+ cells within the CD3ε−DX5+ population (left panel) or level of CCL3 expression (MFI, right panel) is shown as boxplots with whiskers from minimum to maximum from two independent experiments (n = 4 per genotype). (A, B, C) *P < 0.05, **P < 0.01, ***P < 0.001.
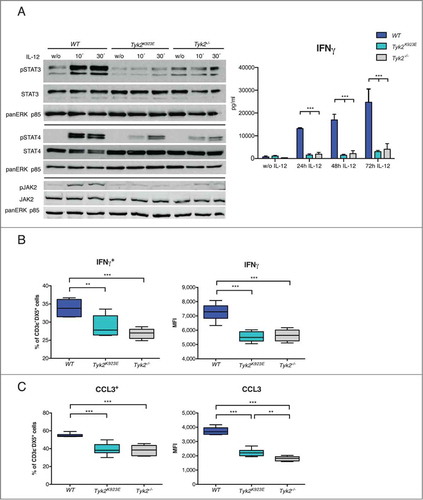
Surprisingly, also NK1.1 and Ly49D receptor stimulation induced considerably lower IFNγ production in Tyk2K923E and Tyk2−/− NK cells ( and Fig. S3A). It is important to note that NK1.1 and Ly49D receptor expression was not different between WT, Tyk2K923E and Tyk2−/− NK cells (Fig. S1B and C). Thus, the requirement for kinase-active TYK2 for IFNγ production extends to NK cell receptor activation and is not limited to its function in the IL-12 signaling cascade.
To assess if Tyk2K923E and Tyk2−/− NK cells show generally impaired responses to receptor stimulation we analyzed the production of CCL3.Citation39 The percentage of CCL3+ cells after anti-NK1.1 antibody cross-linking was similarly reduced in Tyk2K923E and Tyk2−/− NK cells ( left panel). However, Tyk2K923E showed slightly higher expression levels than Tyk2−/− cells ( right panel), indicating that kinase-inactive TYK2 can partially mediate NK cell receptor responses. An intermediate CCL3 expression level in Tyk2K923E between WT and Tyk2−/− cells was also observed after cross-linking with anti-Ly49D antibody (Fig. S3B).
Kinase-inactive TYK2 partially restores cytotoxic capacity of NK cells
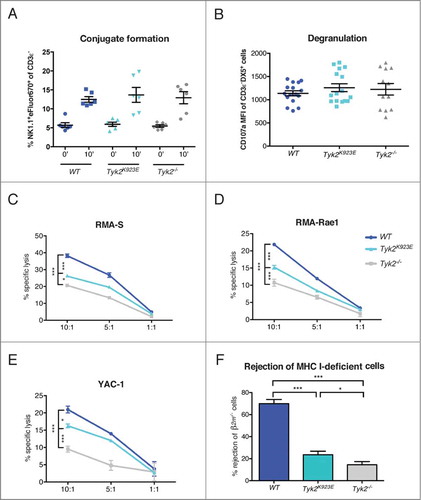
To further investigate how TYK2 and its kinase activity influence effector functions of NK cells, we assessed the ability of NK cells to form conjugates with target cells and to lyse them. We did not observe any differences in the formation of conjugates with YAC-1 target cells between WT, Tyk2K923E and Tyk2−/− NK cells (). Similarly, expression of the degranulation marker CD107a following NK1.1 or Ly49D receptor stimulation was not influenced by the absence of TYK2 or the presence of TYK2K923E ( and Fig. S3C). In line with previous studies,Citation11 cytotoxicity of NK cells against a range of target cells in vitro was severely impaired in the absence of TYK2 (). However, Tyk2K923E NK cells were able to lyse RMA-S, RMA-Rae1 and YAC-1 cells more efficiently than Tyk2−/−, albeit not to the level reached by WT cells (). To determine cytotoxic activity in an in vivo setting, we intravenously injected cells that are deficient for MHC class I molecules (β2m−/− splenocytes) into WT, Tyk2−/− and Tyk2K923E mice and determined their rejection. Consistent with our in vitro assays, Tyk2K923E mice killed β2m−/− cells significantly better than Tyk2−/− mice (). However, the difference between Tyk2K923E and Tyk2−/− mice appeared less pronounced than in vitro, suggesting that the cytotoxic capacity of Tyk2K923E NK cells may depend on the type of target cell and/or environmental factors.
Figure 5. Kinase-inactive TYK2 partially restores cytotoxic capacity of NK cells. (A) DX5+ cells were MACS-purified from spleens of WT, Tyk2K923E and Tyk2−/− mice expanded for 5–7 d with IL-2 and mixed at a 1:1 ratio with YAC-1 cells stained with eFluor®670. The graph shows the percentage of duplets (NK1.1+eFluor®670+) among the CD3ε− population after 0 or 10 min incubation at 37°C. (B) Splenocytes of WT, Tyk2K923E and Tyk2−/− mice were stimulated with anti-NK1.1 antibody for 4 h in the presence of CD107a antibody. The graph shows the induction of CD107a (MFI anti-NK1.1 stimulated minus MFI unstimulated) in the CD3ε−DX5+population. (A, B) Mean ± SEM of three (A, n = 6 per genotype) or four (B, n = 12 per genotype) independent experiments is presented. (C, D, E) DX5+ cells MACS-purified from spleens of WT, Tyk2K923E and Tyk2−/− mice, expanded for 7 d with IL-2 were mixed at indicated effector : target ratios (10:1, 5:1, 1:1) with CFSE stained target cells for 4 h. The specific lysis of target cells was assessed by flow cytometry. One representative out of at least two independent experiments is shown for (C) RMA-S and (E) YAC-1 target cells; (D) RMA-Rae1 were used as targets in one experiment. (F) WT and β2m−/− splenocytes were stained with CFSElow and CFSEhigh concentration, respectively, mixed 1:1 and injected i.v. into recipient WT, Tyk2K923E and Tyk2−/− mice. After 16 h splenocytes from recipients were analyzed by flow cytometry. Percentage of rejected β2m−/− cells is shown as mean ± SEM of four independent experiments (n = 10−12 per genotype). (A–F) * P < 0.05, ** P < 0.01, *** P < 0.001
Kinase-inactive TYK2 mediates NK cell-dependent tumor surveillance
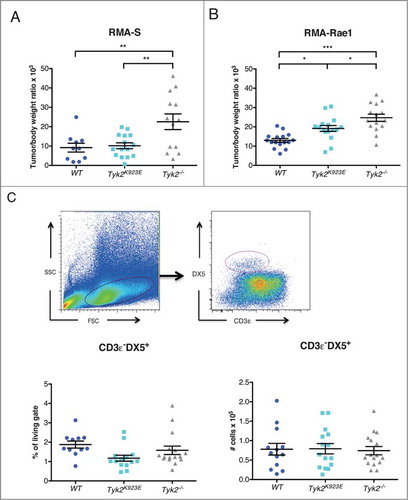
We next tested whether Tyk2K923E NK cells are able to mediate tumor surveillance in vivo using two different NK cell-targeted tumor transplant models. Tyk2K923E mice controlled the growth of RMA-S tumors similarly well as WT mice, whereas Tyk2−/− mice developed significantly bigger tumors (). RMA-Rae1 tumors were again better controlled in Tyk2K923E than in Tyk2−/− mice, although not as efficiently as in WT mice (). Differences in tumor surveillance may also be due to differences in migratory or proliferative capacity of NK cells, and thus we determined the number of infiltrating NK cells in RMA-Rae1 tumors. We found similar amounts of tumor-infiltrating NK cells in Tyk2−/− and Tyk2K923E mice, with respect to both the percentage (, left panel) and the absolute numbers (, right panel).
Figure 6. Mice expressing kinase-inactive TYK2 show improved tumor growth control compared to TYK2-deficient mice. (A) 10Citation6 RMA-S or (B) 10Citation6 RMA-Rae1 cells were injected s.c. into the right and left flank of WT, Tyk2K923E and Tyk2−/− mice and tumor growth was monitored for 15 or 11 d, respectively. Relative tumor weight is depicted for individual tumors; horizontal lines represent mean values ± SEM from two independent experiments (n = 10−16 per genotype). (C) Tumor infiltrating NK cells were analyzed in RMA-Rae1 tumors by flow cytometry using presented gating strategy (upper panel). The graphs show percentage (left panel) and total amount (right panel) of NK cells. Mean ± SEM of two independent experiments is presented (n = 14−16 per genotype). (A–C) * P < 0.05, ** P < 0.01, *** P < 0.001.
Taken together, our results clearly show that kinase-independent functions of TYK2 in NK cells are of physiological relevance.
Discussion
In this study we uncovered a key contribution of kinase-inactive TYK2 to NK cell-dependent tumor surveillance, thereby providing the first evidence for kinase-independent functions of TYK2 in vivo.
Previously we have shown that Tyk2−/− mice develop B lymphoid tumors with shorter latency and higher incidence than WT mice. This phenotype was attributable to decreased NK cell cytotoxicity and tumor surveillance, although the underlying mechanisms remained unclear.Citation11 Herein we show that NK cells develop normally in the bone marrow regardless of the absence of TYK2 or presence of a kinase-inactive TYK2. Splenic NK cell maturation, however, is impaired in Tyk2−/− but partially restored in Tyk2K923E mice. The decrease in the most mature NK cell population (CD27−CD11b+) in Tyk2−/− mice is similar to what has been described in Ifnar1−/− and Stat1−/− mice,Citation40-44 indicating that TYK2 exerts these functions through its role in IFNα/β signaling. IFNα/β responses are similarly reduced in Tyk2−/− and Tyk2K923E NK cells and mice show similar sensitivity against virus infections,Citation31 arguing against an impact of TYK2K923E on canonical IFNα/β signaling. However, it does not exclude a role of TYK2K923E in mediating STAT-independent responses, such as crosstalk to other signaling cascades, not essential for antiviral activity.
We furthermore provide evidence for an involvement of TYK2 in the development of liver-resident NK cells. In contrast to the maturation of splenic NK cells, this fully depends on the presence of kinase-active TYK2. Liver-resident NK cells have just recently been discovered as an NK cell lineage distinct from conventional and other tissue resident NK cells.Citation33 It is unclear, how TYK2 impacts on their abundance in the liver. Type I IFN is likely not involved as normal numbers of liver-resident NK cells were reported in Ifnar1−/− mice.Citation42 In contrast to Tyk2K923E and Tyk2−/− mice, a dramatic decrease of total liver NK cells was found in Ifng−/− mice, but this study did not differentiate NK cell subpopulations.Citation45
With respect to NK cell function, we demonstrate that TYK2K923E partially restores cytotoxic activity of conventional NK cells against a range of different target cells. It seems likely that the role of TYK2 is linked to its role in IFNα/β signaling, as NK cells from both Ifnar1−/− and Stat1−/− mice have impaired killing activity. Citation40-42,44 Effects on the expression of the lytic proteins GzmB and Prf1 and on degranulation could be excluded as the underlying mechanisms for IFNAR1Citation40 and TYK2. Furthermore, we show that TYK2 is not required for conjugate formation of NK cells with their target cells. In line with this, GzmB and Prf1 expression were not altered in the absence of STAT1.Citation41
Similar to our earlier findings for IFNα/βCitation31, we did not observe differences between Tyk2−/− and Tyk2K923E NK cells in canonical IL-12 signaling: STAT3 and STAT4 activation and IFNγ production are severely impaired in both genotypes. We demonstrate that the requirement for TYK2 in the IL-12 signaling cascade is not due to an IL-12Rβ1 scaffolding function. Instead, TYK2 is needed for full activation of JAK2. This function was not reconstituted by TYK2K923E, suggesting that TYK2-JAK2 cross-phosphorylation amplifies IL-12 responses in a similar manner as shown for JAK1 and JAK3 at the IL-2 receptor.Citation46 However, more detailed analyses including JAK2 mutants and specific inhibitors will be needed to define the exact interplay between TYK2 and JAK2 within the IL-12 receptor complex.
Moreover, we establish that enzymatically active TYK2 is required for IFNγ production upon NK1.1 and Ly49D receptor stimulation. This is surprising, as TYK2 is not directly involved in signaling by NK cell activating receptors.Citation35 This finding cannot be correlated to a lower abundance of the most potent IFNγ producing CD27+CD11b+ NK cell population,Citation47,48 as the frequency of this population was unaffected by the loss of TYK2 or the presence of TYK2K923E. In light of a recent study with human NK cells, one may speculate that epigenetic remodeling of the Ifng locus might be dependent on kinase-active TYK2.Citation49 However, we also found reduced induction of CCL3 in Tyk2−/− and Tyk2K923E cells, indicating that TYK2 affects NK activating receptor signaling more globally.
NK cell function is also controlled by the integration of signals derived from activating and inhibitory receptors and by miRNAs.Citation35,36 We found lower expression of the NK cell activating receptor NKGD2 in Tyk2−/− NK cells. Expression of NKG2D in splenic NK cells from naïve mice is regulated in a STAT3-dependent, STAT1- and IFNAR1-independent manner,Citation40,50 suggesting a link between TYK2 and STAT3 functions. However, TYK2 deficiency did not recapitulate the increased expression of DNAM-1, GZMB and PRF1 reported in STAT3-deficient NK cells,Citation51 arguing against a general impairment of STAT3 activity in the absence of TYK2. Interestingly, expression of TYK2K923E restores NKG2D expression but results in increased expression of DNAM-1. A similar “gain-of-function” phenotype as for DNAM-1 was observed for the expression of miR-223 in naive and miR-155 in IL-2 expanded Tyk2K923E NK cells. The differences in miRNA expression patterns between ex vivo and IL-2 cultivated NK cells may be explained by autocrine/paracrine actions of cytokines during the IL-2 culture, which may depend on TYK2 and regulate miR-155 and miR-233.Citation52-54 While it has been shown that miR-233 has a redundant role in regulation of NK cell effector functions,Citation36 miR-155 overexpression results in increased IFNγ production and cytotoxicity.Citation47,52,53 Although we found IFNγ production unaffected, miR-155 upregulation might contribute to the improved killing activity of Tyk2K923E NK cells.
Partial restoration of NK cell cytotoxicity by kinase-inactive TYK2 also translates into NK cell-mediated tumor surveillance. Using two different NK cell-targeted tumor cell lines, we could show that tumor surveillance in Tyk2K923E is clearly better than in Tyk2−/− mice. NK cell infiltration was similar in WT, Tyk2K923E and Tyk2−/− mice, indicating that indeed functional differences account for the differences in tumor control. Interestingly, surveillance of RMA-S tumors even reached WT levels in Tyk2K923E mice. Tumor cell-specificity may be explained by the differential expression of NK cell receptors. For example, DNAM-1 is particularly important for NK cell-mediated killing when NKG2D ligands are not present on tumor cells.Citation55,56 Besides, tumor cell-specificity could also be due to differences in the tumor environment as other cell types, such as myeloid cells, dendritic cells or stromal fibroblasts, may crucially contribute to tumor surveillance. The slightly increased production of CCL3 by Tyk2K923E compared to Tyk2−/− NK cells may also contribute to an improved tumor surveillance, for instance by enhancing the recruitment and activation of dendritic cells. Citation57
In summary, we provide evidence that NK cell-dependent tumor surveillance does not strictly depend on the presence of kinase-active TYK2. This finding is of clinical relevance as there is growing interest in the use of TYK2 inhibitors for cancer therapy.Citation6,21,22 Nevertheless, kinase-inactive TYK2 does not fully reconstitute the WT situation and it is thus necessary to carefully consider the beneficial effects of TYK2 inhibitors versus their potential harmful effects on antitumor immunity.
Materials and methods
Mice and cell lines
Wild-type (WT) C57BL/6N mice were purchased from Charles River Laboratories or Janvier Labs. Tyk2−/− (B6N.129P2-Tyk2tm1Biat),Citation2 Tyk2K923E (B6N.129P2-Tyk2tm3(K923E)Biat)Citation31 and β2-microglobulin (β2m)−/− (B6.129-B2mtm1JaeN12,Citation58 a kind gift from Prof. Wilfried Ellmeier) animals were on C57BL/6N background, gender- and age-matched (6–12 weeks) and maintained under specific pathogen-free conditions according to FELASA recommendations (2014). All animal experiments were approved by the Ethics and Animal Welfare Committee of the University of Veterinary Medicine Vienna and granted by the national authority (Austrian Federal Ministry of Science and Research) according to Section 8ff of Law for Animal Experiments under licenses GZ-66.099/0155-II/3b/2011, BMWF-68.205/0218-II/3b/2012 and were performed according to the guidelines of FELASA and ARRIVE.
Murine lymphoma cell lines YAC-1,Citation59 RMA-SCitation60 and RMA-Rae1Citation61 were cultured in RPMI1640 complete medium: RPMI1640 supplemented with L-glutamine (PAA), 10% heat-inactivated FCS (Invitrogen), 50 µM 2-mercaptoethanol (Gibco), 100 U/mL penicillin and 100 µg/ mL streptomycin (Sigma).
Tumor transplant experiments
Right and left flanks of WT, Tyk2K923E and Tyk2−/− animals were depilated 3 to 4 d prior to tumor cell injection. 10Citation6 RMA-S or RMA-Rae1 cells were injected subcutaneously into each flank and tumor growth was monitored every other day. After 11 (RMA-Rae1) or 15 (RMA-S) d, the body and tumor weight were assessed. For flow cytometry analysis of tumor infiltrating cells, tumors were pressed twice through 100 μm cell strainers to obtain a single cell suspension.
NK cell isolation, expansion and stimulation
Spleens were isolated and single cell suspensions were prepared by pressing through 100 μm cell strainers. NK cells were isolated using DX5-labeled MACS® beads according to the manufacturer's protocol (Miltenyi Biotec) and expanded in RPMI1640 complete medium supplemented with 5,000 U/ mL recombinant human IL-2 (Proleukin®, Novartis) for 5–7 d. Purity of NK cells was assessed by flow cytometry and were routinely 85–95% CD3ε−NK1.1+ of total cells. Cultivated NK cells were further stimulated with 5 ng/ mL recombinant mouse IL-12 (R&D Systems) for the times indicated and cells were used for Western blot analysis and supernatants for ELISA. For the analysis of the expression of G zmB, Prf1 and miRNAs, cells were deprived from IL-2 for 4 h prior to cell lysis.
Antibodies and flow cytometry
Single cell suspensions were prepared from spleen, bone marrow or liver. Liver lymphocytes were isolated by liver perfusion via the portal vein with 5–10 mL sterile PBS. Separation of lymphocytes and hepatocytes was performed using 37.5% percoll (GE Healthcare). CD16/CD32 (93), CD122 (TM-β1), CD49b (DX5), NK1.1 (PK136), NKp46 (29A1.4), CD3ε (145-2C11), KLRG1 (2F1), CD27 (LG.7F9), CD11b (M1/70), Ly49H (3D10), Ly49G2 (4D11), NKG2D (CX5), DNAM-1 (10E5), IFNγ (XMG1.2), CD107a (1D4B), NKp46 (29A1.4) and CCL3 (DNT3CC) were purchased from eBioscience. Mouse lineage antibodies (CD3: 145-2C11, CD19: 1D3, Ly6-C and Ly6G: RB6-8C5, Ter-119: TER119), Ly49D (4E5), CD49a (Ha31/8), TCR-β (H57-597) and IL-12Rβ1 (114) were purchased from BD Biosciences. Analyses were performed on a BD FACSCanto II (BD Bioscience, Heidelberg, Germany) and analyzed using BD FACSDiva software V8.0.
Western blot
Cell lysis, SDS-PAGE and Western blots were performed as described previously.Citation31 For pJAK2 analysis cells were lysed directly in 1 × Laemmli sample buffer. Antibodies used were: pSTAT3 (Tyr705, CS#9131), STAT3 (CS#9132S), STAT4 (clone C46B10, CS#2653), pJAK2 (Tyr1008, D4A8, CS#8082), JAK2 (D2E12, CS#3230), GzmB (CS#4275) and Prf1 (CS#3693) all from Cell Signaling Technology; panERK (clone 16/ERK) and pSTAT4 (Tyr693, clone 38/pSTAT4) from BD Transduction Laboratories. Quantification of Western blots was done with ImageJ software.
miRNA analysis
RNA was isolated from expanded NK cells or ex vivo DX5 MACS-purified NK cells using miRNeasy Mini Kit (Qiagen). Reverse transcription was performed using miScript II RT Kit (Qiagen) according to manufacturer's instructions. Quantitative PCR was performed on Stratagene MX3000 (Agilent Technology, Boebelingen, Germany) using miScript SYBR Green PCR Kit (Qiagen). Following miScript Primer Assays (Qiagen) were used: Hs_SNORD72_1 as an internal control, Mm_miR-27a*_1, Mm_miR-155_1, Mm_miR-30e_2, Mm_miR-223_2. The qPCR was analyzed using the standard curve method as described previously.Citation62 Expression levels are shown relative to expression in WT NK cells.
Transcriptional profile analysis
RNA was isolated from expanded NK cells using peqGOLD TriFast (PEQLAB) and further purified using RNeasy Mini Kit (Qiagen) according to the manufacturers' instructions. RNA quality was determined by 2100 Bioanalyzer Instrument (Agilent Technologies, Boebelingen, Germany) and only samples with RNA integrity number (RIN) over 8,7 were used for further analysis. The transcriptional profile of WT, Tyk2K923E and Tyk2−/− NK cells in biological triplicates was determined using GeneChip microarray assay (Affymetrix Mouse Gene 2.0 ST arrays). Sample preparation for microarray hybridization was carried out as described in the Affymetrix GeneChip WT PLUS Reagent Kit User Manual (Affymetrix). Sample processing was performed at an Affymetrix Service Provider and Core Facility, “KFB – Center of Excellence for Fluorescent Bioanalytics” (Regensburg, Germany). Data analysis was performed at the Core Facility Molecular Biology at the Center for Medical Research at the Medical University of Graz (Graz, Austria). Gene expression analysis was performed with Partek Genomic Suite6.6 software (Partek Inc.). CEL. files were imported using RMA (robust multi-chip average) normalization including background correction, quantile normalization across all arrays and median polished summarization based on log2 transformed expression values. For detection of differentially expressed genes, two-way ANOVA was performed. Genes with a P value ≤ 0.05 and a fold change of at least two were considered to be deregulated. For visualization samples were assessed for batch effects and further normalized by the Partek's batch removal tool using experiment as factor. Hierarchical clustering was done using standardized normalization, Pearson's correlation as similarity measure and Ward's method as linkage criteria to identify most global differences between the three genotypes. The microarray data have been deposited in the Gene Expression Omnibus (GEO) (http://www.ncbi.nlm.nih.gov/geo/) under accession number GSE68294.
Conjugate formation
NK cells expanded for 5–7 d were stained with CD3ε and NK1.1 antibodies and YAC-1 cells were stained with Cell Proliferation Dye eFluor® 670 (eBioscience) according to the manufacturer's protocol. 2 × 10⁵ NK cells were mixed with 2 × 10⁵ YAC-1 cells in 200 μL of cold RPMI1640 complete medium and centrifuged 600 rpm for 1 min (Heraeus Multifuge 1S, Thermo Scientific). Conjugate formation was induced by incubation at 37°C for 10 min and then stopped by adding ice cold PBS or prevented by keeping cells on ice. The percentage of duplets double positive for NK1.1 and eFluor® 670 among the CD3ε− population was analyzed by flow cytometry.
NK cell IFNγ and CCL3 production
For in vitro expanded NK cells, IFNγ production was assessed in the cell culture supernatant using Mouse IFN-gamma Quantikine ELISA (R&D Systems). For ex vivo NK cells, IFNγ and CCL3 production was analyzed by flow cytometry as follows: one day prior to the experiment, tubes were coated with 10 μg/ mL of anti-NK1.1 antibody (PK136) or anti-Ly49D (4E5) and incubated overnight at 4°C. Splenocytes were seeded at 5 × 10⁶ cells/tube in 400 μL RPMI1640 complete medium. After 1 h of incubation at 37°C, brefeldin A (eBioscience) was added and cells were incubated for another 4 h for IFNγ or 7 h for CCL3. Splenocytes were stained for CD3ε and DX5 and intracellular IFNγ or CCL3 using Foxp3/Transcription Factor Staining Buffer Set according to manufacturer's instructions (eBioscience). The percentage of IFNγ+ or CCL3+ NK cells was assessed by flow cytometry.
Degranulation assay
Tubes were coated with anti-NK1.1 or anti-Ly49D antibody and splenocytes were seeded as described above. Cells were incubated for 4 h at 37°C in the presence of anti-CD107a antibody. Splenocytes were then stained for CD3ε and DX5 and the expression of CD107a on NK cells was analyzed by flow cytometry. The data are presented as a difference between CD107a mean fluorescence intensities (MFI) of anti-NK1.1/anti-Ly49D antibody stimulated and unstimulated sample.
NK cell cytotoxicity assays
In vitro NK cell cytotoxicity assays were performed as previously describedCitation40 using YAC-1, RMA-S and RMA-Rae1 as target cells. In vivo cytotoxicity assays were performed as follows: splenocytes from β2m−/− and WT mice were isolated and stained with carboxyfluorescein diacetate succinimidyl ester (CFSE) according to the manufacturer's instructions (Molecular Probes, CellTrace™ CFSE Cell Proliferation Kit) at 5 μM and 0.5 μM, respectively. β2m−/− and WT splenocytes were mixed at a 1:1 ratio and injected intravenously into recipient mice. The input sample was stored at 4°C. After 16 h, spleens of recipient mice were isolated (output samples) and the ratio of CFSEhigh/CFSElow cells was assessed by flow cytometry. The rejection of β2m−/− cells was calculated as follows:
Statistical analysis
Unpaired t-tests or one-way ANOVA with Bonferroni post tests were performed using GraphPad Prism® version 5.00 or 6.00 for Mac (GraphPad Software). The level of significance is indicated for each experiment (*P < 0.05; **P < 0.01; ***P < 0.001).
Disclosure of Potential Conflicts of Interest
No potential conflicts of interest were disclosed.
Supplemental Material
Supplemental data for this article can be accessed on the publisher's website.
Supplemental_Material.zip
Download Zip (448.6 KB)Funding
This work was supported by Austrian Science Fund (FWF) grants FWFP25642-B22 to B.S. and SFB-F28 to B.S., M.M., and V.S.
References
- Strobl B, Stoiber D, Sexl V, Mueller M. Tyrosine kinase 2 (TYK2) in cytokine signalling and host immunity. Front Biosci (Landmark Ed) 2011; 16:3214-32; PMID:21622231; http://dx.doi.org/10.2741/3908
- Karaghiosoff M, Neubauer H, Lassnig C, Kovarik P, Schindler H, Pircher H, McCoy B, Bogdan C, Decker T, Brem G et al. Partial impairment of cytokine responses in Tyk2-deficient mice. Immunity 2000; 13:549-60; PMID:11070173; http://dx.doi.org/10.1016/S1074-7613(00)00054-6
- Sheehan KC, Lai KS, Dunn GP, Bruce AT, Diamond MS, Heutel JD, Dungo-Arthur C, Carrero JA, White JM, Hertzog PJ et al. Blocking monoclonal antibodies specific for mouse IFN-alpha/beta receptor subunit 1 (IFNAR-1) from mice immunized by in vivo hydrodynamic transfection. J Interferon Cytokine Res 2006; 26:804-19; PMID:17115899; http://dx.doi.org/10.1089/jir.2006.26.804
- Shimoda K, Kato K, Aoki K, Matsuda T, Miyamoto A, Shibamori M, Yamashita M, Numata A, Takase K, Kobayashi S et al. Tyk2 plays a restricted role in IFN alpha signaling, although it is required for IL-12-mediated T cell function. Immunity 2000; 13:561-71; PMID:11070174; http://dx.doi.org/10.1016/S1074-7613(00)00055-8
- Shaw MH, Boyartchuk V, Wong S, Karaghiosoff M, Ragimbeau J, Pellegrini S, Muller M, Dietrich WF, Yap GS. A natural mutation in the Tyk2 pseudokinase domain underlies altered susceptibility of B10.Q/J mice to infection and autoimmunity. Proc Natl Acad Sci U S A 2003; 100:11594-9; PMID:14500783; http://dx.doi.org/10.1073/pnas.1930781100
- Ubel C, Mousset S, Trufa D, Sirbu H, Finotto S. Establishing the role of tyrosine kinase 2 in cancer. Oncoimmunology 2013; 2:e22840; PMID:23482926; http://dx.doi.org/10.4161/onci.22840
- Simma O, Zebedin E, Neugebauer N, Schellack C, Pilz A, Chang-Rodriguez S, Lingnau K, Weisz E, Putz EM, Pickl WF et al. Identification of an indispensable role for tyrosine kinase 2 in CTL-mediated tumor surveillance. Cancer Res 2009; 69:203-11; PMID:19118004; http://dx.doi.org/10.1158/0008-5472.CAN-08-1705
- Zhang Q, Sturgill JL, Kmieciak M, Szczepanek K, Derecka M, Koebel C, Graham LJ, Dai Y, Chen S, Grant S et al. The role of Tyk2 in regulation of breast cancer growth. J Interferon Cytokine Res 2011; 31:671-7; PMID:21864028; http://dx.doi.org/10.1089/jir.2011.0023
- Vielnascher RM, Hainzl E, Leitner NR, Rammerstorfer M, Popp D, Witalisz A, Rom R, Karaghiosoff M, Kolbe T, Muller S et al. Conditional ablation of TYK2 in immunity to viral infection and tumor surveillance. Transgenic Res 2014; 23:519-29; PMID:24696087; http://dx.doi.org/10.1007/s11248-014-9795-y
- Shimoda K, Tsutsui H, Aoki K, Kato K, Matsuda T, Numata A, Takase K, Yamamoto T, Nukina H, Hoshino T et al. Partial impairment of interleukin-12 (IL-12) and IL-18 signaling in Tyk2-deficient mice. Blood 2002; 99:2094-9; PMID:11877284; http://dx.doi.org/10.1182/blood.V99.6.2094
- Stoiber D, Kovacic B, Schuster C, Schellack C, Karaghiosoff M, Kreibich R, Weisz E, Artwohl M, Kleine OC, Muller M et al. TYK2 is a key regulator of the surveillance of B lymphoid tumors. J Clin Invest 2004; 114:1650-8; PMID:15578097; http://dx.doi.org/10.1172/JCI200422315
- Schleicher U, Mattner J, Blos M, Schindler H, Rollinghoff M, Karaghiosoff M, Muller M, Werner-Felmayer G, Bogdan C. Control of Leishmania major in the absence of Tyk2 kinase. Eur J Immunol 2004; 34:519-29; PMID:14768057; http://dx.doi.org/10.1002/eji.200324465
- Minegishi Y, Saito M, Morio T, Watanabe K, Agematsu K, Tsuchiya S, Takada H, Hara T, Kawamura N, Ariga T et al. Human tyrosine kinase 2 deficiency reveals its requisite roles in multiple cytokine signals involved in innate and acquired immunity. Immunity 2006; 25:745-55; PMID:17088085; http://dx.doi.org/10.1016/j.immuni.2006.09.009
- Kilic SS, Hacimustafaoglu M, Boisson-Dupuis S, Kreins AY, Grant AV, Abel L, Casanova JL. A patient with tyrosine kinase 2 deficiency without hyper-IgE syndrome. J Pediatr 2012; 160:1055-7; PMID:22402565; http://dx.doi.org/10.1016/j.jpeds.2012.01.056
- Ishizaki M, Muromoto R, Akimoto T, Sekine Y, Kon S, Diwan M, Maeda H, Togi S, Shimoda K, Oritani K et al. Tyk2 is a therapeutic target for psoriasis-like skin inflammation. Int Immunol 2014; 26:257-67; PMID:24345760; http://dx.doi.org/10.1093/intimm/dxt062
- Liang J, Tsui V, Van Abbema A, Bao L, Barrett K, Beresini M, Berezhkovskiy L, Blair WS, Chang C, Driscoll J et al. Lead identification of novel and selective TYK2 inhibitors. Eur J Med Chem 2013; 67:175-87; PMID:23867602; http://dx.doi.org/10.1016/j.ejmech.2013.03.070
- Liang Y, Zhu Y, Xia Y, Peng H, Yang XK, Liu YY, Xu WD, Pan HF, Ye DQ. Therapeutic potential of tyrosine kinase 2 in autoimmunity. Expert Opin Ther Targets 2014; 18:571-80; PMID:24654603; http://dx.doi.org/10.1517/14728222.2014.892925
- Menet CJ. Toward selective TYK2 inhibitors as therapeutic agents for the treatment of inflammatory diseases. Pharm Pat Anal 2014; 3:449-66; PMID:25291316; http://dx.doi.org/10.4155/ppa.14.23
- Norman P. Evaluation of WO2013125543, WO2013146963 and EP2634185: the first Tyk2 inhibitors from Takeda and Sareum. Expert Opin Ther Pat 2014; 24:361-8; PMID:24386992; http://dx.doi.org/10.1517/13543776.2014.864637
- Works MG, Song B, Kibler P, Tanga MJ, Galande AK, D'Andrea A. Design of a peptide inhibitor of tyrosine kinase 2. Protein Pept Lett 2014; 21:419-25; PMID:24304386; http://dx.doi.org/10.2174/0929866520666131203101841
- Sanda T, Tyner JW, Gutierrez A, Ngo VN, Glover J, Chang BH, Yost A, Ma W, Fleischman AG, Zhou W et al. TYK2-STAT1-BCL2 pathway dependence in T-cell acute lymphoblastic leukemia. Cancer Discov 2013; 3:564-77; PMID:23471820; http://dx.doi.org/10.1158/2159-8290.CD-12-0504
- Velusamy T, Kiel MJ, Sahasrabuddhe AA, Rolland D, Dixon CA, Bailey NG, Betz BL, Brown NA, Hristov AC, Wilcox RA et al. A novel recurrent NPM1-TYK2 gene fusion in cutaneous CD30-positive lymphoproliferative disorders. Blood 2014; 124(25):3768-71; PMID:25349176; http://dx.doi.org/10.1182/blood-2014-07-588434
- Ide H, Nakagawa T, Terado Y, Kamiyama Y, Muto S, Horie S. Tyk2 expression and its signaling enhances the invasiveness of prostate cancer cells. Biochem Biophys Res Commun 2008; 369:292-6; PMID:17920038; http://dx.doi.org/10.1016/j.bbrc.2007.08.160
- Caldas-Lopes E, Cerchietti L, Ahn JH, Clement CC, Robles AI, Rodina A, Moulick K, Taldone T, Gozman A, Guo Y et al. Hsp90 inhibitor PU-H71, a multimodal inhibitor of malignancy, induces complete responses in triple-negative breast cancer models. Proc Natl Acad Sci U S A 2009; 106:8368-73; PMID:19416831; http://dx.doi.org/10.1073/pnas.0903392106
- Ragimbeau J, Dondi E, Alcover A, Eid P, Uze G, Pellegrini S. The tyrosine kinase Tyk2 controls IFNAR1 cell surface expression. EMBO J 2003; 22:537-47; PMID:12554654; http://dx.doi.org/10.1093/emboj/cdg038
- Gauzzi MC, Barbieri G, Richter MF, Uze G, Ling L, Fellous M, Pellegrini S. The amino-terminal region of Tyk2 sustains the level of interferon alpha receptor 1, a component of the interferon alpha/beta receptor. Proc Natl Acad Sci U S A 1997; 94:11839-44; PMID:9342324; http://dx.doi.org/10.1073/pnas.94.22.11839
- Li Z, Gakovic M, Ragimbeau J, Eloranta ML, Ronnblom L, Michel F, Pellegrini S. Two rare disease-associated Tyk2 variants are catalytically impaired but signaling competent. J Immunol 2013; 190:2335-44; PMID:23359498; http://dx.doi.org/10.4049/jimmunol.1203118
- Potla R, Koeck T, Wegrzyn J, Cherukuri S, Shimoda K, Baker DP, Wolfman J, Planchon SM, Esposito C, Hoit B et al. Tyk2 tyrosine kinase expression is required for the maintenance of mitochondrial respiration in primary pro-B lymphocytes. Mol Cell Biol 2006; 26:8562-71; PMID:16982690; http://dx.doi.org/10.1128/MCB.00497-06
- Rani MR, Leaman DW, Han Y, Leung S, Croze E, Fish EN, Wolfman A, Ransohoff RM. Catalytically active TYK2 is essential for interferon-beta-mediated phosphorylation of STAT3 and interferon-alpha receptor-1 (IFNAR-1) but not for activation of phosphoinositol 3-kinase. J Biol Chem 1999; 274:32507-11; PMID:10542297; http://dx.doi.org/10.1074/jbc.274.45.32507
- Ahmed CM, Noon-Song EN, Kemppainen K, Pascalli MP, Johnson HM. Type I IFN receptor controls activated TYK2 in the nucleus: implications for EAE therapy. J Neuroimmunol 2013; 254:101-9; PMID:23110939; http://dx.doi.org/10.1016/j.jneuroim.2012.10.006
- Prchal-Murphy M, Semper C, Lassnig C, Wallner B, Gausterer C, Teppner-Klymiuk I, Kobolak J, Muller S, Kolbe T, Karaghiosoff M et al. TYK2 kinase activity is required for functional type I interferon responses in vivo. PLoS One 2012; 7:e39141; PMID:22723949; http://dx.doi.org/10.1371/journal.pone.0039141
- Huntington ND, Vosshenrich CA, Di Santo JP. Developmental pathways that generate natural-killer-cell diversity in mice and humans. Nat Rev Immunol 2007; 7:703-14; PMID:17717540; http://dx.doi.org/10.1038/nri2154
- Sojka DK, Plougastel-Douglas B, Yang L, Pak-Wittel MA, Artyomov MN, Ivanova Y, Zhong C, Chase JM, Rothman PB, Yu J et al. Tissue-resident natural killer (NK) cells are cell lineages distinct from thymic and conventional splenic NK cells. Elife 2014; 3:e01659; PMID:24714492; http://dx.doi.org/10.7554/eLife.01659
- Peng H, Jiang X, Chen Y, Sojka DK, Wei H, Gao X, Sun R, Yokoyama WM, Tian Z. Liver-resident NK cells confer adaptive immunity in skin-contact inflammation. J Clin Invest 2013; 123:1444-56; PMID:23524967; http://dx.doi.org/10.1172/JCI66381
- Lanier LL. NK cell recognition. Annu Rev Immunol 2005; 23:225-74; PMID:15771571; http://dx.doi.org/10.1146/annurev.immunol.23.021704.115526
- Sullivan RP, Leong JW, Fehniger TA. MicroRNA regulation of natural killer cells. Front Immunol 2013; 4:44; PMID:23450173; http://dx.doi.org/10.3389/fimmu.2013.00044
- Fehniger TA, Cai SF, Cao X, Bredemeyer AJ, Presti RM, French AR, Ley TJ. Acquisition of murine NK cell cytotoxicity requires the translation of a pre-existing pool of granzyme B and perforin mRNAs. Immunity 2007; 26:798-811; PMID:17540585; http://dx.doi.org/10.1016/j.immuni.2007.04.010
- Vivier E, Raulet DH, Moretta A, Caligiuri MA, Zitvogel L, Lanier LL, Yokoyama WM, Ugolini S. Innate or adaptive immunity? The example of natural killer cells. Science 2011; 331:44-9; PMID:21212348; http://dx.doi.org/10.1126/science.1198687
- Ortaldo JR, Bere EW, Hodge D, Young HA. Activating Ly-49 NK receptors: central role in cytokine and chemokine production. J Immunol 2001; 166:4994-9; PMID:11290779; http://dx.doi.org/10.4049/jimmunol.166.8.4994
- Mizutani T, Neugebauer N, Putz EM, Moritz N, Simma O, Zebedin-Brandl E, Gotthardt D, Warsch W, Eckelhart E, Kantner HP et al. Conditional IFNAR1 ablation reveals distinct requirements of Type I IFN signaling for NK cell maturation and tumor surveillance. Oncoimmunology 2012; 1:1027-37; PMID:23170251; http://dx.doi.org/10.4161/onci.21284
- Lee CK, Rao DT, Gertner R, Gimeno R, Frey AB, Levy DE. Distinct requirements for IFNs and STAT1 in NK cell function. J Immunol 2000; 165:3571-7; PMID:11034357; http://dx.doi.org/10.4049/jimmunol.165.7.3571
- Guan J, Miah SM, Wilson ZS, Erick TK, Banh C, Brossay L. Role of type I interferon receptor signaling on NK cell development and functions. PLoS One 2014; 9:e111302; PMID:25333658; http://dx.doi.org/10.1371/journal.pone.0111302
- Robbins SH, Tessmer MS, Van Kaer L, Brossay L. Direct effects of T-bet and MHC class I expression, but not STAT1, on peripheral NK cell maturation. Eur J Immunol 2005; 35:757-65; PMID:15719366; http://dx.doi.org/10.1002/eji.200425797
- Putz EM, Gotthardt D, Hoermann G, Csiszar A, Wirth S, Berger A, Straka E, Rigler D, Wallner B, Jamieson AM et al. CDK8-mediated STAT1-S727 phosphorylation restrains NK cell cytotoxicity and tumor surveillance. Cell Rep 2013; 4:437-44; PMID:23933255; http://dx.doi.org/10.1016/j.celrep.2013.07.012
- Wu X, Chen Y, Sun R, Wei H, Tian Z. Impairment of hepatic NK cell development in IFN-gamma deficient mice. Cytokine 2012; 60:616-25; PMID:22921904; http://dx.doi.org/10.1016/j.cyto.2012.07.012
- Haan C, Rolvering C, Raulf F, Kapp M, Druckes P, Thoma G, Behrmann I, Zerwes HG. Jak1 has a dominant role over Jak3 in signal transduction through gammac-containing cytokine receptors. Chem Biol 2011; 18:314-23; PMID:21439476; http://dx.doi.org/10.1016/j.chembiol.2011.01.012
- Trotta R, Chen L, Costinean S, Josyula S, Mundy-Bosse BL, Ciarlariello D, Mao C, Briercheck EL, McConnell KK, Mishra A et al. Overexpression of miR-155 causes expansion, arrest in terminal differentiation and functional activation of mouse natural killer cells. Blood 2013; 121:3126-34; PMID:23422749; http://dx.doi.org/10.1182/blood-2012-12-467597
- Hayakawa Y, Smyth MJ. CD27 dissects mature NK cells into two subsets with distinct responsiveness and migratory capacity. J Immunol 2006; 176:1517-24; PMID:16424180; http://dx.doi.org/10.4049/jimmunol.176.3.1517
- Luetke-Eversloh M, Cicek BB, Siracusa F, Thom JT, Hamann A, Frischbutter S, Baumgrass R, Chang HD, Thiel A, Dong J et al. NK cells gain higher IFN-gamma competence during terminal differentiation. Eur J Immunol 2014; 44:2074-84; PMID:24752800; http://dx.doi.org/10.1002/eji.201344072
- Zhu S, Phatarpekar PV, Denman CJ, Senyukov VV, Somanchi SS, Nguyen-Jackson HT, Mace EM, Freeman AF, Watowich SS, Orange JS et al. Transcription of the activating receptor NKG2D in natural killer cells is regulated by STAT3 tyrosine phosphorylation. Blood 2014; 124:403-11; PMID:24891320; http://dx.doi.org/10.1182/blood-2013-05-499707
- Gotthardt D, Putz EM, Straka E, Kudweis P, Biaggio M, Poli V, Strobl B, Muller M, Sexl V. Loss of STAT3 in murine NK cells enhances NK cell-dependent tumor surveillance. Blood 2014; 124:2370-9; PMID:25185262; http://dx.doi.org/10.1182/blood-2014-03-564450
- Sullivan RP, Fogel LA, Leong JW, Schneider SE, Wong R, Romee R, Thai TH, Sexl V, Matkovich SJ, Dorn GW, 2nd et al. MicroRNA-155 tunes both the threshold and extent of NK cell activation via targeting of multiple signaling pathways. J Immunol 2013; 191:5904-13; PMID:24227772; http://dx.doi.org/10.4049/jimmunol.1301950
- Trotta R, Chen L, Ciarlariello D, Josyula S, Mao C, Costinean S, Yu L, Butchar JP, Tridandapani S, Croce CM et al. miR-155 regulates IFN-gamma production in natural killer cells. Blood 2012; 119:3478-85; PMID:22378844; http://dx.doi.org/10.1182/blood-2011-12-398099
- Fehniger TA, Wylie T, Germino E, Leong JW, Magrini VJ, Koul S, Keppel CR, Schneider SE, Koboldt DC, Sullivan RP et al. Next-generation sequencing identifies the natural killer cell microRNA transcriptome. Genome Res 2010; 20:1590-604; PMID:20935160; http://dx.doi.org/10.1101/gr.107995.110
- Chan CJ, Andrews DM, McLaughlin NM, Yagita H, Gilfillan S, Colonna M, Smyth MJ. DNAM-1/CD155 interactions promote cytokine and NK cell-mediated suppression of poorly immunogenic melanoma metastases. J Immunol 2010; 184:902-11; PMID:20008292; http://dx.doi.org/10.4049/jimmunol.0903225
- Gilfillan S, Chan CJ, Cella M, Haynes NM, Rapaport AS, Boles KS, Andrews DM, Smyth MJ, Colonna M. DNAM-1 promotes activation of cytotoxic lymphocytes by nonprofessional antigen-presenting cells and tumors. J Exp Med 2008; 205:2965-73; PMID:19029380; http://dx.doi.org/10.1084/jem.20081752
- Wong JL, Berk E, Edwards RP, Kalinski P. IL-18-primed helper NK cells collaborate with dendritic cells to promote recruitment of effector CD8+ T cells to the tumor microenvironment. Cancer Res 2013; 73:4653-62; PMID:23761327; http://dx.doi.org/10.1158/0008-5472.CAN-12-4366
- Zijlstra M, Bix M, Simister NE, Loring JM, Raulet DH, Jaenisch R. Beta 2-microglobulin deficient mice lack CD4-8+ cytolytic T cells. Nature 1990; 344:742-6; PMID:2139497; http://dx.doi.org/10.1038/344742a0
- Kiessling R, Klein E, Wigzell H. “Natural” killer cells in the mouse. I. Cytotoxic cells with specificity for mouse Moloney leukemia cells. Specificity and distribution according to genotype. Eur J Immunol 1975; 5:112-7; PMID:1234049; http://dx.doi.org/10.1002/eji.1830050208
- Kärre, K, Ljunggren, H G, Piontek, G, Kiessling, R. Selective rejection of H-2-deficient lymphoma variants suggests alternative immune defence strategy. Nature 1986; 319:675–678. PMID 3951539; http//dx.doi.org/10.1038/319675a0
- Cerwenka A, Baron JL, Lanier LL. Ectopic expression of retinoic acid early inducible-1 gene (RAE-1) permits natural killer cell-mediated rejection of a MHC class I-bearing tumor in vivo. Proc Natl Acad Sci U S A 2001; 98:11521-6; PMID:11562472; http://dx.doi.org/10.1073/pnas.201238598
- Karaghiosoff M, Steinborn R, Kovarik P, Kriegshauser G, Baccarini M, Donabauer B, Reichart U, Kolbe T, Bogdan C, Leanderson T et al. Central role for type I interferons and Tyk2 in lipopolysaccharide-induced endotoxin shock. Nat Immunol 2003; 4:471-7; PMID:12679810; http://dx.doi.org/10.1038/ni910