
ABSTRACT
We developed a therapeutic, gene-modified, allogeneic melanoma vaccine (AGI-101H), which, upon genetic modification, acquired melanoma stem cell-like phenotype. Since its initial clinical trial in 1997, the vaccine has resulted in the long-term survival of a substantial fraction of immunized patients (up to 20 years). Here, we investigated the potential molecular mechanisms underlying the long-lasting effect of AGI-101H using transcriptome profiling of patients’ peripheral T lymphocytes. Magnetically-separated T lymphocytes from AGI-101H-immunized long-term survivors, untreated melanoma patients, and healthy controls were subjected to transcriptome profiling using the microarray analyses. Data were analyzed with a multitude of bioinformatics tools (WebGestalt, DAVID, GSEA) and the results were validated with RT-qPCR. We found substantial differences in the transcriptomes of healthy controls and melanoma patients (both untreated and AGI-101H-vaccinated). AGI-101H immunization induced similar profiles of peripheral T cells as tumor residing in untreated patients. This suggests that whole stem cells immunization mobilizes analogous peripheral T cells to the natural adaptive anti-melanoma response. Moreover, AGI-101H treatment activated the TNF-α and TGF-β signaling pathways and dampened IL2-STAT5 signaling in T cells, which finally resulted in the significant up-regulation of a BCL6 transcriptional repressor, a known amplifier of the proliferative capacity of central memory T cells and mediator of a progenitor fate in antigen-specific T cells. In the present study, high levels of BCL6 transcripts negatively correlated with the expression of several exhaustion markers (CTLA4, KLRG1, PTGER2, IKZF2, TIGIT). Therefore, Bcl6 seems to promote a progenitor fate for cancer-experienced T cells from AGI-101H-vaccinated patients by repressing the exhaustion markers.
Introduction
We developed therapeutic allogeneic whole cell melanoma vaccine (AGI-101H) that has been clinically tested since 1997 and enabled the long-term survival of a substantial fraction of immunized patients.1-Citation5 The AGI-101H vaccine is comprised of two melanoma cell lines retrovirally-transduced with a designer cytokine gene encoding a fusion protein of interleukin 6 (IL-6) linked with the soluble IL-6 receptor (sIL-6R), referred to as hyper-IL-6 or H6.Citation1-Citation5 H6 modification led to the conversion of vaccine cells into melanoma stem cells (MSCs)-like with high activity of aldehyde dehydrogenase isoenzyme (ALDH1A1). The conversion mechanism was later confirmed in breast cancer cells and indicated that IL-6 induced activation of the JAK1-STAT3-OCT4 pathway converted these cells into breast cancer stem-like cells.Citation6 Accordingly, beyond targeting melanoma differentiated cells, the AGI-101H vaccine targets melanoma stem cells.
Irradiated, life AGI-101H cells with H6 as a molecular adjuvant provide complex priming through the delivery of MSCs and differentiated melanoma antigens (e.g., NY-ESO, gp-100, Tyrosinase), apoptotic bodies, and cytokines (e.g., IL-12, IFN-γ).Citation7-Citation10 Also, at the site of vaccine administration, H6 enhances the activation of CD8+ T cellsCitation7 including the allogeneic CD8+ T cell response (unpublished), induced production of GM-CSF,Citation8 presentation of cryptic antigens and maturation of dendritic cells (DCs), inhibition of regulatory T cell (Treg) differentiation by inhibiting FOXP3 expression,Citation9 and production of B cell-derived antibodies.Citation10
The AGI-101H vaccine was delivered to patients with advanced melanoma with both non-resected and resected metastases (as part of EudraCT 2008-003373-40 clinical trial, ETAM2-5Citation1,Citation3,Citation5). The vaccine was initially administered eight times in two-week intervals (induction phase) followed by once per month until death (maintenance phase). In case of recurrence, the induction phase was repeated with or without surgery and followed by a maintenance phase.Citation1,Citation3,Citation5 A significant number of AGI-101H-treated patients are still alive – out of 138 patients in ETAM2-5 study, 96 patients (69.6%) are alive for up to 20 years since the first administration of AGI-101H vaccine (the mean time of the treatment is 196 months and ranges from 144 to 245 months among the surviving group). A subset was randomly selected for participation in the present study. Previously, we observed a significant induction of functionally active ALDH1A1-specific CD8+ T cell population and up-regulation of specific anti-ALDH1A1 antibodies in vaccinated patientsCitation4; however, neither the global effect of AGI-101H administration nor it’s underlying mechanism have been fully characterized.
The primary goal of the present study was to characterize the molecular profiles of the peripheral T cells from long-term survival patients treated with AGI-101H and compare these with the profiles from untreated patients with melanoma and healthy donors using whole transcriptome microarray analysis.
As expected, substantial transcriptomic differences were found between healthy controls and patients with melanoma. Interestingly, the differences identified between healthy controls and AGI-101H-immunized patients were even more pronounced (relative to untreated melanoma patients), despite these patients being tumor-free for an average of 196 months and considered healthy. The observed similarities between the transcriptome profiles of untreated and AGI-101H-treated patients suggest that immunization has induced analogous peripheral T cell mobilization as untreated tumors residing in patients.
Microarray technology enabled the identification of a BCL6 transcriptional repressor as a gene that is significantly differentially expressed in all of the tested groups. The role of Bcl6 in T cell differentiation, survival, and long-term proliferation has been studied extensively.Citation11-Citation16 Bcl6 enforced the progenitor fate of antigen-specific T cells and facilitated their longevity and proliferation. Moreover, Bcl6 repressed exhaustion of antigen-specific T cells, which correlated with down-regulation of “exhaustion markers”.Citation14 Also, the expression of BCL6 is tightly regulated during the development of specific T cell subpopulations and its expression is induced and modulated by several cytokines (e.g., IFN-γ, IL-6, type I IFN, IL-12, TGF-β, and TNF-α) in a variety of cell typesCitation17-Citation23 and repressed by IL2-STAT5 signaling.Citation24
In our study, BCL6 expression levels were the highest in the peripheral T cells from AGI-101H-immunized patients and inversely correlated with the expression of Bcl6 target genes (CD69, GRP183, PRDM1) and several “exhaustion markers” (CTLA4, KLRG1, PTGER2, IKZF2, TIGIT). The significant up-regulation of TGF-β and TNF-α signaling pathways, as well as simultaneous down-regulation of the IL2-STAT5 signaling pathway in AGI-101H-immunized patients further support the hypothesis that BCL6 up-regulation is an essential effector of AGI-101H administration.
Bcl6 transcriptional repressor might reinvigorate T cells and facilitate the progenitor-fate of cancer-experienced T cellsCitation11-Citation16 in AGI-101H-vaccinated patients by repressing exhaustion markers. The presence of antigen-specific peripheral T cells that acquire stem cell-like properties, and are regularly mobilized to respond to melanoma cells (upon systematic vaccine administration) is likely what protects AGI-101H immunized patients against melanoma relapse for many years.
Results
Over 500 genes are significantly differentially expressed in the peripheral T cells from AGI-101H-vaccinated patients compared to untreated patients with melanoma
To compare the expression profiles of untouched peripheral T cells from AGI-101H-vaccinated long term survivals (AV), untreated melanoma patients (C) and healthy donors (H), we performed magnetic separation of pan T cells from collected PBMCs and further subjected the samples (briefly characterized in , Supp. Figure 1, and Supp. Table 1) for microarray analyses. To determine whether pre-defined groups (AV, C, and H) form separate or overlapping clusters, normalized microarray data were subjected to principal component analysis (PCA) using the ClustVis web tool.Citation25 As expected, samples from the same group clustered together (). Samples from healthy subjects were clearly demarcated from the other groups and samples from AGI-101H-immunized patients (AV) formed a cluster that partially overlapped with the untreated patients (C). In our analysis, the first five principal components explain almost 70% of the total variance (). The 50 top contributors to principal components PC1, PC2, and PC3 are presented in Supp. Table 2.
Table 1. Characteristics of the patients enrolled in this study
Figure 1. Differential gene expression analysis between peripheral T lymphocytes from patients with melanoma (c) and patients with melanoma treated with AGI-101H 6 days after vaccine administration (AV) using HG U219 microarray data
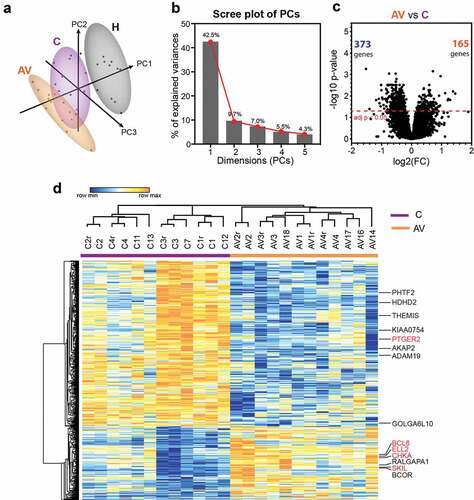
Next, we compared the expression levels of 19,285 transcripts from each group to each other in order to identify genes in peripheral T cells that vary significantly in response to melanoma growth and to AGI-101H immunization. This analysis revealed substantial transcriptomic differences between healthy controls (H) and untreated patients (C) (Supp. Figure 2a). Almost 4,500 genes were expressed at significantly higher (n = 1,688) or lower levels (n = 2,775) in cancer when compared to healthy subjects. Even more significant differences were found between healthy controls (H) and AGI-101H at day 6 (AV) (Supp. Figure 2b). Over 6,000 genes were differentially expressed at either significantly higher (n = 2,516) or lower (n = 3,671) levels in AGI-101H-immunized patients relative to healthy controls. Differential gene expression analysis between the AGI-101H-immunized (AV) and untreated patients with melanoma (C) identified 538 genes (adj. p < .05) that were either up-regulated (n = 165) or down-regulated (n = 373) in the vaccinated patients (). The relative expression of these DEGs is presented in . The expression pattern of these markers in the peripheral T cells of AGI-101H-immunized patients is the total opposite of the expression in the T cells of healthy subjects (Supp. Figure 2c).
Significantly up-regulated markers in AGI-101H-immunized patients are involved in the regulation of gene transcription
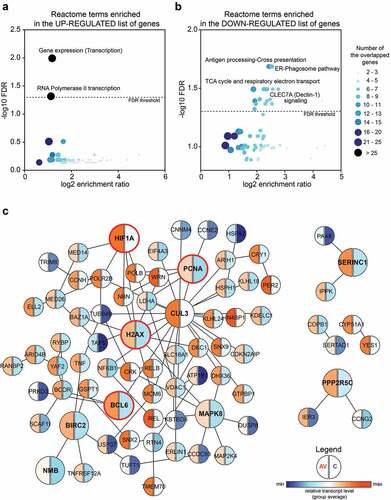
All of the DEGs in the peripheral T cells from AGI-101H-immunized patients relative to untreated patients with melanoma were further subjected for pathway analysis using WEB-based GEne SeT AnaLysis Toolkit (WebGestalt, http://www.webgestalt.org/).Citation26 The ORA revealed the enrichment of only two Reactome pathways (FDR < 0.05) in the list of 165 up-regulated markers (). These terms were strictly associated with gene transcription (gene expression (transcription), enrichment ratio = 2.265; RNA polymerase II transcription, enrichment ratio = 2.184). Analogous analysis with the lists of 373 down-regulated markers revealed the significant enrichment of 22 Reactome pathways mainly associated with signal transduction, cell cycle, and cell metabolism ( and Supp. Figure 3). The protein-protein interaction network formed within the significantly up-regulated markers in the peripheral T cells from AGI-101H-immunized patients is shown in . The top-ranking seed genes (BCL6, BIRC2, CUL3, H2AX, HIF1A, MAPK8, NMB, PCNA, PPP2R5C, SERINC1) are depicted as large circles and 4 out of the top 10 seed genes (circled in red) are either transcription factors or DNA-binding/DNA-associated proteins. Moreover, the GO annotation using DAVID further confirmed the significant up-regulation of only three biological processes, all associated with the regulation of gene transcription in the top DEGs from the AGI-101H-vaccinated patients compared to untreated patients (Supp. Figure 4).
Figure 2. Significantly up-regulated markers in the peripheral T cells of AGI-101H-immunized patients are mainly involved in the regulation of gene transcription
BCL6 transcriptional repressor up-regulation and “exhaustion marker” down-regulation
To validate the expression differences discovered in the microarray analysis, we used RT-qPCR with primers and probes specific to each marker (Supp. Table 2). We focused on the significantly DEGs (adj. p < .05) in the peripheral T cells from AGI-101H-vaccinated patients compared to untreated patients with melanoma (, gene names in red). The expected gene expression patterns were confirmed for all of the analyzed markers (PTGER2, BCL6, SKIL, CHKA, ELL2) (). Additional RNA samples (validation group) were analyzed to further strengthen our findings. We observed identical patterns in relative gene expression levels for PTGER2, BCL6, and SKIL () markers as found in the discovery group of samples.
Figure 3. The expression of BCL6 transcriptional repressor is significantly up-regulated in the peripheral T cells of AGI-101 immunized patients with melanoma and negatively correlates with the expression of BCL6 target genes as well as the expression of “exhaustion markers.”
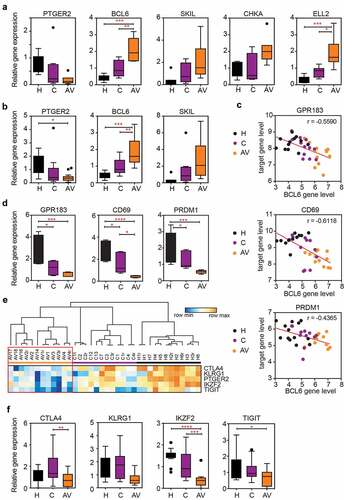
Among others, BCL6 aroused our interest due to its role as a transcriptional regulator (gene repressor) as well as its involvement in T cell differentiation and exhaustion.Citation11-Citation16 We analyzed the expression of Bcl6 target genes and several exhaustion markers using normalized microarray data and found that GPR183, CD69, and PRDM1 (encoding for Blimp-1) target genesCitation14 were down-regulated and, thus, inversely correlated with BCL6 expression level (). RT-qPCR analyses further confirmed this finding (). The expression of several exhaustion markers (CTLA4, KLRG1, PTGER2, IKZF2, TIGIT) was also down-regulated in the peripheral T cells of AGI-101H-immunized patients compared to healthy subjects and untreated patients (). This observation was further confirmed using RT-qPCR analysis. We observed analogous patterns in the relative gene expression levels for tested exhaustion markers (). However, only CTLA4 and IKZF2 were significantly down-regulated in peripheral T cells of AGI-101H-vaccinated patients (AV) when compared to untreated patients (C).
Activation of TNF-α and TGF-β signaling pathways
Due to discrete changes in the relative gene expression levels of the experimental groups and a rather small number of samples in each group, we next focused on the whole differential gene expression profiles formed as rank gene expression lists (ranked based on log2FC). As such, GSEA was performed to uncover the biological relevance of distinct transcriptome profiles in the peripheral T cells of AGI-101H-immunized patients (AV), untreated patients with melanoma (C), and healthy subjects (H).
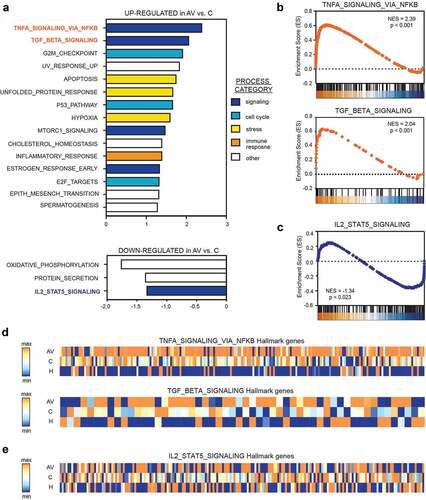
Compared to untreated patients with melanoma (C), the transcription profile of AGI-101H-immunized patients (AV) was highly enriched with genes that are significantly associated with TNF-α signaling via NFκB (NES = 2.39, p < .001), TGF-β signaling (NES = 2.07, p < .001), and G2/M checkpoint (NES = 1.92, p < .001); (). Moreover, we observed significant depletion of IL2-STAT5 signaling (NES = −1.34, p = .023) pathway in peripheral T cells from AGI-101H-immunized patients compared to untreated patients ().
Figure 4. Gene set enrichment analysis (GSEA) revealed significant up-regulation of TNF-a (via NFkβ) and down-regulation of IL2-STAT5 signaling in the peripheral T cells from AGI-101H-vaccinated patients with melanoma
Compared to healthy subjects, the transcriptome profile of untreated patients with melanoma (C) was highly enriched with genes that are most significantly associated with TNF-α signaling via NFκB (NES = 2.60, p < .001), p53 pathway (NES = 1.93, p < .001), and hypoxia (NES = 1.86, p < .001) and strongly depleted of genes that are significantly associated with E2F targets (NES = −1.35, p = .016), oxidative phosphorylation (NES = −1.34, p = .009), and fatty acid metabolism (NES = −1.33, p = .027) (Supp. Figure 5a). These biological processes were similarly deregulated in the peripheral T cells of AGI-101H-immunized patients (AV) relative to healthy subjects (Supp. Figure 5b).
Discussion
There are five major findings of the study: (i) the transcription profile of the peripheral T cells substantially differs between healthy subjects and patients with melanoma (either untreated or treated with AGI-101H), (ii) AGI-101H immunization induces a similar transcription profile in peripheral T cells as tumors residing in untreated patients, (iii) AGI-101H immunization induces TNF-α (via NFκB) and TGF-β signaling and depletes IL2-STAT5 signaling in peripheral T cells, (iv) AGI-101H immunization up-regulates BCL6 expression, and (v) Bcl6 represses the expression of T cell exhaustion markers and, therefore, may enforce a progenitor-like fate of cancer-experienced T cells.
The majority of investigations focus on T cell function within the formed tumor microenvironment. To our knowledge, there are only two papers comparing the transcriptional profiles of peripheral blood cells from healthy subjects and patients with advanced (stage IV) melanoma. Felts SJ. et al.Citation27 demonstrated that CD4+ peripheral blood cells from patients with melanoma display conservation in the overall transcriptome profile compared to healthy subjects. The DEGs identified in this study were enriched for inflammatory response genes and encoded membrane proteins involved in cell-cell communication, cell adhesion and migration, and molecular transport. However, the authors did not extrapolate the biological relevance of these observed alterations.
Another recently published paper used whole transcriptome RNA sequencing to profile long non-coding RNAs in multiple immune cell types in the peripheral blood of patients with stage IV melanoma. As demonstrated by Wang L. et al.Citation28 the peripheral blood CD4+, CD8+, and CD14+ cells from patients with melanoma exhibited different expression profiles relative to healthy subjects. However, their investigation mainly focused on the non-coding transcriptional landscape specific to distinct immune cell classes (helper T cell, cytotoxic T cell, monocytes); as such, it provides informative, insightful cell type-specific guidance relevant to targeted immunotherapy regimens.
In the current study, we analyzed the mechanisms ongoing in the circulation of patients with melanoma and assessed the processes that underlie mounting an efficient immune response. We previously described a functionally active, ALDH1A1-specific CD8+ T cell population in the periphery of vaccinated patients associated with AGI-101H treatment.Citation4 After each vaccine dose, the number of ALDH1A1-specific CTLs significantly increased and then returned to baseline levels by the next booster (1 month later). Moreover, AGI-101H immunization induced the generation of antibodies specific to ALDH1.
Therefore, we analyzed the expression profile of untouched peripheral T lymphocytes from healthy subjects, patients with melanoma, and long-term survival patients treated with AGI-101H using microarray technology to determine the molecular mechanisms underlying the anti-cancer immune response. The analysis of pan T cells may partially mask the variability in gene expression profiles between CD4+ and CD8+ T cell populations. Consequently, biologically significant heterogeneity within a population of T cells may be neglected. However, despite this limitation, the panel of differentially expressed genes provides novel insights into the cellular response of peripheral T cells to AGI-101H administration.
First, using PCA,Citation25 we demonstrated that samples from the same group clustered together. The expression profile of peripheral T cells of healthy subjects is clearly distinct from the expression profiles of the other groups, with the highest differences being between healthy control subjects and AGI-101H-treated patients. This suggests that each sample harbors transcriptomic features that are unique to the specific immunological state of the patient (either healthy or cancer-experienced) and further implies that only discrete differences exist in transcriptional profiles of patients with melanoma (either untreated or AGI-101 immunized), at least in their peripheral T cells. Indeed, samples from untreated patients with melanoma with non-resected metastases (C) and AGI-101H-immunized patients (AV) partially overlap, which is reflective of the substantial similarities in their transcriptome profiles.
The number of significantly DEGs further confirmed the presence of more robust discrepancies between AGI-101H-vaccinated patients and healthy controls than between untreated patients and healthy subjects, despite the AGI-101H-immunized patients being tumor-free for an average of 196 months and considered “healthy”.Citation1,Citation3,Citation5 The low number of DEGs in the peripheral T cells of AGI-101H-immunized patients relative to the untreated ones suggests similar mechanisms of peripheral T cells mobilization upon AGI-101H administration and anti-melanoma natural host responses. It was further confirmed by GSEA, which revealed similar deregulation of biological processes in the peripheral T cells of AGI-101H-immunized (AV) and untreated patients (C) compared to healthy subjects.
Further insight into the DEGs using the WebGestalt online tool enabled the identification of several significantly altered Reactome pathways in the peripheral T cells of AGI-101H-immunized patients. Interestingly, only two terms were enriched in the list of up-regulated genes. Both terms are strictly associated with gene expression. It was further confirmed with functional analysis with the DAVID tool. GO annotation revealed significant up-regulation of three biological processes, all associated with the regulation of transcription. It is generally accepted that the changes in phenotype and function that characterize the differentiation of naïve T cells to effector and memory cell fates are underscored by large-scale, coordinated, and stable gene expression changes.Citation29 Therefore, our results evidence the induction of peripheral T cell specialization into distinct subpopulations, which is tightly regulated at the transcriptional level. Moreover, 22 terms were enriched among the down-regulated markers and these terms are mostly associated with signal transduction, cell cycle regulation, and cell metabolism.
Among the significantly up-regulated genes in the peripheral T cells of AGI-101H-immunized patients with melanoma, BCL6 transcriptional repressor is the most interesting. Using network topology-based analysis, BCL6 was discovered to be one of the top-ranking seed genes. To confirm the biological meaning of the observed accumulation of BCL6 in T cells, we analyzed the expression of putative BCL6 target genes.Citation13,Citation14 Indeed, high BCL6 expression levels correlated with low levels of all three tested target genes.
Moreover, we observed the down-regulation of several markers associated with T cell exhaustionCitation30,Citation31 in the peripheral T cells of AGI-101H-vaccinated patients, which is consistent with a previous report on the exhaustion of antigen-specific CD8+ T cells.Citation14 The CTLA-4 signaling has been shown to dampen immune responses against infections and tumor cells.Citation32,Citation33 Treatment with ipilimumab, the anti-CTLA-4 antibody, has been reported to improve the survival of metastatic melanoma patients.Citation34 Also, the co-blockade of TIGIT and PD-1 signals enhances anti-melanoma immune responses and the efficiency of controlling melanoma cells is higher compared to the single blockade of PD-1/PD-L1.Citation35 The IKZF2 transcription factor, also known as HELIOS, was recently identified in a network analysis as a potential inducer of the exhausted state.Citation36
In our data, we observed significant down-regulation of CTLA-4 and IKZF2 expression in peripheral T cells of AGI-101H-immunized patients. The level of TIGIT, another potent exhaustion marker, was also reduced, although we did not observe statistical significance. Interestingly, Cai Y. et al.Citation37 have observed substantial TIGIT up-regulation in activated CD4+ T cells in response to a novel Bcl6 inhibitor, FX1. Also, Wang CJ. et al.Citation38 have demonstrated significant up-regulation of Bcl6 in CD4 T cells from anti–CTLA-4 antibody-injected mice. Taken together, we suggest that high a level of BCL6 in peripheral T cells of AGI-101H-immunized patients results in dampening of T cell exhaustion.
Among the signaling cues that up-regulate BCL6 expression in peripheral T cells, IL-6 transiently induces BCL6 expression in newly activated CD4+ T cells.Citation12 Our AGI-101H cells secrete the H6 fusion protein,Citation7,Citation39 which displays significantly higher activity than IL-6.Citation40 Therefore, we believe that BCL6 up-regulation in the peripheral T cells of vaccinated patients is a direct result of AGI-101H administration.
Human naïve CD4+ T cell can be polarized into T follicular helper (Tfh) cells by TGF-β signaling (either by TGF-β/IL-12 or TGF-β/IL-23).Citation22,Citation41 The induction of TGF-β signaling promotes the survival and function of antigen-experienced T cellsCitation29,Citation30 and induces the expression of BCL6 transcriptional repressor in T cells.Citation31 In our study, we observed a significant up-regulation in TGF-β signaling in the peripheral T cells from AGI-101H-immunized patients (vs. untreated melanoma and healthy controls), which may be the second mediator of BCL6 up-regulation in response to AGI-101H treatment.
Bcl6 also regulates CD8+ T cell homeostasis. Recently, Bcl6 was shown to enforce the progenitor fate of antigen-specific CD8+ T cells.Citation14 Antigen-specific CD8+ T cells are central to the control of chronic infections and cancer but persistent antigen stimulation results in T cell exhaustion, which further leads to decreased effector function and reduced proliferative capacity.Citation42 As reported by Wu T. et al.Citation14 BCL6 can be induced in peripheral T cells by the TCF1 transcription factor and TCF1+ virus-specific CD8+ T cells are less exhausted, persist and recall better, and resemble Tfh cells. Also, Bcl6 acts as an amplifier for the generation and proliferation of the central memory CD8+ T (CD8+ TCM) cells.Citation16 As TCM cells expand well in response to secondary activation and survive for long periods of time, they are well poised to protect against large tumor burdens, metastases, and relapses.Citation43
Therefore, we suggest that, besides generating a population of ALDH1A1-specific CD8+ T cells that acquire a central memory phenotype, the AGI-101H vaccine’s mode of action also includes the induction of BCL6 in peripheral T cells that further regulates both CD4+ T cell differentiation and antigen-experienced CD8+ T cell proliferation and stem cell-like behavior.
Significant up-regulation of TNF-α signaling in the peripheral T cells of AGI-101H-vaccinated patients’ further supports this hypothesis. It is well established that TNF-α signaling regulates the frequency of effector and/or memory CD4+ or CD8+ T cells generated from naive T cells in response to antigen stimulation by providing proliferative and survival signals either directly to the T cells or to the antigen-presenting cells (APCs) with which they interact.Citation44 We suggest that the up-regulation of TNF-α signaling (via NFκB) further contributes to the maintenance of melanoma-experienced T cells that protect immunized patients from relapse.
We also observed a significant down-regulation in IL2-STAT5 signaling in the peripheral T cells of both healthy subjects and AGI-101H-vaccinated patients. The IL2-STAT signaling pathway is critical for regulatory T cell development, homeostasis, and function. IL-2 receptor signaling activates STAT5Citation45 and induces Blimp1 encoded by the PRDM1 gene,Citation13 which is a potent negative regulator of BCL6 expression. As such, an IL-2 → STAT5 → Blimp1 signaling axis prevents Tfh differentiation through direct down-regulation of BCL6 expression.Citation20 Therefore, we suggest that dampening IL2-STAT5 signaling (and down-regulating PRDM1), together with increased TGF-β signaling, results in the up-regulation of BCL6 expression in the peripheral T cells of AGI-101H-immunized patients and ultimately mobilizes peripheral T cells to protect against further tumor development in melanoma-experienced patients.
Bcl6 seems to facilitate the progenitor-fate of cancer-experienced T cells in AGI-101H-vaccinated patients by repressing exhaustion markers. The presence of antigen-specific peripheral T cells that acquire stem cell-like properties and are regularly mobilized in response to melanoma cells may ultimately protect immunized patients against relapse for many years by keeping cancer cells in a dormant state.
Materials and methods
Patient and control groups
Two single-arm, open-label, single-institution, Phase II clinical studies, referred to as “Trial 3” and “Trial 5,” were undertaken. Trial 3 (“A Phase II trial: the evaluation of the efficacy and toxicity of an allogeneic melanoma vaccine, genetically modified, with interleukin 6/soluble interleukin 6 receptor complex (Hyper-IL-6) in patients with resected metastases”) and Trial 5 (“A Phase I/II clinical trial of melanoma immunotherapy with cellular vaccine modified with Hyper-IL-6 and GMCSF”) were approved by the Regional Bioethics Committee (RBC) in Poznan, Poland. In November 2008, all 138 living patients from the two trials were transferred into the “Extended Treatment for Advanced Melanoma Patients Transferring from Trials 2 to 5 (ETAM2-5)” study. The ETAM 2-5 trial was approved by the RBC and the Central Evidence of Clinical Trials (EudraCT Number 2008-003373-40). As of November 26, 2017, 96 patients were still alive. In this group, the mean time of vaccine administration is 196 months and ranges from 144 to 245 months (Supp. Table 1).
18 long-term survivors enrolled into ETAM2-5 Trial were eligible to participate in the present study, all of them are still alive.Citation1,Citation3,Citation5 Written informed consent was obtained from all patients. Patients with no previous treatment were selected to serve as the untreated melanoma group (n = 13). The AGI-101H-immunized patients (n = 18) were randomly selected for transcriptome profiling analysis (out of 96 immunized patients, all in the maintenance phase). The characteristics of the patients and healthy controls (n = 8) enrolled in this study are presented in and Supp. Figure 1. Disease-free survival (DSF) was defined as the time between the last diagnosed and resected tumor and peripheral blood mononuclear cell (PBMC) isolation. The last column presents samples that were further analyzed with the microarray.
For microarray analyses (the discovery group), eight samples per group were tested, half of them in technical replicates (random selection). Samples from the untreated patients with melanoma (C) and AGI-101H-vaccinated patients with melanoma (AV) were randomly divided into a discovery or validation group.
PBMC isolation
Peripheral blood was collected from AGI-101H-treated patients 6 days after vaccine administration, from untreated patients (before any therapy was initiated), and healthy donors. PBMCs were isolated within 3 hours by standard gradient centrifugation in a Histopaque 1077 (Sigma-Aldrich). Cells were cryopreserved using the CTL-Cryo™ ABC Media Kit (CTL), which ensures unimpaired PBMC function, and were included for pan T cell separation.
Untouched pan T cell separation
Farer thawing, the PBMCs were subjected to magnetic bead-based separation using the human Pan T Cell Separation Kit (Miltenyi Biotec) according to the manufacturer’s instructions. Upon separation, the cells were washed twice with PBS and their purity was confirmed by flow cytometry using the CD2-FITC (BD Biosciences, clone S5.2) and CD3-PE-Cy7 (BioLegend, clone SK-7) antibodies. All samples except one (sample name: AV_4) displayed a T cell purity > 80% (Supp. Figure 1 and Table 1).
RNA isolation and determination of RNA integrity
Untouched, separated T cells were washed with PBS and lysed with TRIzol® Reagent (Thermo Fisher) according to the manufacturer’s instructions. The quality of the RNA samples was determined by on-chip electrophoresis using an Agilent 2100 Bioanalyzer with the Agilent RNA 6000 Nano Kit according to the manufacturer’s instructions. The average RNA integrity number (RIN) was calculated by the software for the AGI-101H-immunized patients (AV), untreated patients (C), and healthy controls (H) and this was used to indicate the quality of the RNA. Only samples with RINs above 7.0 were included for further analysis. Samples were stored at −80°C.
Affymetrix U219 array strip
The Affymetrix procedure and methods of analyses were performed according to the literature.Citation46,Citation47 Total RNA (50 ng) was amplified, biotin-labeled, and fragmented using the Affymetrix GeneChip® 3ʹ IVT Express Kit (Affymetrix). Biotin-labeled fragments of cDNA (5.5 μg) were hybridized to the Affymetrix® Human Genome U219 Array Strip (48°C/20 h). Next, the microarrays were washed and stained according to the manufacturer protocol, using the Affymetrix GeneAtlas Fluidics Station. The array strips were scanned in the Imaging Station of the GeneAtlas System. Quality assessments and preliminary analyses were performed with the Affymetrix GeneAtlasTM Operating Software. The obtained CEL files were imported into downstream data analysis as previously reported.Citation46,Citation47
All further analyses were performed using the BioConductor software, based on the statistical R programming language. The Robust Multiarray Averaging algorithm implemented in the “affy” package of the BioConductor was applied for background correction, normalization, and summation of the raw data.Citation48 Biological annotation was taken from the BioConductor “oligo” package where a complete gene data table was generated by merging the annotated data frame object with the normalized data set.Citation49 The criterion for significantly changed gene expression was based on an adjusted p-value < 0.05. The results from this analysis are represented as volcano plots, which reflect the total number of up- and down-regulated genes.
Principal component analysis
Principal component analysis (PCA) was performed using the ClustVis web tool. For further details, see ref.Citation25
Overrepresentation enrichment analysis
Overrepresentation enrichment analysis (ORA) with the Reactome pathway functional database class (and genome protein-coding as a reference set) was performed using the WebGestalt tool (http://www.webgestalt.org/).Citation26 A false discovery rate (FDR) < 0.05 with a minimum of five genes per category served as the threshold.
Network topology-based analysis
Network topology-based analysis with the protein-protein interaction network from BioGRID (PPI_BIOGRID) as the functional database class and the Network Retrieval & Prioritization construction method was performed using the WebGestalt tool.Citation26 The FDR threshold was set at 0.05.and up to 10 highlighted seed genes were selected in the network.
Functional analysis
The most differentially expressed genes (DEGs) (FC < 0.66 or FC > 1.5, adj. p < .1) from the performed comparisons (C vs. H, AV vs. H, AV vs. C) were subjected to functional annotation and clusterization analyses using the DAVID (Database for Annotation, Visualization, and Integrated Discovery) bioinformatics tools.Citation50 The gene symbols for the DEGs were uploaded into DAVID using the “RDAVIDWebService” Bioconductor libraryCitation51 where DEGs were assigned to relevant gene ontology (GO) terms and then analyzed for statistically significant enrichment. The p-values of the selected GO terms were corrected using the Benjamini–Hochberg FDR method and thereafter referred to as “adjusted” p-values.
RT-qPCR analysis
The RT-qPCR analysis was performed to validate the microarray findings. Briefly, cDNA was synthesized from 0.5–1 μg of RNA using the iScript cDNA Synthesis Kit (Bio-Rad) according to the manufacturer’s instructions with 0.5–1 μg RNA as the input template. For genes selected for validation, specific intron-spanning primers were designed using the Universal Probe Library System Assay Design Center (Roche). Primer sequences are listed in Supp. Table 3.
Gene set enrichment analysis
Gene set enrichment analysis (GSEA, http://www.broad.mit.edu/gsea/index.html) was used to detect the coordinated expression of a priori defined groups of genes within the tested samples. Gene sets are available from the Molecular Signatures Database (MSigDB, http://www.broad.mit.edu/gsea/.msigdb/msigdb_index.html). Briefly, GSEA generated an enrichment score (ES) reflective of the degree to which a gene set is overrepresented at the extremes (top or bottom) of the entire list of microarray data – where genes are ranked according to expression difference (signal/noise ratio) between the tested group of samples: healthy controls, untreated patients with melanoma, and AGI-101H-immunized patients with melanoma. The ES calculation and estimation of the statistical significance (nominal p-value), together with the normalized enrichment score (NES) and FDR calculations, have been previously described in detail.Citation52 A total of 19,825 markers (previously ranked based on their log2FC between analyzed groups) were imported for GSEA. The GSEA was run according to the default parameters: each probe set was collapsed into a single gene vector (identified by its HUGO gene symbol), permutation number = 1,000, and permutation type = “gene-sets.” The FDR was used to correct for multiple comparisons and gene set sizes.
Disclosure of potential conflicts of interest
No potential conflicts of interest were disclosed.
Ethics approval and consent to participate
All investigations were performed after approval by approved by the Regional Bioethics Committee (RBC) in Poznan, Poland in accordance with an assurance filed with and approved by the Polish Ministry of Health and the Central Evidence of Clinical Trials (EudraCT Number 2008-003373-40). Written informed consent was obtained from every patient prior to enrollment. All procedures were performed in accordance with the principles outlined in the Helsinki Declaration.
Supplemental Material
Download ()Supplementary material
Supplemental data for this article can be accessed on the publisher’s website.
Additional information
Funding
References
- Mackiewicz A, Mackiewicz J, Wysocki PJ, Wiznerowicz M, Kapcinska M, Laciak M, Rose-John S, Izycki D, Burzykowski T, Karczewska-Dzionk A. Long-term survival of high-risk melanoma patients immunized with a Hyper-IL-6-modified allogeneic whole-cell vaccine after complete resection. Expert Opin Investig Drugs. 2012;21(6):773–13. doi:10.1517/13543784.2012.684753.
- Kozlowska A, Mackiewicz J, Mackiewicz A. Therapeutic gene modified cell based cancer vaccines. Gene. 2013;525(2):200–207. doi:10.1016/j.gene.2013.03.056.
- Mackiewicz J, Karczewska-Dzionk A, Laciak M, Kapcinska M, Wiznerowicz M, Burzykowski T, Zakowska M, Rose-John S, Mackiewicz A. Whole cell therapeutic vaccine modified with hyper-IL6 for combinational treatment of nonresected advanced melanoma. Medicine (Baltimore). 2015;94(21):e853. doi:10.1097/MD.0000000000000853.
- Kwiatkowska-Borowczyk E, Czerwinska P, Mackiewicz J, Gryska K, Kazimierczak U, Tomela K, Przybyła A, Kozłowska AK, Galus Ł, Kwinta Ł, et al. Whole cell melanoma vaccine genetically modified to stem cells like phenotype generates specific immune responses to ALDH1A1 and long-term survival in advanced melanoma patients. Oncoimmunology. 2018;7(11):e1509821. doi:10.1080/2162402X.2018.1509821.
- Mackiewicz J, Burzykowski T, Izycki D, Mackiewicz A. Re-induction using whole cell melanoma vaccine genetically modified to melanoma stem cells-like beyond recurrence extends long term survival of high risk resected patients - updated results. J Immunother Cancer. 2018;6:134.
- Kim S-Y, Kang JW, Song X, Kim BK, Yoo YD, Kwon YT, Lee YJ. Role of the IL-6-JAK1-STAT3-Oct-4 pathway in the conversion of non-stem cancer cells into cancer stem-like cells. Cell Signal. 2013;25(4):961–969. doi:10.1016/j.cellsig.2013.01.007.
- Bottcher JP, Schanz O, Garbers C, Zaremba A, Hegenbarth S, Kurts C, Beyer M, Schultze JL, Kastenmüller W, Rose-John S, et al. IL-6 trans-signaling-dependent rapid development of cytotoxic CD8+ T cell function. Cell Rep. 2014;8(5):1318–1327.
- Ozbek S, Peters M, Breuhahn K, Mann A, Blessing M, Fischer M, Schirmacher P, Mackiewicz A, Rose-John S. The designer cytokine hyper-IL-6 mediates growth inhibition and GM-CSF-dependent rejection of B16 melanoma cells. Oncogene. 2001;20(8):972–979. doi:10.1038/sj.onc.1204180.
- Dominitzki S, Fantini MC, Neufert C, Nikolaev A, Galle PR, Scheller J, Monteleone G, Rose-John S, Neurath MF, Becker C, et al. Cutting edge: trans-signaling via the soluble IL-6R abrogates the induction of FoxP3 in naive CD4+CD25 T cells. J Immunol. 2007;179(4):2041–2045. doi:10.4049/jimmunol.179.4.2041.
- Nawrocki S, Laciak M, Izycki D, Gryska K, Wysocki PJ, Grabarczyk P, Karczewska A, Kaczmarek A, Murawa P, Malicki J, et al. Humoral responses to melanoma vaccine, genetically modified with interleukin 6 and soluble interleukin 6 receptors. Adv Exp Med Biol. 2001;495:411–418.
- Crotty S. T follicular helper cell differentiation, function, and roles in disease. Immunity. 2014;41(4):529–542. doi:10.1016/j.immuni.2014.10.004.
- Ichii H, Sakamoto A, Arima M, Hatano M, Kuroda Y, Tokuhisa T. Bcl6 is essential for the generation of long-term memory CD4+ T cells. Int Immunol. 2007;19(4):427–433. doi:10.1093/intimm/dxm007.
- Hatzi K, Nance JP, Kroenke MA, Bothwell M, Haddad EK, Melnick A, Crotty S. BCL6 orchestrates Tfh cell differentiation via multiple distinct mechanisms. J Exp Med. 2015;212(4):539–553. doi:10.1084/jem.20141380.
- Wu T, Ji Y, Moseman EA, Xu HC, Manglani M, Kirby M, Anderson SM, Handon R, Kenyon E, Elkahloun A, et al. The TCF1-Bcl6 axis counteracts type I interferon to repress exhaustion and maintain T cell stemness. Sci Immunol. 2016;1:6. doi:10.1126/sciimmunol.aai8593.
- Ichii H, Sakamoto A, Hatano M, Okada S, Toyama H, Taki S, Arima M, Kuroda Y, Tokuhisa T. Role for Bcl-6 in the generation and maintenance of memory CD8+ T cells. Nat Immunol. 2002;3(6):558–563. doi:10.1038/ni802.
- Ichii H, Sakamoto A, Kuroda Y, Tokuhisa T. Bcl6 acts as an amplifier for the generation and proliferative capacity of central memory CD8+ T cells. J Immunol. 2004;173(2):883–891. doi:10.4049/jimmunol.173.2.883.
- Hideshima T, Mitsiades C, Ikeda H, Chauhan D, Raje N, Gorgun G, Hideshima H, Munshi NC, Richardson PG, Carrasco DR, et al. A proto-oncogene BCL6 is up-regulated in the bone marrow microenvironment in multiple myeloma cells. Blood. 2010;115(18):3772–3775. doi:10.1182/blood-2010-02-270082.
- Nakayamada S, Kanno Y, Takahashi H, Jankovic D, Lu KT, Johnson TA, Sun H-W, Vahedi G, Hakim O, Handon R, et al. Early Th1 cell differentiation is marked by a Tfh cell-like transition. Immunity. 2011;35(6):919–931. doi:10.1016/j.immuni.2011.11.012.
- Nakayamada S, Poholek AC, Lu KT, Takahashi H, Kato M, Iwata S, Hirahara K, Cannons JL, Schwartzberg PL, Vahedi G, et al. Type I IFN induces binding of STAT1 to Bcl6: divergent roles of STAT family transcription factors in the T follicular helper cell genetic program. J Immunol. 2014;192(5):2156–2166. doi:10.4049/jimmunol.1300675.
- Choi YS, Yang JA, Crotty S. Dynamic regulation of Bcl6 in follicular helper CD4 T (Tfh) cells. Curr Opin Immunol. 2013;25(3):366–372. doi:10.1016/j.coi.2013.04.003.
- Madapura HS, Nagy N, Ujvari D, Kallas T, Kröhnke MCL, Amu S, Björkholm M, Stenke L, Mandal PK, McMurray JS, et al. Interferon γ is a STAT1-dependent direct inducer of BCL6 expression in imatinib-treated chronic myeloid leukemia cells. Oncogene. 2017;36(32):4619–4628. doi:10.1038/onc.2017.85.
- Schmitt N, Liu Y, Bentebibel S-E, Munagala I, Bourdery L, Venuprasad K, Banchereau J, Ueno H. The cytokine TGF-beta co-opts signaling via STAT3-STAT4 to promote the differentiation of human TFH cells. Nat Immunol. 2014;15(9):856–865. doi:10.1038/ni.2947.
- Ujvari D, Nagy N, Madapura HS, Kallas T, Kröhnke MCL, Stenke L, Klein E, Salamon D. Interferon gamma is a strong, STAT1-dependent direct inducer of BCL6 expression in multiple myeloma cells. Biochem Biophys Res Commun. 2018;498(3):502–508. doi:10.1016/j.bbrc.2018.03.010.
- Walker SR, Nelson EA, Frank DA. STAT5 represses BCL6 expression by binding to a regulatory region frequently mutated in lymphomas. Oncogene. 2007;26(2):224–233. doi:10.1038/sj.onc.1209775.
- Metsalu T, Vilo J. ClustVis: a web tool for visualizing clustering of multivariate data using principal component analysis and heatmap. Nucleic Acids Res. 2015;43(W1):W566–W570. doi:10.1093/nar/gkv468.
- Wang J, Vasaikar S, Shi Z, Greer M, Zhang B. WebGestalt 2017: a more comprehensive, powerful, flexible and interactive gene set enrichment analysis toolkit. Nucleic Acids Res. 2017;45(W1):W130–W137. doi:10.1093/nar/gkx356.
- Felts SJ, Van Keulen VP, Scheid A, Allen KS, Bradshaw RK, Jen J, Peikert T, Middha S, Zhang Y, Block MS, et al. Gene expression patterns in CD4+ peripheral blood cells in healthy subjects and stage IV melanoma patients. Cancer Immunol Immunother. 2015;64(11):1437–1447. doi:10.1007/s00262-015-1745-x.
- Wang L, Felts SJ, Van Keulen VP, Scheid AD, Block MS, Markovic SN, Pease LR, Zhang Y. Integrative genome-wide analysis of long noncoding RNAs in diverse immune cell types of melanoma patients. Cancer Res. 2018;78(15):4411–4423. doi:10.1158/0008-5472.CAN-18-0529.
- Nguyen ML, Jones SA, Prier JE, Russ BE. Transcriptional enhancers in the regulation of T cell differentiation. Front Immunol. 2015;6:462. doi:10.3389/fimmu.2015.00462.
- Wherry EJ, Kurachi M. Molecular and cellular insights into T cell exhaustion. Nat Rev Immunol. 2015;15(8):486–499. doi:10.1038/nri3862.
- Martinez GJ, Pereira RM, Aijo T, Kim EY, Marangoni F, Pipkin ME, Togher S, Heissmeyer V, Zhang YC, Crotty S, et al. The transcription factor NFAT promotes exhaustion of activated CD8(+) T cells. Immunity. 2015;42(2):265–278. doi:10.1016/j.immuni.2015.01.006.
- Nakamoto N, Cho H, Shaked A, Olthoff K, Valiga ME, Kaminski M, Gostick E, Price DA, Freeman GJ, Wherry EJ, et al. Synergistic reversal of intrahepatic HCV-specific CD8 T cell exhaustion by combined PD-1/CTLA-4 blockade. PLoS Pathog. 2009;5(2):e1000313. doi:10.1371/journal.ppat.1000313.
- Curran MA, Montalvo W, Yagita H, Allison JP. PD-1 and CTLA-4 combination blockade expands infiltrating T cells and reduces regulatory T and myeloid cells within B16 melanoma tumors. Proc Natl Acad Sci. 2010;107(9):4275–4280. doi:10.1073/pnas.0915174107.
- Hodi FS, O’Day SJ, McDermott DF, Weber RW, Sosman JA, Haanen JB, Gonzalez R, Robert C, Schadendorf D, Hassel JC, et al. Improved survival with ipilimumab in patients with metastatic melanoma. N Engl J Med. 2010;363:711–723. doi:10.1056/NEJMoa1003466.
- Chauvin JM, Pagliano O, Fourcade J, Sun Z, Wang H, Sander C, Kirkwood JM, Chen THT, Maurer M, Korman AJ, et al. TIGIT and PD-1 impair tumor antigen-specific CD8⁺ T cells in melanoma patients. J Clin Invest. 2015;125(5):2046–2058. doi:10.1172/JCI80445.
- Doering TA, Crawford A, Angelosanto JM, Paley MA, Ziegler CG, Wherry EJ. Network analysis reveals centrally connected genes and pathways involved in CD8+ T cell exhaustion versus memory. Immunity. 2012;37(6):1130–1144. doi:10.1016/j.immuni.2012.08.021.
- Cai Y, Abdel-Mohsen M, Tomescu C, Xue F, Wu G, Howell BJ, Ai Y, Sun J, Azzoni L, Le Coz C, et al. BCL6 inhibitor-mediated downregulation of phosphorylated SAMHD1 and T cell activation are associated with decreased HIV infection and reactivation. J Virol. 2019;93(2):pii: e01073–18.
- Wang CJ, Heuts F, Ovcinnikovs V, Wardzinski L, Bowers C, Schmidt EM, Kogimtzis A, Kenefeck R, Sansom DM, Walker LSK, et al. CTLA-4 controls follicular helper T-cell differentiation by regulating the strength of CD28 engagement. Proc Natl Acad Sci. 2015;112(2):524–529. doi:10.1073/pnas.1414576112.
- Mackiewicz A, Schooltink H, Heinrich PC, Rose-John S. Complex of soluble human IL-6-receptor/IL-6 up-regulates expression of acute-phase proteins. J Immunol. 1992;149:2021–2027.
- Fischer M, Goldschmitt J, Peschel C, Brakenhoff JP, Kallen KJ, Wollmer A, Grötzinger J, Rose-John S. A bioactive designer cytokine for human hematopoietic progenitor cell expansion. Nat Biotechnol. 1997;15(2):142–145. doi:10.1038/nbt0297-142.
- Schmitt N, Bustamante J, Bourdery L, Bentebibel SE, Boisson-Dupuis S, Hamlin F, Tran MV, Blankenship D, Pascual V, Savino DA, et al. IL-12 receptor beta1 deficiency alters in vivo T follicular helper cell response in humans. Blood. 2013;121(17):3375–3385. doi:10.1182/blood-2012-08-448902.
- Hashimoto M, Kamphorst AO, Im SJ, Kissick HT, Pillai RN, Ramalingam SS, Araki K, Ahmed R. CD8 T cell exhaustion in chronic infection and cancer: opportunities for Interventions. Annu Rev Med. 2018;69:301–318. doi:10.1146/annurev-med-012017-043208.
- Perret R, Ronchese F. Memory T cells in cancer immunotherapy: which CD8 T-cell population provides the best protection against tumours? Tissue Antigens. 2008;72(3):187–194. doi:10.1111/j.1399-0039.2008.01088.x.
- Croft M. The role of TNF superfamily members in T-cell function and diseases. Nat Rev Immunol. 2009;9(4):271–285. doi:10.1038/nri2526.
- Johnston RJ, Choi YS, Diamond JA, Yang JA, Crotty S. STAT5 is a potent negative regulator of TFH cell differentiation. J Exp Med. 2012;209(2):243–250. doi:10.1084/jem.20111174.
- Jopek K, Tyczewska M, Ramanjaneya M, Szyszka M, Celichowski P, Milecka P, Malendowicz L, Rucinski M. Effect of ACTH and hCG on the expression of gonadotropin-inducible ovarian transcription factor 1 (Giot1) gene in the rat adrenal gland. Int J Mol Sci. 2018;19:8. doi:10.3390/ijms19082285.
- Jopek K, Tyczewska M, Celichowski P, Malendowicz LK, Rucinski M. Transcriptome profile in unilateral adrenalectomy-induced compensatory adrenal growth in the rat. Int J Mol Sci. 2018;19:4. doi:10.3390/ijms19041111.
- Gautier L, Cope L, Bolstad BM, Irizarry RA. affy–analysis of Affymetrix GeneChip data at the probe level. Bioinformatics. 2004;20(3):307–315. doi:10.1093/bioinformatics/btg405.
- Carvalho BS, Irizarry RA. A framework for oligonucleotide microarray preprocessing. Bioinformatics. 2010;26:2363–2367.
- Huang DW, Sherman BT, Lempicki RA. Systematic and integrative analysis of large gene lists using DAVID bioinformatics resources. Nat Protoc. 2009;4(1):44–57. doi:10.1038/nprot.2008.211.
- Fresno C, Fernandez EA. RDAVIDWebService: a versatile R interface to DAVID. Bioinformatics. 2013;29(21):2810–2811. doi:10.1093/bioinformatics/btt487.
- Subramanian A, Tamayo P, Mootha VK, Mukherjee S, Ebert BL, Gillette MA, Paulovich A, Pomeroy SL, Golub TR, Lander ES, et al. Gene set enrichment analysis: A knowledge-based approach for interpreting genome-wide expression profiles. Proc Natl Acad Sci. 2005;102(43):15545–15550. doi:10.1073/pnas.0506580102.