
 ?Mathematical formulae have been encoded as MathML and are displayed in this HTML version using MathJax in order to improve their display. Uncheck the box to turn MathJax off. This feature requires Javascript. Click on a formula to zoom.
ABSTRACT
In this study, we investigated the ability of bispecific antibody armed activated T cells to target drug resistant pancreatic cancer cells and whether or not “priming” these resistant cancer cells with bispecific antibody armed activated T cells could enhance subsequent responsiveness to chemotherapeutic drugs. Chemotherapeutic responses for pancreatic cancer are either limited or the tumors develop resistance to chemotherapy regimens. The impetus for this study was the remarkable clinical response seen in our earlier phase I/II clinical trial: a pancreatic cancer patient with drug resistant tumors who showed progression of disease following three infusions of anti-CD3 x anti-EGFR bispecific antibody armed activated T cells (EGFR BATs) was restarted on the initial low dose of 5-fluorouracil showed complete response, suggesting that BATs infusions may have sensitized patient’s tumor for chemoresponsiveness. In the current study, we tested the hypothesis that BATs can sensitize tumors for chemoresponsiveness. Gemcitabine or cisplatin-resistant MiaPaCa-2 and L3.6 cell lines were effectively targeted by EGFR BATs. Priming of drug sensitive or resistant cells with EGFR BATs followed by retargeting with lower concentrations of 50% inhibitory concentration of gemcitabine or cisplatin showed enhanced cytotoxicity. Gemcitabine or cisplatin-resistant cell lines show an increased proportion of CD44+/CD24+/EpCAM+ cancer stem like cells as well as an increased number of ABC transporter ABCG2 positive cells compared to the parental cell lines. These data suggest that bispecific antibody armed activated T cells can target and kill chemo-resistant tumor cells and also markedly augment subsequent chemotherapeutic responsiveness, possibly by modulating the expression of ABC transporters.
Introduction
Pancreatic cancer has the worst survival rate of all cancers; the five-year survival is less than 5% and has not improved over the last decade.Citation1 Most patients are diagnosed at late stages with unresectable disease and up to 50% cases have metastatic disease.Citation2 Treatment of advanced or recurrent disease with gemcitabine (GEM) in combination with nab-paclitaxel increased the median survival from 6.7 months for GEM alone to 8.7 months; and with FOLFIRINOX (folinic acid, 5-fluorouracil (5-FU), irinotecan, and oxaliplatin) the median overall survival increased from 6.8 months to 11.2 months.Citation3
In our previous phase I/II pancreatic cancer study, a patient’s tumor appeared to have progressed after three weekly infusions of anti-CD3 x anti-EGFR Bispecific antibody (BiAb) Armed activated T cells (EGFR BATs), the patient was restarted on a low dose of the same chemotherapy (5-FU) received prior to BATs therapy, and the patient had a complete response that lasted up to 54 months.Citation4 The clinical response to the same chemotherapy has been seen in lung cancer and other solid tumors after administration of vaccine or checkpoint inhibitors.Citation5–10 These observations provide important clinical clues for the presence of “chemosensitization” as a mechanism for the responses.
This in vitro study was designed to identify the mechanism(s) responsible for the remarkable clinical responses seen in our earlier phase I/II clinical trial by investigating whether: (1) immunotherapy following chemotherapy would augment BATs-induced tumor cytotoxicity; (2) using BATs to prime parental or chemoresistant pancreatic cancer cell lines would increase subsequent chemosensitivity in tumors; (3) BATs could kill CD44+/CD24+EpCAM+ cancer stem-like cells (CSC); and (4) BATs priming would modulate the function of the ATP-binding cassette (ABC) transporter superfamily members which are responsible for drug efflux and drug resistance in many tumors.Citation11–15 ABC transporters known to contribute to multidrug resistance (MDR)Citation16 include P-glycoprotein (P-gp)/ABCB1, ABCG2, ABCC1, and others may be responsible for chemoresistance seen in pancreatic cancer.Citation17
Our study shows that BATs enhance the effects of cytotoxic agents, directly killing parental and chemoresistant pancreatic cancer cell lines and CSC, sensitize parental and chemoresistant tumors to subsequent chemotherapy and decrease the expression of ABC transporters responsible for drug resistance.
Material and methods
CellCulture and Maintenance and Chemotherapeutic Drugs.Human pancreatic carcinoma cell lines L3.6, MiaPaCa-2, and PANC-1 were obtained from American Type Culture Collection (ATCC) and maintained in Dulbecco’s Modified Eagle Media (DMEM) (Sigma-Aldrich) supplemented with 10% fetal bovine serum (Atlanta Biologicals), 2% penicillin-streptomycin (HyClone), and 2 mM L-glutamine (HyClone). Activated T cells were maintained in Roswell Park Memorial Institute media (RPMI-1640) supplemented with 10% fetal bovine serum (Atlanta Biologicals), 2% penicillin-streptomycin (HyClone), and 2 mM L-glutamine (Hyclone). Cell were grown in a humidified incubator at 37°C at 5% CO2.
IC50 Dose Titration of Cisplatin, Docetaxel, Paclitaxel, and Gemcitabine in MiaPaCa-2 and PANC-1 cells.The 50% inhibitory concentration (IC50) for cisplatin (CIS), docetaxel (TAX), paclitaxel (PAC), and GEM were assessed by using the MTT (3-(4,5-dimethylthiazol-2-yl)-2,5-diphenyltetrazolium bromide) colorimetric assay (Promega). L3.6, MiaPaCa-2, and PANC-1 cells were trypsinized, washed, and incubated overnight in a humidified incubator. Each condition was performed in quadruplicate with 3 × 10³ cells/well on a 96-well flat bottom plate. Cells were subsequently treated for 72 hours in the absence or presence of drug ranging from 0.2 μM to 75 μM concentrations. After drug treatment, 15 μL of the MTT dye solution was added to each well and incubated for 4 hours in a humidified incubator. The reaction was stopped by adding 100 μL of solubilization solution and the plate was incubated for an additional hour at room temperature. The MTT solution in the wells were mixed using multichannel pipet to solubilize the crystallized formazan in the 96-well plate before measuring the absorbance at 570 nm using a Synergy HTX Plate Reader. The % inhibition was calculated using the following equation:
% Inhibition = 100 - (Treated Absorbance/Untreated Absorbance) x 100
The % inhibition values were plotted against their respective cisplatin concentrations and the IC50 values for all cell lines were extrapolated accordingly.
Production of BATs.Epidermal growth factor receptor (EGFR)- or human epidermal growth factor receptor II (HER2)-BATs are produced by activating T cells with anti-CD3 (Miltenyi), expanding them with IL-2 (AkronBiotech), and arming the activated T cells (ATCs) with anti-CD3 x anti-EGFR or anti-CD3 x anti-HER2 bispecific antibody (EGFRBi or HER2Bi) as previously described.Citation18 Arming the ATCs with EGFRBi or HER2Bi turns each ATC into a non-major histocompatibility complex restricted, antigen-specific, cytotoxic T lymphocyte. Upon engagement of a tumor cell, an array of cytokines are released, which leads to the destruction of the tumor targeted by the respective BATs and stimulation of the endogenous immune system.Citation19
Chromium(51Cr) Release Cytotoxicity Assay.Cytotoxic activity of BATs against specific targets was assessed by 51Cr release assay in 96-well flat-bottom microtiter plates. Briefly, ATCs, EGFR-BATs, or HER2-BATs were plated in triplicate onto 4 × 10⁴ target cells/well (MiaPaCa-2, L3.6, or PANC-1 and their CIS or GEM-resistant derivatives) at different effector to target (E/T) ratios. 51Cr release was measured after 18–24 hours. Percent specific cytotoxicity was calculated using the following formula: (experimental cpm – spontaneous cpm)/(maximum cpm – spontaneous cpm) × 100.
Generating CIS and GEM Resistant L3.6,MiaPaCa-2, and PANC-1 Cell Lines.CIS and GEM-resistant L3.6, MiaPaCa-2, and PANC-1 were generated by culturing the tumor cells in the presence of IC50 concentrations of CIS (L3.6, 16.0 μM; MiaPaCa-2, 18.6 μM; PANC-1, 14.0 μM) or GEM (L3.6, 12.0 μM; MiaPaCa-2, 15.6 μM) for 72 hours. After treatment, the remaining cells were washed and incubated in culture media until near confluency was reached. The cell lines were then subcultured and exposed to one tenth of their respective IC50 concentrations. The cell lines were continually grown and subcultured in this manner until they were stable in one tenth of their IC50 concentration. Once stable, the cell lines were subcultured and exposed to double the previous concentration. This process was repeated continuously until the cells were being grown in half of their respective IC50 concentration.
Generating Dual Drug (CIS/GEM or GEM/CIS) Resistant Cell Lines.CIS and GEM dual resistant or GEM and CIS dual resistant MiaPaCa-2 were generated by culturing the single drug GEM-resistant MiaPaCa-2 cells in the presence of IC50 concentrations of CIS (MiaPaCa-2, 18.6 μM) or CIS-resistant MiaPaCa-2 cells in the presence of IC50 concentrations of GEM (MiaPaCa-2, 15.6 μM) for 72 hours. After treatment, the remaining cells were washed and incubated in culture media until near confluency was reached. The cell lines were then subcultured and exposed to one tenth of their respective IC50 concentrations. The cell lines were continually grown and subcultured in this manner until they were stable in one tenth of their IC50 concentration. Once stable, the cell lines were subcultured and exposed to double the previous concentration. This process was repeated continuously until the cells were being grown in half of their respective IC50 concentration. Dual resistant cell lines were maintained in half of the respective IC50 concentration of CIS and GEM (Fig. S1, upper and lower panels).
Enrichment of Cancer Stem-like Cells (CSC). CSC from MiaPaCa-2 and L3.6 parental cell lines and their respective CIS and GEM-resistant derivatives were enriched in ultra-low adherence plates at 1000 cells/mL using serum-free DMEM/F12 supplemented with 2% penicillin-streptomycin (HyClone), 20 ng/mL human recombinant epidermal growth factor (hrEGF; Invitrogen), 10 ng/mL human recombinant basic fibroblast growth factor (hrbFGF; Invitrogen), 2% B27 supplement without vitamin A and 1% N2 supplement (Invitrogen, Carlsbad, CA, USA). Single cell suspension was prepared by dissociation of tumorspheres with Accumax (Sigma-Aldrich) prior to staining for flow cytometry and cytotoxicity assays.
Flow Cytometry and Imaging Flow Cytometry. Single cell suspensions of MiaPaCa-2 cell line and its CIS- and GEM-resistant derivatives grown in 2D culture or 3D tumorspheres were stained with the mouse anti-human fluorescence-labeled antibodies: EpCAM-APC-Cy7, CD44-FITC, CD24-APC, and HER2-PE (BD Biosciences) to analyze the proportion of % positive CSC by flow cytometry. For imaging flow cytometry, EpCAM+/EGFR+ cells were sorted to stain with CD44-FITC, CD24-PerCp Cy5.5 (Red) and HER2-PE (yellow) to analyze on ImageStreamX System. Parental cell lines and their CIS- and GEM-resistant derivatives were also stained for the expression of efflux drug transporters with the following anti-human fluorescence-labeled antibodies: ABCB1 (MDR-1)-AF647, ABCC1 (MRP-1)-AF488, ABCC5-AF405 and ABCG2-PE. Cells were analyzed on a FACScalibur (BD Biosciences) or NovoCyte, and the data was analyzed using FlowJo software (BD Biosciences) or NovoExpress (Agilent Technologies). The acquired data was analyzed using the IDEAS (v6.1, Amnis) software.
Flow Cytometry-Based Drug Efflux Assay. Cell-based multidrug resistance direct dye efflux assay (ECM910, Millipore) was performed to understand the mechanism of BAT-induced chemosenstization in the parental and CIS-resistant MiaPaCa-2 and PANC-1 pancreatic cancer cell lines. The efflux activity of ABC transporters is highly temperature sensitive with activity being optimal at 37°C and ineffective at 4°C. MDR-1 expressing cells that are preloaded with MDR-1 fluorescent substrates will retain the dye and show high fluorescence when incubated at 4°C, while cells incubated at 37°C will efflux the dye and show reduced fluorescence. The assay was performed as per the manufacturer’s instructions. The intracellular accumulation of Rhodamine 123 and DiOC2 was acquired by NovoCyte flow cytometer and the data was analyzed using NovoExpress software.
Monitoring of Cytotoxicity by Real Time Cell Analysis after Chemosensitization of Cancer Cells. The response of BATs chemosensitization of parent and resistant MiaPaCa-2 and PANC-1 cell lines to CIS was evaluated using the cell-impedance based, real-time cell analysis (RTCA) system (xCELLigence MP System) and the respective 96-well E-Plates (ACEA Biosciences). After the initial background check, the adherent cell lines were trypsinized, washed, and seeded at 1 × 10⁴ cells/well (MiaPaCa-2) and 5 × 10³ cells/well (PANC-1) in 96-well E-Plates. Seeded plates were kept for 30 minutes at ambient temperature to allow for even distribution and settling of tumor cells. After thirty minutes, the plates were transferred to the RTCA system and incubated overnight. The RTCA system was programmed to collect the cell index data points at 15 minute intervals. The next day, cryopreserved ATC were thawed, washed, armed with EGFRBi at 50 ng/1x106 cells for 15 minutes, washed again, and placed in medium supplemented with 100 IU/mL of IL-2. The EGFR-BATs were seeded onto the E-Plate at an E/T ratio of 2:1 for parental and CIS-resistant tumor cells and transferred to the RTCA system. Data acquisition was resumed and the E-Plate was incubated overnight. The next day, data acquisition was paused and the E-Plate was removed. The supernatant from the E-Plate was decanted and each well was washed once with culture media. Immediately following, DMEM supplemented with CIS at the respective IC50 concentration, half of the IC50 concentration, and a quarter of the IC50 concentration for each cell line was added to the E-Plate. The E-Plate was transferred to the RTCA system and the experiment was resumed. Data acquisition continued for approximately 72 hours. The % cytotoxicity was calculated for the time point immediately preceding delta cell index (DCI) saturation of the untreated tumor cells using the following equation:
% Cytotoxicity = (DCITumor Alone - (DCITreated/DCITumor Alone) x 100
Where: DCITumor Alone is the average DCI between replicates of untreated tumor cells
DCITreated is the average DCI between replicates of BATs and/or CIS treated tumor
Western Blot. Cells were washed three times with phosphate buffer saline (PBS) and harvested in lysis buffer containing RIPA (Sigma-Aldrich) and a protease inhibitor cocktail (Sigma-Aldrich). After incubation at 4°C for one hour, the lysates were centrifuged at 14,000 x g at 4°C for 10 minutes followed by protein quantification via a Bradford assay. Whole cell lysates were incubated in sodium dodecyl sulfate (SDS) sample buffer under reducing conditions at 100°C for 10 minutes and run on a 4–20% SDS–polyacrylamide gel (Bio-Rad Laboratories) followed by electro-transferring proteins onto polyvinylidene difluoride (PVDF) membranes. The PVDF membranes, blocked with 5% bovine serum albumin in PBS-Tween 20, were incubated at 4°C overnight with diluted primary antibodies (Cell Signaling Technology, Invitrogen, Novus Biologicals). Anti-β-actin antibodies were used as loading controls. The IRDye® 680LT secondary antibodies (goat anti-rabbit or goat anti-mouse, LI-COR Biosciences) were used to detect proteins of interest using the Odyssey CLx Imaging System (LI-COR Biosciences). The densitometric quantification of the immunoblots was performed with the Image Studio™ version 5.2 software (LI-COR Biosciences). Relative expression was obtained by normalizing the densitometric value for all proteins against β-actin.
Statistical analysis. All experiments were repeated at least three times. The data are expressed as the means ± standard deviation. Comparisons amongst groups were performed using ANOVA, and the comparisons within groups were performed using the Bonferroni and the Dunnett’s method. All statistical analyses were performed using GraphPad Prism version 7.0 software (GraphPad Software, Inc.). P < .05 was considered as a statistically significant difference.
Results
BATs Kill Tumor Cells that Survived after Treatment with IC50 Dose. In order to simulate chemotherapy followed by targeted T cell therapy, we investigated whether the remainder of L3.6 and MiaPaCa-2 cells after being treated for 5 days with IC50 doses of cisplatin (CIS at 12.5 ng/mL), gemcitabine (GEM at 5 ng/mL), docetaxel (TAX at 12.5 ng/mL), and paclitaxel (PAC at 10 ng/mL) could be targeted and killed by EGFR-BATs compared to untreated cells (UT). L3.6 and MiaPaCa-2 cells that survived were washed free of drugs, expanded for 2–3 days followed by targeting with EGFR-BATs. Specific cytotoxicity was measured by 51Cr release assay at E/T of 25:1. Our data shows comparable and/or higher killing of both L3.6 cells and MiaPaCa-2 cells that survived after drug treatment compared to L3.6 and MiaPaCa-2 UT controls (, left and right panels). Cytotoxicity was significantly higher with EGFR-BATs compared to killing by UT for both L3.6 (p < .0001) and MiaPaCa-2 (p < .0001) cell lines, and were analyzed by using the multiple comparison Kruskal-Wallis test. This data suggests that the pancreatic cancer cells remaining after drug exposure are susceptible to being killed by EGFR-BATs.
Figure 1. Enhanced specific cytotoxicity by EGFR-BATs directed at pancreatic cancer cell lines after pretreatment of chemotherapeutic agents. (A)L3.6 and MiaPaCa-2 cell lines either left untreated (UT) or pretreated with IC50 doses of CIS (12.5 ng/mL), GEM (5 ng/mL), TAX(12.5 ng/mL) and PAC (10 ng/mL) for 3 days, the drugs were washed out and the surviving tumor cells were re-expanded, and tested for susceptibility for ATC and EGFR-BATs mediated killing by 51Cr release assay. There was a significant increase in the cytotoxicity mediated by EGFR-BATs against drugs (CIS, GEM, TAX, PAC) pretreated L3.6 compared to ATC mediated cytotoxicity (p < .0001). Untreated (UT) L3.6 cells served as positive control. Likewise, there was a significant increase in the EGFR-BATs mediated cytABotoxicity against MiaPaCa-2 cells pretreated with drugs (CIS, GEM, TAX, PAC) compared to ATC mediated cytotoxicity (p < .0001). (B) Shows specific cytotoxicity against GEM-, CIS-resistant, dual GEM/CIS- (first generated GEM resistance followed by inducing CIS resistance) and CIS/GEM- (first generated CIS resistance followed by inducing GEM resistance) resistant lines by ATC, EGFR- and HER2-BATs at E/T of 25:1 (n = 3) compared to parental L3.6 cell line (P). There was no difference in EGFR-BATs or HER2-BATs mediated cytotoxicity between parental and drug resistant cell lines. Cytotoxicity was significantly high when mediated by EGFR-BATs (p < .0001) or HER2-BATs (p < .0001) compared to ATC. (C)(Upper Left) Parental, CIS- (CR), and GEM-resistant (GR) L3.6 cell lines were sequentially targeted either with EGFR-BATs followed by targeting with HER2-BATs or HER2-BATs first followed by retargeting with EGFR-BATs (Upper Right panel). Data show significantly enhanced killing of both parental (p < .03) and GEM-resistant cell line (p < .004) for EGFR-BATs pretreated L3.6 cells. Sequential targeting of parental and CIS-resistant L3.6 cell lines by HER2 followed by EGFR-BATs also showed significantly high killing (p < .05). (Lower Left panel) Significantly enhanced killing of GEM- (p < .0002) and CIS-resistant (p < .0002) PANC-1 cell lines pretreated with EGFR-BATs followed by retargeting with ATC compared to untreated or ATC pretreated cells. (Lower Right panel) Comparable cytotoxicity of tumorspheres (TS) generated from parental (L3.6-TS), CIS-resistant (CR-TS), and GEM-resistant (GR-TS) cell lines when targeted with ATC, HER2-, and EGFR-BATs measured by 51Cr release assay at E/T of 25:1
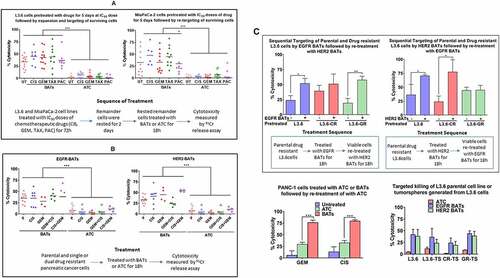
BATs Kill Dual Drug Resistant Pancreatic Cancer Cell Lines. The ability of EGFR- or HER2-BATs to kill GEM, CIS, or dual resistant cells was evaluated. Mean specific cytotoxicity mediated by EGFR-BATs directed at parental, CIS, GEM, GEM/CIS (first induced resistance to GEM followed by inducing resistance to CIS), and CIS/GEM (first induced resistance to CIS followed by induced resistance to GEM) resistant cell lines was 34.9% (n = 10), 34.8% (n = 8), 28.0% (n = 4), 40.2% (n = 6) and 38.3% (n = 3), respectively (, left). The mean specific cytotoxicity mediated by HER2-BATs directed at parental, CIS, GEM, GEM/CIS, and CIS/GEM resistant cell lines was 32.9% (n = 9), 41.1% (n = 8), 44.9% (n = 4), 24.6% (n = 6) and 54.9% (n = 4), respectively (, right). It is clear that GEM, CIS, GEM/CIS, or CIS/GEM resistant pancreatic cancer cells were effectively killed by both EGFR-BATs and HER2-BATs whereas unarmed ATC exhibited significantly lower levels of cytotoxicity directed at the same targets (). The differences in the cytotoxicity between ATC and EGFR-BATs (p < .0001) or ATC and HER2-BATs (p < .0001) was highly significant using the multiple comparison Kruskal-Wallis test.
Sequential Targeting of Drug Resistant L3.6 cells Enhances Cytotoxicity. Next, we investigated whether sequential targeting by HER2-BATs followed by EGFR-BATs or vice versa would increase total specific cytotoxicity compared to targeting by HER2-BATs alone or EGFR-BATs alone against CIS- or GEM-resistant L3.6 cell lines. In the first set of experiments, EGFR-BATs were added at E/T of 10:1 for 24 hours after which the EGFR-BATs were removed and HER2-BATs were added to the adherent L3.6 cells in 96-well plates. Cytotoxicity was measured by MTT after 72 hours. Sequential targeting of two tumor antigens in CIS-resistant L3.6 cell line by EGFR- followed by HER2-BATs showed enhanced cytotoxicity of 51% compared to single targeting by EGFR-BATs of 40% but the difference was not significant. In contrast, sequential targeting of GEM-resistant L3.6 cells showed significantly increased (p < .004) cytotoxicity of 58% compared to the low cytotoxicity of 19% by EGFR-BATs targeting of single antigen (, Top Left). Similarly, sequential targeting in CIS-resistant L3.6 cell line by HER2- followed by EGFR-BATs showed significantly enhanced (p < .05) cytotoxicity of 77% above the single targeting L3.6 cells by HER2-BATs cytotoxicity of 25%. The GEM-resistant L3.6 cells showed no difference in cytotoxicity between HER2-BATs (44%) alone or sequential targeting by HER2- followed by EGFR-BATs (45%) at E/T 10:1 (n = 3) (, Top Right). The GEM- and CIS-resistant PANC-1 cells treated with ATC or EGFR-BATs and retreated with ATC also showed significantly enhanced cytotoxicity. GEM-resistant (GR) and CIS-resistant (CR) cells showed 75.8% (p < .0002) and 79% (p < .0002) cytotoxicity, respectively, compared to 31% and 35% of ATC treated resistant PANC-1 cells (, Lower Left). These data suggest that enhanced killing of drug resistant L3.6 and PANC-1 cells with single antigen targeting can occur in sequential targeting depending on the antigens, sequence of antigen targeting, and the tumor cell line.
BATs Kill Tumorspheres Derived from the Drug Resistant Derivatives of L3.6 Cell Line. Since CSC are resistant to chemotherapy and immunotherapy,Citation20–22 we asked whether tumorspheres grown in 3D cultures are susceptible to EGFR- or HER2-BATs mediated cytotoxicity. Tumorspheres, initiated by CSC, grown in suspension in low adherence plates were dissociated to make single cell suspensions for cytotoxicity. Both HER2- and EGFR-BATs showed comparable killing of cells isolated from the tumor spheres of L3.6 parental cell line (L3.6-TS), CIS resistant (CR-TS), and GEM resistant (GR-TS) derivatives compared to control L3.6 cell line grown in 2D culture (, Lower Right). Data suggest that CSC may be susceptible to antigen specific killing by BATs but not nonspecific killing by ATC.
Priming Effect of Tumor cells with BATs
Priming or Pre-exposure of Pancreatic Tumor Cells to BATs Increases Sensitivity to Subsequent Chemotherapy. Since BATs mediated cytotoxicity against single or dual drug resistant pancreatic cancer cells were comparable to their respective parental cell lines, we chose to focus our efforts on CIS, two CIS-resistant cell lines, and their respective parental cell lines (PANC-1 and MiaPaCa-2) for detailed investigation.
Parental PANC-1, MiaPaCa-2, BxPC-3, and CFPAC cells primed with BATs at E/T 2:1 ratio for 1 hour followed by washing target cells to remove BATs and adding 2x (1d2) or 4x (1d4) lower concentrations of the IC50 dose of CIS (IC50 dose of MiaPaCa-2 = 18.6 µM, PANC-1 = 14.0 µM, CFPAC = 10 µM, and BxPC-3 = 6.9 µM) to monitor the cytotoxicity up to 72 hours. Our data show significantly enhanced specific cytotoxicity compared to non-BATs primed tumor cells ().
Figure 2. Chemosensitization of Pancreatic Cancer Cell Lines by BATs.(A) Cytotoxicity of PANC-1 (Upper Left), MiaPaCa-2 (Upper Right), BxPC-3 (Lower Left), and CFPAC (Lower Right) cell lines pretreated with BATs at an E/T of 2:1 followed by treatment with 25% (1/4th) of the IC50 or 50% (half) of the IC50 dose of CIS (IC50 dose for PANC-1 = 14.0 µM, MiaPaCa-2 = 18.6 µM, CFPAC = 10 µM, and BxPC-3 = 6.9 µM) measured using the RTCA system. The solid lines show priming with BATs before addition of CIS and the dashed lines show treatment with CIS without priming with BATs. BATs primed PANC-1 cells showed significantly increased specific cytotoxicity after adding CIS at all doses 3.5 µM (25% of IC50 dose) (p < .002), 7.0 µM (50% of IC50 dose) (p < .004), and 14 µM (IC50 dose) (p < .05) at 72 hours (Upper Left panel). Specific cytotoxicity increased significantly (p < .047) in BATs primed MiaPaCa-2 cells treated with IC50 dose of CIS compared to CIS alone treated MiaPaCa-2 cells (Upper Right panel). In BxPC-3 cells, priming with BATs before the addition of CIS significantly increased specific cytotoxicity with 25% (p < .05) and 50% (p < .045) of IC50 dose doses of CIS at 72 hours, however, there was no significant difference in cytotoxicity in BATs primed or not primed MiaPaCa-2 cells at IC50 dose of CIS (Lower Left panel). In CFPAC cells, priming with BATs before the addition of CIS significantly increased specific cytotoxicity at 72 hours with 25% of IC50 dose (p < .05) of CIS compared to CIS treated CFPAC cells without BATs priming (Lower Right panel). Cytotoxicity by CIS treatment increased in all four cell lines tested when primed with BATs compared to non-primed cells. (B) Shows the cytotoxicity at 25% and 50% of IC50 doses and at IC50 dose of CIS for CIS-resistant PANC-1 (PANC1-CR) and CIS-resistant MiaPaCa-2 (MiaPaCa-2-CR) cell lines primed with BATs
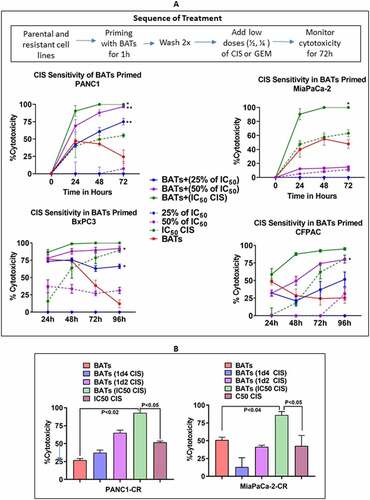
PANC-1 cells with no priming exhibited no cytotoxicity at 3.5 µM [25% of IC50] of CIS, <10% cytotoxicity at 7.0 µM [50% of IC50], and 55% cytotoxicity at 14 µM [IC50] at 72 hours using the RTCA system (, Left Upper panel). When the PANC-1 cells were primed with BATs, the subsequent addition of CIS significantly increased specific cytotoxicity to 75%, 96% and 100% at CIS concentrations of 3.5 µM (p < .002), 7.0 µM (p < .004), and 14 µM (p < .05), respectively. In MiaPaCa-2 cells, the mean cytotoxicity of 63% mediated the IC50 dose of CIS alone increased to 100% when the IC50 dose was given after BATs priming (p < .047) (, Right Upper panel).
In BxPC-3 cells with no priming exhibited 0% cytotoxicity at 1.72 µM [25% of IC50] of CIS, 27% cytotoxicity at 3.45 µM [50% of IC50] and 78% cytotoxicity at 6.9 µM [IC50] at 72 hours. When the BxPC-3 cells were primed with BATs, the subsequent addition of CIS significantly increased specific cytotoxicity to 63% at 1.72 µM (p < .05), 85% at 3.45 µM (p < .045) and 100% at 6.9 µM (NS). (, Left Lower panel).
CFPAC cells also showed the similar pattern as BxPC-3 cells. BATs priming before the addition of CIS significantly increased specific cytotoxicity at 72 hours above that seen for CIS treatment alone from 0 to 37% for the one fourth of the IC50 dose, from 0 to 73% for the half of the IC50 dose (p < .05) and from 60% to 91% for the IC50 dose (, Right Lower panel).
Priming with BATs Enhances Chemoresponsiveness of Chemoresistant Pancreatic Cancer Cell Line. For baseline comparison, CIS-resistant PANC-1 (PANC1-CR) and MiaPaCa-2 (MiaPaCa-2-CR) cells were treated with 25% IC50 or 50% IC50 of CIS, with and without EGFR BATs priming. The cytotoxicity increased with EGFR-BATs priming to 37%, 65%, and 92% at ¼, ½ of the IC50, and IC50 doses of CIS compared to cytotoxicity without BATs priming at 51% with IC50 dose of CIS or 26% when targeting with EGFR-BATs only at 72 hours (, Left). The mean cytotoxicity at MiaPaCa-2-CR increased to 13%, 41%, 86% with ¼, ½ of the IC50, and IC50 doses of CIS, respectively, compared to cytotoxicity without EGFR-BATs priming at 42% with the IC50 dose of CIS or 50% when targeting with EGFR-BATs only for 72 hours (, Right). The mean cytotoxicity of PANC1-CR cells seen with CIS treatment significantly increased after priming with EGFR-BATs followed by treatment with IC50 dose of CIS compared to cells treated with EGFR-BATs alone (p < .02) or IC50 dose of CIS alone (p < .05). Likewise, mean cytotoxicity of MiaPaCa-2-CR cells increased significantly after priming with EGFR-BATs followed by treatment with IC50 dose of CIS compared to cells treated with EGFR-BATs alone (p < .04) or the IC50 dose of CIS alone (p < .05).
Mechanism of Chemosensitization
CIS- and GEM-Resistant Lines Exhibit Characteristics of Cancer Stem-like Cells (CSC). Since drug resistant cancer cells display intrinsic or acquired properties of CSC including quiescence, morphological changes, and increased expression of drug efflux transporters,Citation20–22 we examined whether chemoresistant cells have the self-renewal competency of CSC. MiaPaCa-2 (parental), GEM- and CISresistant cell lines derived from MiaPaCa-2 cells were grown in suspension in low adherence plates to see if these cells can form tumorspheres. GEM- and CIS-resistant derivatives of MiaPaCa-2 cells that formed tumorspheres are suggestive of a CSC phenotype. To confirm the CSC phenotype, tumorspheres were dissociated, stained and images of CD44+/CD24+/HER2+ positive cells were captured by Amnis ImageStreamx MK II imaging flow cytometer. Our ImageStream data show increased proportions of CD44+/CD24+/HER2+ CSC in GEM- and CIS-resistant lines (, Middle and Right images of highlighted panel) compared to parental cell line (, Left image). Flow cytometry for CD44+/CD24+ cells is shown lower panel of .
Figure 3. Drug Resistance Associated Cancer Stem-like Cells. (A) Representative images of parental MiaPaCa-2 and its CIS- or GEM-resistant cell lines are shown, each cell type is represented by a column of three sets of images simultaneously acquired in ImageStreamx flow cytometry using ImageStreamX System. Middle panel highlighted by red box show CD44+/CD24+/HER2+ cancer stem like cells in GEM-resistant and CIS-resistant lines compared to parental cell line missing HER2 expression in CD44+/CD24+ population. From left to right: bright field (gray), CD44-FITC (green), CD24-PerCp Cy5.5 (Red) and HER2 PE (Yellow) for MiaPaCa-2 parent (Left panel) and drug resistant lines (GEM-resistant in Middle and CIS-resistant in Right panels). A panel below is the screen-capture of the IDEAS analysis showing differential dot plot representing CD44+/CD24+ for parent (Left panel) and drug resistant derivatives of MiaPaCa-2 (Middle and Right panels). (B) Shows the staining for ABCG2 gated on EpCam+/CD44+/CD24+ cells of parental, CIS-, and GEM-resistant L3.6 and MiaPaCa-2 cell lines
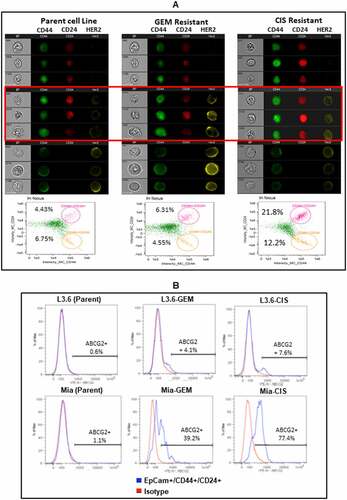
GEM- and CIS-resistant L3.6 and MiaPaCa-2 (Mia) cells shows increased expression of ABCG2 drug efflux transporter in EpCam+/CD44+/CD24+ CSC compared to parental cell lines (). ABCG2 proteinCitation23 is a potential marker of CSC along with an important mechanism in MDR.Citation24
Priming with BATs Decreases Expression of ABC Transporters in Parental and Drug Resistant Derivatives of Pancreatic Cancer Cell Lines. We assessed multiple ABC transporters in parental PANC-1 and MiaPaCa-2 pancreatic cancer cell lines and their CIS-resistant (CR) derivatives by flow cytometry (). Parental PANC-1 cell line showed expression of MRP-1 (MFI ~71,685), ABCG2 (MFI~7,975), MDR-1 (MFI~16,855), and ABCB5 (MFI~13,295) whereas PANC1-CR showed increases in MRP-1 (2.1 fold; p < .004), ABCG2 (4.0 fold; p < .002), MDR-1(6.1 fold; p < .001), and ABCB5 (12 fold; p < .001) above that seen in the CIS-sensitive parental PANC-1 cells (, Top panel, Left). Similarly, parental MiaPaCa-2 cell line showed MFI’s of 54585, 4873, 20313, and 21625 for MRP-1, ABCG2, MDR-1 and ABCB5, respectively. MiaPaCa-2-CR showed 2.4 (p < .004) and 2.5 fold (p < .04) increases in MRP-1 and ABCG2, respectively; no changes were found in MDR-1 and ABCB5 MFIs when they were compared to the MFI of CIS-sensitive parental MiaPaCa-2 cells (, Top panel, Right).
Figure 4. Changes in drug efflux transporters in primed PANC-1 and MiaPaCa-2 cell lines by Flow Cytometry. (A) Staining for MRP-1 (ABCC1), ABCG2, MDR-1 (ABCB1), and ABCB5 drug efflux transporters in parental PANC-1 and MiaPaCa-2 cell lines and their CIS-resistant (CR) derivatives (Top panel). CR cells showed significantly increased MFI of MRP-1 (p < .004), ABCG2 (p < .002), MDR-1 (p < .001), and ABCB5 (p < .001) compared to CIS-sensitive parental PANC-1 cells. CR MiaPaCa-2 (MiaPaCa-2-CR)also showed significantly increased MFI of MRP-1 (p < .004) and ABCG2 (p < .04) compared to CIS-sensitive parental MiaPaCa-2 cells. (Middle and Bottom panelsB Differential expression of MRP-1, ABCG2, MDR-1, and ABCB5 in BATs primed PANC-1 and MiaPaCa-2 cells. BATs primed PANC-1 cells showed slight reduction in all four transporter pumps but the difference was not statistically significant. BATs primed CR PANC-1 (PANC1-CR) showed significantly reduced MRP-1 (p < .003), ABCG2 (p < .05), and MDR-1 (p < .04) compared to CIS-sensitive parental PANC-1 cells while ABCB5 slightly increased. BATs primed MiaPaCa-2 parental and Mia-CR showed no change in MRP-1, ABCG2, MDR-1, and ABCB5 expression. (B) Rhodamine 123 uptake assay. Parental and CIS-resistant PANC-1 and MiaPaCa-2 pancreatic cancer cell lines primed with BATs show high cellular uptake and retention of Rhodamine 123 compared to unprimed (UP)parental and CIS-resistant PANC-1 (Left panel) and MiaPaCa-2 (Right panel) cell lines. High fluorescence (elevated MFI) after priming with BATs suggest decreased activities of efflux transporters, MRP-1, and MDR-1
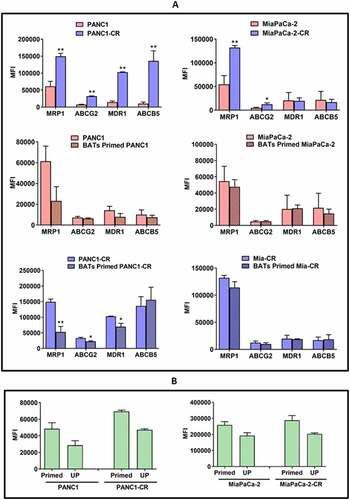
Since priming of pancreatic cancer cell lines with BATs show enhanced cytotoxicity, we asked if priming with BATs can affect the expression of drug efflux transporters. One hour priming with BATs of PANC-1 parental cells resulted in decreased MFI of MRP-1 (from 71685 to 32876; decreased by 54%), ABCG2 (from 7975 to 6723; decreased by 15.7%), MDR-1 (from 16855 to 10163; decreased by 39.7%), and ABCB5 (from 13295 to 8856;, decreased by 33.3%) with percent decrease ranging from 15.7–54%. In PANC1-CR, MFI decreased from 155487 to 65247 (decrease of 58%) for MRP-1(p < .003), 31595 to 23803 (decrease of 24%) for ABCG2 (p < .05), 103431 to 77172 (25.3%) for MDR-1(p < .04) while ABCB5 slightly increased after priming with BATs (157109 to 184221), percent decrease ranged from ~24-58% (, Middle and Lower panels, Left).
EGFR-BATs primed MiaPaCa-2 did not result in decreased expression of MRP-1, ABCG2, MDR-1, and ABCB5 compared to unprimed parental MiaPaCa-2 cells. Likewise, no changes were observed for MRP-1, ABCG2, MDR-1, and ABCB5 in MiaPaCa-2-CR cells after priming with EGFR-BATs compared to unprimed MiaPaCa-2-CR cells (, Middle and Lower panels, Right).
Next, we determined the functional activity of MDR in a flow cytometry based Rhodamine 123 uptake assay (). High cellular uptake and retention of Rhodamine 123 (high fluorescence) was found in EGFR-BATs primed parental, PANC1-CR, and MiaPaCa-2-CR pancreatic cancer cell lines which suggests reduced MRP-1 and MDR-1 activity. Unprimed parental, PANC1-CR (, Left), and MiaPaCa-2-CR (, Right) cell lines efflux the Rhodamine 123 dye readily, indicated by low fluorescence and suggestive of high MRP-1 and MDR-1 activity.
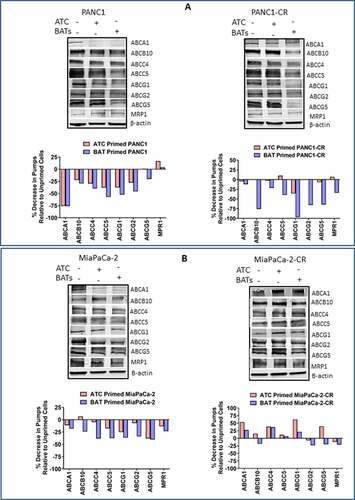
Priming with EGFR-BATs Modulates ABC Transporter. ATCs, EGFR-BATs primed or unprimed parental, PANC1-CR, and MiaPaCa-2-CR cell lines were tested for expression of ABCA1, ABCB10, ABCC4, ABCC5, ABCG1, ABCG2, ABCG5, and MRP-1 by western blotting. Data from a representative experiment is shown in . Parental PANC-1. Most of the ABC transporters were down regulated by 20–75% after priming of parental PANC-1 with ATC or EGFR-BATs compared to unprimed PANC-1 cells. Expression of ABCA1 was markedly reduced by 75.9%, ABCC4 by 39.5%, ABCC5 by 57%, ABCG1 by 52.3%, and ABCG2 by 45.7% after priming of PANC-1 cancer cells for 1 hour with EGFR-BATs when normalized to unprimed PANC-1 cells. Comparably reduced expression levels were observed after priming of parental PANC-1 with ATC (. Left, Upper and Bottom panels). PANC1-CR. Interestingly, PANC1-CR cells were more susceptible for immune sensitization compared to parental PANC-1 cells. Expression of pumps were drastically down-regulated for ABCB10 (75.7%), ABCG1 (97.2%), ABCG2 (65.6%), and ABCG5 (64.3%) after priming of PANC1-CR with EGFR-BATs. In contrast, no changes were observed after priming of PANC1-CR cells with ATC except for ABCG1 that was reduced by 36% (. Right, Upper and Bottom panels). Parental MiaPaCa-2. Expression of all eight ABC transporters were downregulated in parental MiaPaCa-2 cells primed with EGFR-BATs, percent reduction ranged from 18.4–40.3%. Similar to the PANC-1 cell line, ABCC4 (38.2%), ABCC5 (37.5%), ABCG1 (36.4%), ABCG2 (34%), and ABCG5 (40.3%) expression levels were markedly reduced compared to smaller reductions seen in ABCA1 (18.4%), ABCB10 (24.1%), and MPR1 (23.3%) after priming of MiaPaCa-2 cells with EGFR-BATs (. Left, Upper and Bottom panels). MiaPaCa-2-CR. Unlike PANC-1-CR cells, MiaPaCa-2-CR cells were more resistant to sensitization by EGFR-BATs. Only 4 of 8 ABC transporters (MRP-1, ABCG2, ABCG5, and ABCB10) showed mild decreases in expression ranging from 18-23% and 4 of 8 ABC transporters (ABCA1, ABCC4, ABCC5 and ABCG1) showed slight to moderate increases in expression ranging 6.8–36.6% after priming with EGFR-BATs. Priming with ATC showed down regulation of 2 of 8 pumps but showed increased expression in 6 of 8 pumps (. Right, Upper and Bottom panels). Together, these data suggest that decreased drug efflux activity of pancreatic cancer cell lines after priming with EGFR-BATs may lead to higher intracellular of levels drug, increased drug retention and increased drug mediated cytotoxicity of pancreatic cancer cells.
Figure 5. Western Blot Analysis for ABC Trasporter Pumps. (A) Expression of ABCA1, ABCB10, ABCC4, ABCC5, ABCG1, ABCG2, ABCG5, and MRP-1 efflux transporters in unprimed or BATs/ATC primed parental (Top, Left panel) and CIS-resistant PANC-1 (Top, Right panel) pancreatic cancer cell lines. (Bottom panels) Percent decrease in efflux transporters in ATC or BATs primed PANC-1 or ATC or BATs primed PANC1-CR pancreatic cancer cell lines relative to unprimed cancer cells. (B) Expression of ABCA1, ABCB10, ABCC4, ABCC5, ABCG1, ABCG2, ABCG5, and MRP-1 efflux transporters in unprimed or BATs/ATC primed parental (Top, left panel) and CIS-resistant MiaPaCa-2 (Top, Right panel) pancreatic cancer cell lines. (Bottom panels)Percent decrease in efflux transporters in ATC or BATs primed MiaPaCa-2 or ATC or BATs primed MiaPaCa-2-CR pancreatic cancer cell lines relative to unprimed cancer cells. Lanes, left to right: Lane 1, corresponding parental or resistant cell line; lane 2, ATC primed cell line; lane 3, BATs primed cell line for all four blots. For quantitative western blot analysis, data was normalized with β-actin for equal loading of proteins, relevant bands were cropped to combine into single figure
Discussion
Pancreatic cancer has the lowest survival rate of all cancers. Historically, chemotherapeutic responses for pancreatic cancer are either short or the tumors develop resistance to regimens such as cisplatin, docetaxel, paclitaxel, gemcitabine, and 5-FU.Citation25 The development of MDR leads to dismal median overall survival in patients with locally advanced and metastatic pancreatic cancer.Citation26 We have recently reported that a metastatic pancreatic cancer patient developed complete clinical response after restarting the same 5-FU dose of chemotherapy which the patient was receiving prior to infusions of EGFR-BATs.Citation4 This study shows that: 1) EGFR-BATs effectively killed parental and chemotherapy resistant tumor cells; 2) sequential targeting by HER2-BATs followed by EGFR-BATs increased tumor killing; 3) priming of the tumor cells with EGFR-BATs or HER2-BATs can “sensitize” parental tumor lines or their drug resistant derivatives for effective killing by chemotherapy drug at doses as low as 25% of the IC50 dose; 4) priming with BATs downregulates expression of MDR related proteins responsible for chemo drug efflux; and 5) EGFR-BATs can target CSC in a 3D tumorsphere model.
Drug resistance (both intrinsic and acquired) is thought to be a major reason for the limited benefit of most pancreatic cancer therapies.Citation27 MDR is mediated by various mechanisms involving numerous proteins belonging to a larger family of the ATP-binding cassette (ABC) transporter superfamily that play key roles in drug efflux and MDR.Citation14 ABC transporters, such as MRP-1 (ABCC1), MRP-5 (ABCC5), ABCG2, and MDR-1 are shown to confer resistance to pancreatic cancer against common chemotherapeutic drugs.Citation17,Citation25 Overexpression of drug efflux pumps leads to decreased intracellular drug accumulation which contributes to drug resistance.Citation28 Our data shows that priming cancer cells with BATs results in enhanced cytotoxicity by chemotherapy drug and decreased expression of MRP-1, ABCG2, MDR-1, and ABCC5 in both parental and CIS-resistant PANC-1 cell lines by flow cytometry. In MiaPaCa-2 cells, enhanced cytotoxicity was observed by chemotherapy drug after priming with BATs but expression of drug efflux pumps increased after priming. These data suggest the possibility that increased expression of drug transporters in BATs primed tumor cells may enhance in vivo sensitivity for immunotherapy based on the fact that these pumps can transport intracellular peptides for major histocompatibility complex class I antigen presentation.Citation29 Since we did not see decrease in efflux transporters in MiaPaCa-2 cells, we hypothesized that enhanced cytotoxic effect of chemotherapy in BATs sensitized MiaPaCa-2 is likely due to IFN-γ released during tumor cells' engagement by BATs. To validate our hypothesis, we tested culture supernatant from MiaPaCa-2 and BATs co-culture, to prime freshly plated MiaPaCa-2 cells followed by washing and adding 25% or 50% lower dose of IC50 CIS concentrations, which showed enhanced cytotoxicity compared to unprimed MiaCaPa-2 cells (Fig. S2). Previous studies have shown that nonspecifically activated CD4+ T cells chemosensitize tumor cells and IFN-γ was shown to play a major role. Since Th1 cytokines are released during BATs mediated killing of tumor cells, it is likely that Th1 cytokines modulate the tumor microenvironment to enhance endogenous cellular and humoral anti-tumor immune responses and may sensitize the tumor for enhanced, subsequent chemotherapeutic responsiveness.Citation30
Chemoresistant MiaPaCa-2 and L3.6 cell lines showed an increased proportion of CSC (EpCam+/CD44+/CD24+) compared to the parental cells lines. Interestingly, both CIS- and GEM-resistant MiaPaCa-2 and L3.6 cell lines also showed increased expression of targetable HER2 and ABCG2. These data are consistent with previous studies that ABCG2 expression was shown to be correlated with CSC characteristics involving malignant behaviors in pancreatic cancer, hepatocellular carcinoma, and glioblastoma, and likely that ABCG2 expression correlates with malignant CSC phenotypes.Citation23,Citation24,Citation31,Citation32
Our findings are consistent with previous studies that have shown increased efficacy of chemotherapy post-immunotherapy in various tumor types, with checkpoint inhibitors compared to those without prior immunotherapy by measuring progression free survival, overall survival, and response rate.Citation5–7,Citation9,Citation10 In summary, we have showed that BATs can kill both chemosensitive and chemoresistant tumor cells and pretreatment or “priming” of the tumor with BATs lowers the threshold for effective cytotoxic doses. These findings can be used to design sequential combinations of BATs, checkpoint inhibitors, and chemotherapy to optimize tumor killing by maximizing chemotherapy effects after BATs therapy while stimulating the endogenous immune system with checkpoint inhibitors.
Conflicts of Interest
AT is co-founder of Nova Immune Platform Inc.; LGL is co-founder of TransTarget Inc.; LGL is on the SAB for Rapa Therapeutics. JU, ENT, AS, TML and DLS have no conflicts of interest.
Originality disclosure
The data presented in this manuscript are original and have not been published elsewhere except in the form of abstracts and poster presentations at symposium and meetings.
Supplemental Material
Download ()Supplementary material
Supplemental data for this article can be accessed on the publisher’s website
Additional information
Funding
References
- Siegel RL, Miller KD, Jemal A. Cancer statistics, 2018. CA Cancer J Clin. 2018;68(1):7–12. doi:10.3322/caac.21442.
- Weledji EP, Enoworock G, Mokake M, Sinju M. How Grim is Pancreatic Cancer? Oncol Rev. e-pub ahead of print 2016/07/30. 2016;10(1):294. doi:10.4081/oncol.2016.294.
- Gnanamony M, Gondi CS. Chemoresistance in pancreatic cancer: emerging concepts. Oncol Lett. e-pub ahead of print 2017/04/30. 2017;13(4):2507–2513. doi:10.3892/ol.2017.5777.
- Lum LG, Thakur A, Choi M, Deol A, Kondadasula V, Schalk D, Fields K, Dufrense M, Philip P, Dyson G, et al. Clinical and immune responses to anti-CD3 x anti-EGFR bispecific antibody armed activated T cells (EGFR BATs) in pancreatic cancer patients. Oncoimmunology. 2020;9(1):1773201. e-pub ahead of print 2020/09/18. doi:10.1080/2162402X.2020.1773201.
- Hadash-Bengad R, Hajaj E, Klein S, Merims S, Frank S, Eisenberg G, Yakobson A, Orevi M, Caplan N, Peretz T, et al. Immunotherapy Potentiates the Effect of Chemotherapy in Metastatic Melanoma-A Retrospective Study. Front Oncol e-pub ahead of print 2020/03/03. 2020;10:70. doi:10.3389/fonc.2020.00070.
- Kato K, Narita Y, Mitani S, Honda K, Masuishi T, Taniguchi H, Kadowaki S, Ura T, Ando M, Tajika M, et al. Efficacy of Cytotoxic Agents After Progression on Anti-PD-(L)1 Antibody for Pre-treated Metastatic Gastric Cancer. Anticancer Res. 2020;40(4):2247–2255. e-pub ahead of print 2020/04/03. doi:10.21873/anticanres.14187.
- Wheeler CJ, Das A, Liu G, Yu JS, Black KL. Clinical responsiveness of glioblastoma multiforme to chemotherapy after vaccination. Clin Cancer Res. e-pub ahead of print 2004/08/26. 2004;10(16):5316–5326. doi:10.1158/1078-0432.CCR-04-0497.
- Gribben JG, Ryan DP, Boyajian R, Urban RG, Hedley ML, Beach K, Nealon P, Matulonis U, Campos S, Gilligan TD, et al. . Unexpected association between induction of immunity to the universal tumor antigen CYP1B1 and response to next therapy. Clin Cancer Res. 2005;11(12):4430–4436. e-pub ahead of print 2005/06/17. doi:10.1158/1078-0432.CCR-04-2111.
- Antonia SJ, Mirza N, Fricke I, Chiappori A, Thompson P, Williams N, Bepler G, Simon G, Janssen W, Lee J-H et al. Combination of p53 cancer vaccine with chemotherapy in patients with extensive stage small cell lung cancer. Clin Cancer Res. 2006 e-pub ahead of print 2006/02/10;12(3):878–887. doi:10.1158/1078-0432.CCR-05-2013.
- Arlen PM, Gulley JL, Parker C, Skarupa L, Pazdur M, Panicali D, Beetham P, Tsang KY, Grosenbach DW, Feldman J, et al. A randomized phase II study of concurrent docetaxel plus vaccine versus vaccine alone in metastatic androgen-independent prostate cancer. Clin Cancer Res. 2006;12(4):1260–1269. e-pub ahead of print 2006/02/21. doi:10.1158/1078-0432.CCR-05-2059.
- Itamochi H, Kigawa J, Terakawa N. Mechanisms of chemoresistance and poor prognosis in ovarian clear cell carcinoma. Cancer Science. 2008;99(4):653–658. doi:10.1111/j.1349-7006.2008.00747.x. e-pub ahead of print 2008/04/02
- Coley HM. Mechanisms and strategies to overcome chemotherapy resistance in metastatic breast cancer. Cancer Treat Rev. 2008;34(4):378–390. doi:10.1016/j.ctrv.2008.01.007. e-pub ahead of print 2008/03/28
- Adamska A, Falasca M. ATP-binding cassette transporters in progression and clinical outcome of pancreatic cancer: what is the way forward? World J Gastroenterol. 2018;24(29):3222–3238. doi:10.3748/wjg.v24.i29.3222. e-pub ahead of print 2018/08/10
- Schinkel AH, Jonker JW. Mammalian drug efflux transporters of the ATP binding cassette (ABC) family: an overview. Adv Drug Deliv Rev. 2003;55(1):3–29. doi:10.1016/s0169-409x(02)00169-2. e-pub ahead of print 2003/01/22
- Kruh GD, Belinsky MG. The MRP family of drug efflux pumps. Oncogene. 2003;22(47):7537–7552. doi:10.1038/sj.onc.1206953. e-pub ahead of print 2003/10/25
- Lage H. An overview of cancer multidrug resistance: a still unsolved problem. Cell Mol Life Sci. 2008;65(20):3145–3167. doi:10.1007/s00018-008-8111-5. e-pub ahead of print 2008/06/27
- Konig J, Hartel M, Nies AT, Martignoni ME, Guo J, Buchler MW, Friess H, Keppler D. Expression and localization of human multidrug resistance protein (ABCC) family members in pancreatic carcinoma. Int J Cancer. 2005;115(3):359–367. doi:10.1002/ijc.20831. e-pub ahead of print 2005/02/03
- Sen M, Wankowski DM, Garlie NK, Siebenlist RE, Van Epps D, LeFever AV, Lum LG. Use of Anti-CD3 × Anti-HER2/neu Bispecific Antibody for Redirecting Cytotoxicity of Activated T Cells Toward HER2/neu+Tumors. J Hematother Stem Cell Res. 2001;10(2):247–260. doi:10.1089/15258160151134944.
- Thakur A, Lum LG. In Situ immunization by bispecific antibody targeted T cell therapy in breast cancer. Oncoimmunology. 2016;5(3):e1055061. doi:10.1080/2162402X.2015.1055061. e-pub ahead of print 2016/05/04
- Codony-Servat J, Rosell R. Cancer stem cells and immunoresistance: clinical implications and solutions. Transl Lung Cancer Res. 2015;4(6):689–703. doi:10.3978/j..2218-6751.2015.12.11. e-pub ahead of print 2016/01/23
- Zhang S, Zhang H, Ghia EM, Huang J, Wu L, Zhang J, Lam S, Lei Y, He J, Cui B, et al. Inhibition of chemotherapy resistant breast cancer stem cells by a ROR1 specific antibody. Proc Natl Acad Sci U S A. 2019;116(4):1370–1377. e-pub ahead of print 2019/01/10. doi:10.1073/pnas.1816262116.
- Prieto-Vila M, Takahashi RU, Usuba W, Kohama I, Ochiya T. Drug Resistance Driven by Cancer Stem Cells and Their Niche. Int J Mol Sci. 2017;18(12):2574. doi:10.3390/ijms18122574. e-pub ahead of print 2017/12/02
- Sasaki N, Ishiwata T, Hasegawa F, Michishita M, Kawai H, Matsuda Y, Arai T, Ishikawa N, Aida J, Takubo K, et al. Stemness and anti-cancer drug resistance in ATP-binding cassette subfamily G member 2 highly expressed pancreatic cancer is induced in 3D culture conditions. Cancer Sci. 2018;109(4):1135–1146. e-pub ahead of print 2018/02/15. doi:10.1111/cas.13533.
- Phi LTH, Sari IN, Yang YG, Lee SH, Jun N, Kim KS, Lee YK, Kwon HY. Cancer Stem Cells (CSCs) in Drug Resistance and their Therapeutic Implications in Cancer Treatment. Stem Cells Int. 2018;2018:5416923. e-pub ahead of print 2018/04/24. doi:10.1155/2018/5416923.
- Hagmann W, Jesnowski R, Lohr JM. Interdependence of gemcitabine treatment, transporter expression, and resistance in human pancreatic carcinoma cells. Neoplasia. 2010;12(9):740–747. doi:10.1593/neo.10576. e-pub ahead of print 2010/09/09
- Adamska A, Domenichini A, Falasca M. Pancreatic Ductal Adenocarcinoma: current and Evolving Therapies. Int J Mol Sci. 2017;18(7):1338. doi:10.3390/ijms18071338. e-pub ahead of print 2017/06/24
- Long J, Zhang Y, Yu X, Yang J, LeBrun DG, Chen C, Yao Q, Li M. Overcoming drug resistance in pancreatic cancer. Expert Opin Ther Targets. 2011;15(7):817–828. doi:10.1517/14728222.2011.566216. e-pub ahead of print 2011/03/12
- Zhou J, Liu M, Aneja R, Chandra R, Lage H, Joshi HC. Reversal of P-glycoprotein-mediated multidrug resistance in cancer cells by the c-Jun NH2-terminal kinase. Cancer Res. 2006;66(1):445–452. doi:10.1158/0008-5472.CAN-05-1779. e-pub ahead of print 2006/01/07
- Abele R, Tampe R. Moving the Cellular Peptidome by Transporters. Front Cell Dev Biol. 2018;6:43. e-pub ahead of print 2018/05/16. doi:10.3389/fcell.2018.00043.
- Radfar S, Wang Y, Khong HT. Activated CD4+ T cells dramatically enhance chemotherapeutic tumor responses in vitro and in vivo. J Immunol. 2009;183(10):6800–6807. doi:10.4049/jimmunol.0901747. e-pub ahead of print 2009/10/23
- Yang L, Shi P, Zhao G, Xu J, Peng W, Zhang J, Zhang G, Wang X, Dong Z,et al. Targeting cancer stem cell pathways for cancer therapy. Signal Transduct Target Ther. 2020;5(1):8. e-pub ahead of print 2020/04/17. doi:10.1038/s41392-020-0110-5.
- Beier D, Schulz JB, Beier CP. Chemoresistance of glioblastoma cancer stem cells–much more complex than expected. Mol Cancer. 2011;10(1):128. doi:10.1186/1476-4598-10-128. e-pub ahead of print 2011/10/13