
Abstract
Objective: This review sought to gain a comprehensive, up-to-date understanding of the epidemiology and cost and healthcare resource use (HCRU) burden of amyotrophic lateral sclerosis (ALS) in the US, at a patient and national level. Methods: A targeted literature review (TLR) to identify epidemiological evidence (prevalence, incidence, mortality, survival), and systematic literature review (SLR) to identify cost and HCRU data published since January 2016, were performed. MEDLINE databases and Embase searches were conducted in January 2021. Key congresses (2019–2020) and bibliographies of relevant SLRs were hand-searched. Two high-quality SLRs were reviewed for additional cost data published between January 2001–2015. Registry and database studies were prioritized for epidemiological evidence. To allow comparison between studies in this publication, only evidence from the US was considered, with costs inflated to the 2020/2021 cost-year and converted to US dollars. Results: Eight studies from the epidemiology TLR, and eighteen from the cost and HCRU SLR, were extracted. Reported ALS incidence in the US was ∼1.5 per 100,000 person-years, and point prevalence ranged from 3.84–5.56 per 100,000 population. Total US national costs spanned ∼$212 million-∼$1.4 billion USD/year, and variably consisted of direct costs associated with HCRU and indirect costs. Conclusions: The national cost of ∼$1.02 billion USD/year (estimated using a prevalence of 16,055 cases) best aligns with prevalence estimates found in the TLR (equating to ∼13,000–18,000 cases). However, large-scale, population-based studies are necessary to precisely assess US epidemiology of ALS and capture all costs needed to inform cost-effectiveness models and resource planning.
Introduction
Amyotrophic lateral sclerosis (ALS) is a severe, progressive disease, associated with high clinical burden. At present, there are three disease-modifying treatments (DMTs) approved for the treatment of ALS in the United States (US) (Citation1,Citation2). Riluzole and edaravone are used as first-line treatments, and the recently approved DMT, AMX0035, has been shown to slow ALS progression and extend survival (Citation2). However, none of these DMTs halt or reverse ALS progression (Citation1–6). Consequently, the clinical management and care required throughout the disease course currently leads to considerable cost and healthcare resource use (HCRU) burden for people with ALS, their families, and healthcare systems (Citation7–10).
Despite the high clinical burden, few studies have comprehensively examined the literature reporting on epidemiology, and cost and HCRU data, in ALS. Additionally, studies have generally been conducted in single centers using small datasets, limiting the generalizability of the results (Citation6). The epidemiology and associated economic burden of ALS is therefore not well understood at a national level. One recent systematic literature review (SLR) by Achtert and Kerkemeyer (2021) did identify cost-of-illness studies for ALS across multiple countries. However, the SLR did not consider epidemiological or HCRU evidence, which is important to understand the number of people affected by ALS and to accurately determine national economic burden (Citation6). As noted by the authors, another limitation of the SLR was the heterogeneous methods used between studies, which meant comparisons could not be drawn between countries. Therefore, the objective of this literature review was to gain a comprehensive and up-to-date understanding of the epidemiology and cost and HCRU burden of ALS, at a patient and national level, by building on recent high-quality evidence (Citation6). For this publication, only US evidence was considered, to allow comparisons across studies and to more accurately characterize ALS burden in the US population.
Methods
Literature reviews were conducted in January 2021 in accordance with a pre-specified protocol and the Preferred Reporting Items for Systematic Review and Meta-Analysis (PRISMA) guidelines. A targeted literature review (TLR) was undertaken to identify epidemiological evidence, and an SLR was used to identify cost and HCRU data.
Evidence identification
Electronic database searches were conducted on January 4th, 2021 in MEDLINE and Embase databases. Hand-searches of relevant congresses from the previous two years (2019/2020), and bibliographies of relevant SLRs and meta-analyses identified in database searches, were also conducted. For the cost and HCRU SLR, The University of York Center for Reviews and Dissemination (CRD) platform, International Health Technology Assessment Database, health technology assessment (HTA) body and economic websites were also searched. Full details of search strategies are presented in Tables S1–S5.
Table 1 Major contributions to direct costs in the US (USD).
Searches were initially limited to articles published during the last five years (published since January 2016) to identify the most recent data. Due to the scarce availability of recent cost data, a protocol amendment was implemented whereby two high quality SLRs (Achtert and Kerkemeyer 2021; Gladman and Zinman 2015, appraised using the AMSTAR [A Measurement Tool to Assess Systematic Reviews] 2 checklist) (Citation11), were reviewed to identify additional cost data published between January 2001 − January 2016 (Citation6,Citation12).
Study selection
Articles were screened for relevance against pre-defined eligibility criteria (Table S6, Supplementary Methods). The epidemiology TLR included studies reporting on ALS incidence, prevalence, survival and mortality outcomes. Only registry and database studies were extracted to ensure that the most robust and high-quality epidemiological evidence was identified. The cost and HCRU SLR included studies reporting cost and HCRU data. The results presented in this publication are limited to epidemiological, cost and HCRU evidence from the US.
Data extraction and quality assessment
Data from included studies were extracted into a pre-specified grid. For studies included from the two reference SLRs, only cost data reported in the SLR publications themselves, not the primary articles, were extracted (Citation6,Citation12). To facilitate comparison across studies, all costs were inflated to the 2020/2021 cost-year and exchanged to US dollars (USD) using an online currency converter on 13th May 2022 (Citation13). Quality of epidemiological studies was assessed using a modified version of the Alberta Heritage Foundation for Medical Research checklist (Citation14). Quality assessments for cost and HCRU studies were not conducted as no validated quality assessment tool exists to the authors’ knowledge. Further details of data extractions and quality assessments are in the Supplementary Methods.
Results
Characteristics of included studies
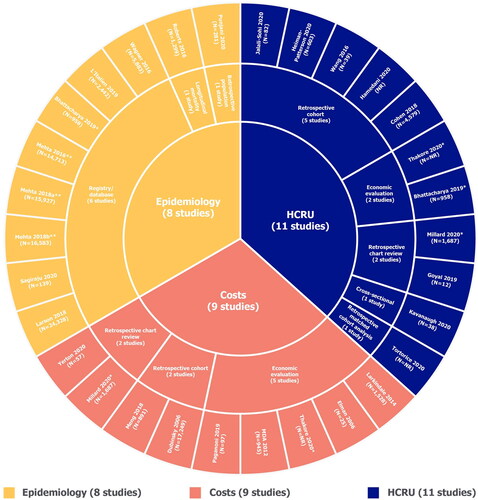
Ten US articles from the epidemiology TLR were extracted (). For the cost and HCRU SLR, 18 US articles, 9 of which provided cost data and 11 of which reported HCRU data, were extracted (). This included two articles that were identified from the reference SLRs (Achtert and Kerkemeyer 2021; Gladman and Zinman 2015). Study types are summarized in , with full study characteristics in Table S7.
Figure 1 PRISMA flowcharts. ALS: amyotrophic lateral sclerosis; EMBASE: excerpta medica database; HCRU: healthcare resource use; HTA: health technology assessment; INAHTA: international network of agencies of health technology assessment; MEDLINE: medical literature analysis and retrieval system online; NHS-EED: national health service economic evaluation database; PRISMA: preferred reporting items for systematic reviews and meta-analyses; PRO: patient-reported outcome; QoL: quality of life; RCT: randomized controlled trial; SLR: systematic literature review; TLR: targeted literature review; US: United States. For the epidemiology TLR, registry/database studies were prioritized for extraction; data from small single-center studies and other less-robust study types were deprioritised. Flowcharts include all articles identified in the TLR, including some studies relevant to outcomes not presented in this publication. For a complete list of outcomes and eligibility criteria applicable to the review, see Table S6.
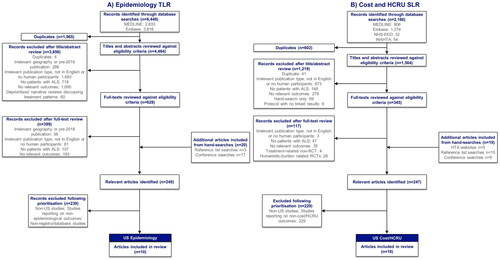
Figure 2 Summary of study designs. HCRU: healthcare resource use; MDA: muscular dystrophy association. *These studies were included in multiple evidence streams. **All articles by Mehta et al. are part of the ongoing CDC National ALS Registry surveillance project and are therefore considered as one study. MDA (Citation9) and Larkindale et al. (Citation7) were identified from high quality SLRs (Citation6, Citation12).
Quality assessment of epidemiology studies
The results of quality assessments are summarized in Table S8. All included studies from the epidemiology TLR (n = 8) clearly described the research objectives, used an appropriate study design (registry/database studies), used well-defined and robust outcome measures, and made conclusions supported by evidence (Citation15–24). However, four studies did not control for key confounding domains, such as differences in patient baseline characteristics (Citation18–21,Citation23,Citation24). Two further studies only partially controlled (i.e. did not control for all known confounding domains or the method for controlling was not adequately described) for confounders of reported epidemiological outcomes (Citation15,Citation16).
Incidence and prevalence of ALS
Incidence of ALS in the US was reported by two studies, at a similar rate of 1.54 and 1.52 per 100,000 person-years (Citation21,Citation24). Four studies reported either point (measured at a specific time point) or period (measured over a time period) prevalence estimates (). One-year period prevalence estimates ranged from 3.84–5.56 per 100,000 population, across a study conducted in the Atlanta metropolitan area between 2009–2011 (Citation21), a 2009 surveillance study covering three states and eight metropolitan areas (Citation24), and a National ALS Registry data study conducted between 2010–2015 (Citation18–20). In a fourth retrospective study using medical claims from patients with Medicare coverage, Bhattacharya et al. (2019) estimated a non-adjusted, 5-year period prevalence (2007–2011) of 20.5 per 100,000 population and point prevalence (2011) of 11.8 per 100,000 population (age-adjusted values in ) (Citation15). In the study of patients from the Atlanta metropolitan area, ALS prevalence increased over time by 0.51 per 100,000 population, between 2009–2011 (Citation21). National ALS Registry data demonstrated an increase in prevalence from 4.3–5.2 per 100,000 population between 2010–2015, though authors noted this likely reflected improved case ascertainment over time (Citation18–20).
Figure 3 ALS prevalence, including stratification by sex, race/ethnicity and age. ALS: amyotrophic lateral sclerosis. Point prevalence refers to the proportion of a population with ALS at a specific time point. Period prevalence refers to the proportion of ALS cases at any point during the period of interest. Refer to Table S7 for details regarding design of each study (e.g. retrospective cohort, database/registry study). Both Punjani 2020 and Wagner 2016 deliberately over-represented racial/ethnic minorities in the study catchment areas. A) Overall unadjusted prevalence reported for Bhattacharya 2019; direct age-adjusted point prevalence for 2011 = 9.7 per 100,000 population; direct age-adjusted period prevalence for 2007–2011 = 15.1 per 100,000 population.
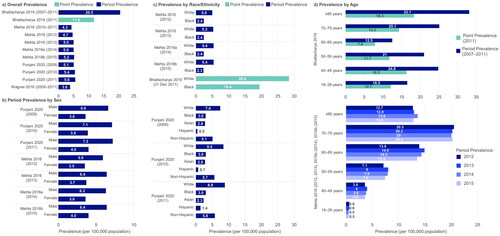
Four studies reported incidence (n = 1) or prevalence (n = 4) estimates by subpopulations. In Punjani et al. (2020), incidence and prevalence estimates were at least 1.5 times higher in males compared with females (incidence: 1.88 vs 1.21 per 100,000 person-years; prevalence: see ) (Citation21). In three studies stratifying incidence (n = 1) or prevalence (n = 3) of ALS by race/ethnicity, estimates were highest in the White population (incidence: 2.46 per 100,000 person-years; prevalence: see ) as compared with other racial/ethnic groups (Citation15,Citation18–21). Average incidence estimates were at least 2.6 and 3.9 times lower in Black and Asian populations compared with the White population, respectively (0.94 and 0.62 per 100,000 person-years) (Citation21). Incidence estimates were more than three times higher in a non-Hispanic group compared to Hispanic (1.66 vs 0.47 per 100,000 person-years) (Citation21). A registry study conducted over a 14-year period also identified US veterans as a subgroup with high ALS prevalence (19.7 per 100,000 population) (Citation23).
Two studies stratified prevalence estimates by age (). Using data from the National ALS Registry between 2012–2015, Mehta et al. identified increasing period prevalence with age, finding the highest one-year period prevalence (between 20.0–20.5 per 100,000 population) in the second-oldest age group (70–79 years), then a slight decrease in those ≥80 years (between 12.7–13.6 per 100,000 population) (Citation18–20). Whereas, Bhattacharya et al. reported the highest point prevalence in those aged ≥80 years (18.3 per 100,000 population) followed by the second-youngest age group (40–49 years; 16.3 per 100,000 population) (Citation15).
Mortality and survival
Mean, age-adjusted mortality rate for ALS was estimated as 1.7 per 100,000 population during 2011–2014 (age-adjusted to the 2000 US population), using data from the National Center for Health Statistics (Citation17). The rate remained relatively stable over the four-year period, ranging from 1.65–1.74 per 100,000 population (Citation17). The age-adjusted mortality rate increased with age and was highest in those aged 70–79 years (9.71 per 100,000 population) (Table S9). The only exception to this pattern was in the ≥80 years subgroup, where the mortality rate was 7.72 per 100,000 population (Citation17). The age-adjusted ALS mortality rate was reported to be higher in males, and in the White population as compared with Black, Hispanic, Non-Hispanic and ‘other’ racial/ethnic groups (Citation17). The National Longitudinal Mortality Study found that risk of death from ALS (adjusted for sex, socioeconomic status, health insurance, place of birth and presence of a Social Security number) was significantly higher for the White population compared with other subgroups (Relative to White: Black hazard ratio [HR]: 0.61 [p < 0.001]; Hispanic HR: 0.64 [p < 0.01]; Other races HR: 0.52 [p < 0.05]) (Citation17,Citation22).
Bhattacharya et al. and Punjani et al. reported median survival time as 12.8 months from the first ALS-related medical claim and 23.0 months from an ALS diagnosis, respectively (Citation15,Citation21). Punjani et al. found that survival time following diagnosis decreased with increasing age. The youngest age group (18–39 years) had the highest median survival time after diagnosis (54.5 months), reducing to 10.0 months for those aged ≥80 years (Table S9) (Citation21). There was no significant difference in median survival time between males and females (p = 0.09) (Citation21). Median survival time following diagnosis was reported to be higher in the Asian population compared with the White and Black populations (p = 0.38 across all subgroups). Those of Hispanic ethnicity had a higher survival time than non-Hispanic (p = 0.42; Table S9) (Citation21).
Cost and HCRU
Total costs
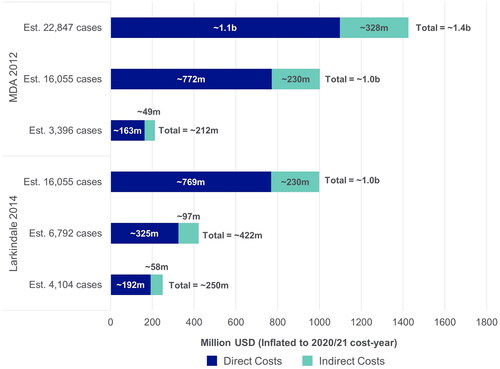
Larkindale et al. (2014) and The Muscular Dystrophy Association (MDA, 2012) reported US national annual costs related to ALS, calculated based on the sum of the total per patient costs (direct and indirect), from a societal perspective () (Citation7,Citation9). Both studies estimated costs using data from the same commercial insurance and Medicare claims database, and calculated values using low, moderate and high prevalence estimates from the literature (Citation7,Citation9). Accordingly, the reported national annual costs ranged from ∼$212 million USD (based on the lowest estimated prevalence of 3,396 patients) to ∼$1.4 billion USD (based on the highest estimated prevalence of 22,847 patients) (Citation9).
Figure 4 Estimated annual national costs. MDA: muscular dystrophy association; USD: United States dollars. Each study used three different prevalence estimates for the US to calculate annual costs. Societal perspective, considering all costs to society, including costs to patients, government and healthcare payers, sometimes reporting these separately. MDA 2012 (Citation9): 3396 Cases; Alčaz et al. 1996 (Citation47): 16,055 cases; Orphanet 2011 (Citation48): 22,847 cases; Worms 2011 (Citation49); Larkindale et al. 2014 (Citation7): 16,055 cases; Orphanet 2021 (Citation50): 6792 and 4104 cases; Wagner et al. 2012 (Citation51).
Direct and indirect costs
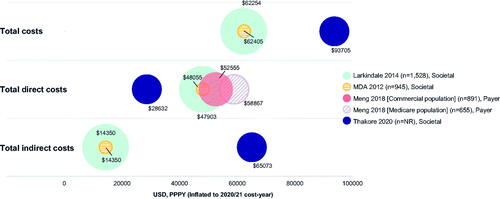
Three studies reported both direct and indirect costs from a societal perspective (Citation7,Citation9,Citation25). Larkindale et al. and The MDA reported that direct costs were higher than indirect costs, contributing 77% of total costs (direct ∼$48,000 vs indirect ∼$14,350 USD PPPY) () (Citation7,Citation9). However, in a cost-effectiveness framework study reporting only recurring costs, the opposite observation was described, with direct costs contributing 31% of total costs (direct $28,632 vs indirect ∼$65,073 USD PPPY) (Citation25).
Figure 5 Total overall, direct and indirect costs (USD, PPPY). MDA: muscular dystrophy association; PPPY: per patient per year; USD; United States dollars. Each bubble represents one study and bubble size represents the study sample size. Meng 2018 has two bubbles as total direct costs were reported separately for different insurance cohorts; total annual direct costs were extrapolated from monthly costs by multiplying by 12; the cost used was “average costs for months post-diagnosis” but different monthly costs were reported for the month of diagnosis and the month of death separately; Meng 2018 was conducted from the payer perspective and the costs reflect the amount paid by insurance companies. Furthermore, only medical costs were considered therefore the costs may not be reflective of overall total direct costs. Annual total direct and total indirect costs in Thakore 2020 were extrapolated from monthly costs by multiplying by 12 and using the average cost over four different disease stages; for total direct costs, only recurring costs were included; for total indirect costs, the human capital approach was used in that absenteeism was considered as a recurring cost beyond death; total overall costs were not reported for Thakore 2020, therefore were calculated by summing total direct and total indirect costs. Direct costs such include hospitalization costs, treatment costs, and non-hospital care costs; indirect costs include productivity loss (including caregiver productivity loss), home adaptations, and travel costs. Figure legend indicates what perspective the study used: Societal perspective, considering all costs to society, including costs to patients, government and healthcare payers, sometimes reporting these separately; Payer perspective, considering only costs to healthcare providers or insurance companies.
The highest drivers of direct costs, reported from a societal perspective, were inpatient (Citation7,Citation9,Citation26,Citation27), and non-medical costs, such as professional home health care or home/vehicle modifications (Citation7,Citation9,Citation25). Purchase of equipment/devices had the smallest contribution to overall direct costs (). No recent out-of-pocket (OoP) cost data for people with ALS in the US were identified in this review. High indirect costs associated with absenteeism were reported in a retrospective economic evaluation, which calculated the cost of missed work at ∼$21 USD/hour (Citation28). Three studies used different systems to measure ALS costs stratified by disease stage/milestone, with substantially higher costs reported for later-stage milestones as compared to earlier-stage milestones () (Citation25,Citation26,Citation29).
Table 2 Costs associated with different disease stages/milestones (USD).
HCRU associated with primary/secondary care and treatment
Retrospective analyses of insurance claims and patient charts revealed a variety of drivers of HCRU, including high proportions of patients requiring outpatient, hospital and emergency department visits (Citation15,Citation29,Citation30). With regards to treatment-related HCRU, a retrospective chart review demonstrated high DMT use in more than half of patients (Citation31). Further details on HCRU associated with ALS are in Table S9.
Discussion
To our knowledge, this is the first literature review to identify and summarize evidence on the epidemiology in conjunction with cost and HCRU associated with ALS in the US. Based on the evidence identified, the prevalence of ALS in the US is estimated to be between 3.84–5.56 per 100,000 population, which equates to around 13,000–18,000 cases, based on the 2020 Census US population (Citation18–21,Citation24,Citation32). Across two articles, total annual national costs reported ranged from ∼$212 million–∼$1.4 billion USD per year, depending on the estimate of ALS prevalence used (Citation7,Citation9). The prevalence value of 16,055 cases utilized in both reports, best aligns with the case number estimate identified through our epidemiology TLR, indicating total national costs are likely to be close to the reported value of ∼$1.02 billion USD (Citation7,Citation9).
Our review found variability in reported ALS prevalence estimates and a paucity of studies with large sample sizes estimating incidence. High prevalence and incidence estimates were reported for some ALS sub-populations in the US, including males, the White population, and US veterans, aligning with previous studies in non-US regions (Citation33–35). Healthcare access inequalities could underpin the variation in prevalence estimates within sub-populations, due to differences in socioeconomic status and potential under-representation of patients from certain racial/ethnic subgroups (Citation21). Consequently, it is possible that prevalence in nonwhite racial/ethnic subgroups may be underestimated in some studies. However, both studies by Punjani et al. (2020) and Wagner et al. (2016) deliberately over-represented racial/ethnic minorities in their studies. Punjani et al. nevertheless still found higher prevalence in the White sub-population than other racial groups, and Wagner et al. reported a similar overall prevalence to other studies (Citation21,Citation24). Another factor that may skew prevalence estimates is the age of the population; for example, Bhattacharya et al. (2019) reported substantially higher prevalence estimates compared with other studies, using data from case reports and medical records (Citation21,Citation24). This may be due to the study population having a Medicare Advantage prescription drug plan, meaning patients were likely older, and not representative of the overall ALS population (Citation15).
Conflicting evidence on whether prevalence of ALS is increasing over time was identified, which may be due to the different diagnostic criteria used and the limited time period (up to four years) over which data were collected (Citation18–21,Citation36). Given an increase in ALS prevalence could confer greater HCRU burden and associated costs, epidemiological data collected over longer time periods are needed. Longer-term patterns in ALS prevalence estimates may be identified using data from the US National ALS Registry, which began collecting data in 2010 (Citation37,Citation38).
The cost and HCRU SLR revealed many patients require frequent hospital, inpatient and outpatient visits, as well as other non-medical costs. The varied sources of HCRU and cost burden associated with ALS in the US are perhaps reflective of the heterogeneous symptoms and inexorable disease progression. Additionally, a small proportion of US patients have never seen a physician, which may be due to healthcare access inequalities, reservations about support from healthcare professionals for an incurable disease, or because the individual was not diagnosed until after death (Citation29). Therefore, if all people with ALS sought care from a physician, the associated cost and HCRU burden would likely be higher.
In some studies, total costs may be underestimated, due to under-recognition of indirect and OoP costs. For instance, two studies estimated indirect costs to be lower than direct costs, whereas Thakore et al. (2020), reported direct costs to be markedly lower than indirect costs. In this study, a human capital approach was utilized, where workplace absenteeism was considered a recurring indirect cost beyond death (Citation25), suggesting that studies overlooking such costs may be underestimating indirect costs. It should, however, be noted that Thakore et al. excluded one-off direct costs (e.g. wheelchair purchase), which may have led to lower direct cost estimates. Reported indirect costs may also be undervalued due to family members underestimating caregiving time and the challenges of measuring a patient’s lost income (Citation9). Further, no recent OoP cost data were identified; however, research from non-US regions has shown very high OoP costs associated with home renovations, medical equipment, transportation, co-payments and medication (Citation39–41). Given the differences in the US regarding healthcare coverage of OoP costs, US-based studies are needed to ensure accurate estimation of OoP expenses and indirect costs. These data would inform cost-of-illness modeling and ensure a better understanding of the true cost burden of ALS in the US. For cost-of-illness modeling, it is also important to understand the cost and HCRU burden as the disease progresses, as this impacts resource requirements at each stage. However, no US studies captured HCRU data stratified by disease stage, despite previous data from non-US regions consistently showing greater HCRU associated with increasing disease severity (Citation42–44).
Through identification of studies reporting on epidemiological, cost and HCRU outcomes, this literature review has expanded on previous work, building a more complete picture of ALS burden in the US, at both a national and patient level. By focusing on studies from the US, comparison between studies was possible. Inclusion of additional data from studies identified through reference SLRs ensured additional insights were captured, though the extraction of only cost data reported in the reference SLR publications themselves, may have meant that data from the original articles (published before January 2016), were missed. Insights were also somewhat limited by the small number of studies examining incidence, mortality and survival, and the few studies stratifying these by sex, age, race/ethnicity or site of onset of ALS symptoms (i.e. bulbar vs limb), which has been shown to be associated with survival times in non-US studies (Citation45,Citation46). Variability in identified prevalence estimates and under-recognition of indirect and OoP costs, in addition to heterogeneity in data reporting and study designs, undoubtedly impact the accurate determination of total costs associated with ALS. There is therefore a need for large-scale, prospective, population-based studies to provide an accurate picture of the epidemiological, cost and HCRU burden of ALS in the US. Such data would inform ongoing clinical trials and cost-effectiveness models for ALS treatments in the pipeline, and better support equitable healthcare resource planning.
Author contributions
Substantial contributions to study conception and design: MB, KB, ED, MM, UP, KRM, EW; substantial contributions to analysis and interpretation of the data: JDB, MB, KB, ED, MM, UP, KRM, NS, EW, THP; drafting the article or revising it critically for important intellectual content: JDB, MB, KB, ED, MM, UP, KRM, NS, EW, THP; final approval of the version of the article to be published: JDB, MB, KB, ED, MM, UP, KRM, NS, EW, THP.
Supplemental Material
Download MS Word (107.9 KB)Acknowledgements
The authors acknowledge Margarita Lens, MSc, UCB Pharma, Slough, UK, for publication coordination and Emma Warnants, MBiomed and Faye Bolan, PhD from Costello Medical, UK, for medical writing and editorial assistance based on the authors’ input and direction. This literature review was funded by UCB Pharma.
Disclosure statement
This literature review was funded by UCB Pharma and medical writing services were provided by Costello Medical. JB: research support from Biogen, MT Pharma of America, MT Pharma Holdings of America, Transposon Therapeutics, Alexion, Rapa Therapeutics, nQ Medical, ALS Association, Muscular Dystrophy Association, ALS One, Tambourine, and ALS Finding a Cure; paid member of an advisory panel for Regeneron, Biogen, Clene Nanomedicine, MT Pharma of America, MT Pharma Holdings of America, Janssen, and RRT; received an honorarium for an educational event for Projects in Knowledge; unpaid roles on advisory boards for the non-profits Everything ALS and ALS One; MB: employee of UCB Pharma; KB: employee and stockholder of UCB Pharma; ED: employee of Costello Medical; MM: employee of Costello Medical; UP: employee of UCB Pharma; shareholder of Bavarian Nordic and Novo Nordisk; KR-M: employee of UCB Pharma at time of study; NS: employee and stockholder of UCB Pharma; EW: employee of Costello Medical; TH-P: clinical trials funded by Mitsubishi Tanabe Pharma America, Amylyx, Healy Platform Trial, Cytokinetics, and AB Sciences; clinical research funded by Mitsubishi Tanabe Pharma and Target ALS.
Data availability statement
The data supporting the conclusions of this article are included within the article and its additional files. Full search results available on reasonable request.
Additional information
Funding
References
- Bardhan N, Tadwalkar S. Amyotrophic lateral sclerosis. Clarivate Research Reports; 2021.
- Paganoni S, Macklin EA, Hendrix S, Berry JD, Elliott MA, Maiser S, et al. Trial of sodium phenylbutyrate–taurursodiol for amyotrophic lateral sclerosis. N Engl J Med. 2020;383:919–30.
- Cruz MP. Edaravone (Radicava): a novel neuroprotective agent for the treatment of Amyotrophic Lateral Sclerosis. P T. 2018;43:25–8.
- Miller RG, Mitchell JD, Lyon M, Moore DH. Riluzole for Amyotrophic Lateral Sclerosis (ALS)/Motor Neuron Disease (MND). Amyotroph Lateral Scler Other Motor Neuron Disord. 2003;4:191–206.
- Lacomblez L, Bensimon G, Leigh PN, Guillet P, Meininger V, Amyotrophic Lateral Sclerosis/Riluzole Study Group II. Dose-ranging study of riluzole in amyotrophic lateral sclerosis. amyotrophic lateral sclerosis/riluzole study group II. The Lancet. 1996;347:1425–31.
- Achtert K, Kerkemeyer L. The economic burden of amyotrophic lateral sclerosis: a systematic eeview. Eur J Health Econ. 2021;22:1151–66.
- Larkindale J, Yang W, Hogan PF, Simon CJ, Zhang Y, Jain A, et al. Cost of illness for neuromuscular diseases in the United States. Muscle Nerve. 2014;49:431–8.
- Moore A, Young CA, Hughes DA. Health utilities and costs for motor neurone disease. Value Health. 2019;22:1257–65.
- Muscular Dystrophy Association [MDA]. Cost of amyotrophic lateral sclerosis, muscular dystrophy, and spinal muscular atrophy in the United States. Muscular Dystrophy Association, The Lewin Group Inc. 2012.
- Institute for Clinical and Economic Review (ICER). ICER publishes evidence report on treatments for amyotrophic lateral sclerosis 2022. https://icer.org/news-insights/press-releases/icer-publishes-evidence-report-on-treatments-for-amyotrophic-lateral-sclerosis/
- Shea BJ, Reeves BC, Wells G, Thuku M, Hamel C, Moran J, et al. AMSTAR 2: a critical appraisal tool for systematic reviews that include randomised or non-randomised studies of healthcare interventions, or both. BMJ. 2017;358:j4008.
- Gladman M, Zinman L. The economic impact of amyotrophic lateral sclerosis: a systematic review. Expert Rev Pharmacoecon Outcomes Res. 2015;15:439–50.
- XE Currency Converter. XE foreign currency converter. https://www.xe.com/currencyconverter/
- Kmet LM, Cook LS, Lee RC. Standard quality assessment criteria for evaluating primary research papers from a variety of fields. Edmonton: Alberta Heritage Foundation for Medical Research; 2004.
- Bhattacharya R, Harvey RA, Abraham K, Rosen J, Mehta P. Amyotrophic lateral sclerosis among patients with a medicare advantage prescription drug plan; prevalence, survival and patient characteristics. Amyotroph Lateral Scler Frontotemporal Degener. 2019;20:251–9.
- L'Italien GJ, Qureshi IA, Clark B, Simmons Z. Determinants of mortality among hospitalized patients with amyotrophic lateral sclerosis - results from the 2016 national inpatient sample. Neurology 2019;92(15): P4.4–017.
- Larson TC, Kaye W, Mehta P, Horton DK. Amyotrophic lateral sclerosis mortality in the United States, 2011-2014. Neuroepidemiology 2018;51:96–103.
- Mehta P, Kaye W, Raymond J, Punjani R, Larson T, Cohen J, et al. Prevalence of amyotrophic lateral sclerosis - United States, 2015. MMWR Morb Mortal Wkly Rep. 2018;67:1285–9.
- Mehta P, Kaye W, Raymond J, Wu R, Larson T, Punjani R, et al. Prevalence of amyotrophic lateral sclerosis - United States, 2014. MMWR Morb Mortal Wkly Rep. 2018;67:216–8.
- Mehta P, Kaye W, Bryan L, Larson T, Copeland T, Wu J, et al. Prevalence of amyotrophic lateral sclerosis - United States, 2012-2013. MMWR Surveill Summ. 2016;65:1–12.
- Punjani R, Wagner L, Horton K, Kaye W. Atlanta metropolitan area amyotrophic lateral sclerosis (ALS) surveillance: incidence and prevalence 2009-2011 and survival characteristics through 2015. Amyotroph Lateral Scler Frontotemporal Degener. 2020;21:123–30.
- Roberts AL, Johnson NJ, Chen JT, Cudkowicz ME, Weisskopf MG. Race/ethnicity, socioeconomic status, and ALS mortality in the United States. Neurology 2016;87:2300–8.
- Sagiraju HKR, Zivkovic S, VanCott AC, Patwa H, Gimeno Ruiz de Porras D, Amuan ME, et al. Amyotrophic lateral sclerosis among veterans deployed in support of post-9/11 U.S. conflicts. Mil Med. 2020;185:e501–e509.
- Wagner L, Rechtman L, Jordan H, Ritsick M, Sanchez M, Sorenson E, et al. State and metropolitan area-based Amyotrophic Lateral Sclerosis (ALS) surveillance. Amyotroph Lateral Scler Frontotemporal Degener. 2015;17:128–34.
- Thakore NJ, Pioro EP, Udeh BL, Lapin BR, Katzan IL. A cost-effectiveness framework for amyotrophic lateral sclerosis, applied to riluzole. Value Health. 2020;23:1543–51.
- Meng L, Bian A, Jordan S, Wolff A, Shefner JM, Andrews J. Profile of medical care costs in patients with amyotrophic lateral sclerosis in the medicare programme and under commercial insurance. Amyotroph Lateral Scler Frontotemporal Degener. 2018;19:134–42.
- Elman LB, Stanley L, Gibbons P, McCluskey L. A cost comparison of hospice care in amyotrophic lateral sclerosis and lung cancer. Am J Hosp Palliat Care. 2006;23:212–6.
- Paganoni S, van de Rijn M, Drake K, Burke K, Doyle M, Ellrodt AS, et al. Adjusted cost analysis of video televisits for the care of people with amyotrophic lateral sclerosis. Muscle Nerve. 2019;60:147–54.
- Millard J, Raza SA, Boller E, Bauer E, Sullivan J, Apple S. PND125 real-world healthcare utilization, costs, and progression milestone patterns among ffs medicare patients newly diagnoses with amyotrophic lateral sclerosis. Value in Health. 2020;23:S283.
- Cohen B, Balcells C, Hotchkiss B, Aggarwal K, Karaa A. A retrospective analysis of health care utilization for patients with mitochondrial disease in the United States: 2008–2015. Orphanet J Rare Dis. 2018;13:210.
- Jalali-Sohi A, Darki L, Phan L, Beydoun S. A two-year retrospective chart review to evaluate demographics of amyotrophic lateral sclerosis patients attending a multidisciplinary clinic (5523). Neurology 2020;94:5523.
- United States Census Bureau. Quick Facts, United States. https://www.census.gov/quickfacts/fact/table/US/POP010220
- Chio A, Mora G, Moglia C, Manera U, Canosa A, Cammarosano S, Piemonte and Valle d’Aosta Register for ALS (PARALS), et al. Secular trends of amyotrophic lateral sclerosis: the piemonte and Valle d‘Aosta Register. JAMA Neurol. 2017;74:1097–104.
- Logroscino G, Piccininni M. Amyotrophic lateral sclerosis descriptive epidemiology: the origin of geographic difference. Neuroepidemiology 2019;52:93–103.
- Palese F, Sartori A, Verriello L, Ros S, Passadore P, Manganotti P, et al. Epidemiology of amyotrophic lateral sclerosis in friuli-venezia giulia, North-Eastern Italy, 2002-2014: a retrospective population-based study. Amyotroph Lateral Scler Frontotemporal Degener. 2019;20:90–9.
- Longinetti E, Fang F. Epidemiology of amyotrophic lateral sclerosis: an update of recent literature. Curr Opin Neurol. 2019;32:771–6.
- Mehta P, Raymond J, Punjani R, Han M, Larson T, Kaye W, et al. Prevalence of amyotrophic lateral sclerosis in the United States Using Established and Novel Methodologies, 2017. Amyotroph Lateral Sclero Frontotemporal Degener . 2022;15:1–9.
- Mehta P, Raymond J, Punjani R, Larson T, Bove F, Kaye W, et al. Prevalence of Amyotrophic Lateral Sclerosis (ALS), United States, 2016. Amyotroph Lateral Scler Frontotemporal Degener. 2022;23:220–5.
- Gladman M, Dharamshi C, Zinman L. Economic burden of amyotrophic lateral sclerosis: a Canadian study of out-of-pocket expenses. Amyotroph Lateral Scler Frontotemporal Degener. 2014;15:426–32.
- Nonoyama ML, McKim DA, Guerriere D, Coyte PC, Wasilewski M, Avendano M, et al. Healthcare Utilisation and Costs of Home Mechanical Ventilation. Thorax 2018;73:644–51.
- Schepelmann K, Winter Y, Spottke AE, Claus D, Grothe C, Schröder R, et al. Socioeconomic burden of amyotrophic lateral sclerosis, myasthenia gravis and facioscapulohumeral muscular dystrophy. J Neurol. 2010;257:15–23.
- Lopez-Bastida J, Perestelo-Perez L, Monton-Alvarez F, Serrano-Aguilar P, Alfonso-Sanchez JL. Social Economic Costs and Health-Related Quality of Life in Patients with Amyotrophic Lateral Sclerosis in Spain. Amyotroph Lateral Scler. 2009;10:237–43.
- Oh J, An JW, Oh S-I, Oh KW, Kim JA, Lee JS, et al. Socioeconomic costs of amyotrophic lateral sclerosis according to staging system. Amyotroph Lateral Scler Frontotemporal Degener. 2015;16:202–8.
- Schönfelder E, Osmanovic A, Müschen LH, Petri S, Schreiber-Katz O. Costs of Illness in Amyotrophic Lateral Sclerosis (ALS): a cross-sectional survey in Germany. Orphanet J Rare Dis. 2020;15:149.
- Chio A, Logroscino G, Hardiman O, Swingler R, Mitchell D, Beghi E, Eurals Consortium, et al. Prognostic factors in ALS: a critical review. Amyotroph Lateral Scler. 2009;10:310–23.
- Knibb JA, Keren N, Kulka A, Leigh PN, Martin S, Shaw CE, et al. A clinical tool for predicting survival in ALS. J Neurol Neurosurg Psychiatry. 2016;87:1361–7.
- Alčaz S, Jarebinski M, Pekmezović T, Stević‐Marinković Z, Pavlović S, Apostolski S. Epidemiological and clinical vharacteristics of ALS in Belgrade, Yugoslavia. Acta Neurol Scand. 1996;94:264–8.
- Orphanet. Orphanet Report Series: Prevalence of Rare Diseases: Bibliographic data. 2011. http://www.orpha.net/orphacom/cahiers/docs/GB/Prevalence_of_rare_diseases_by_alphabetical_list.pdf
- Worms PM. The epidemiology of motor neuron diseases: a review of recent studies. J Neurol Sci. 2001;191:3–9.
- Orphanet. Orphanet Report Series: Prevalence of Rare Diseases: Bibliographic data. 2012.
- Wagner L, Archer NP, Williamson DM, Henry JP, Schiffer R, Jackson CE. Prevalence of amyotrophic lateral sclerosis in Texas, 1998-2003. Tex Med 2012;108:e1-e.
- Dubinsky R, Chen J, Lai, SM. Trends in hospital utilization and outcome for patients with ALS: analysis of a large U.S. cohort. Neurology. 2006;67:777–80.