
Abstract
Various quality grades of high-quality cassava flour (HQCF) are found in markets due to the rapid increase in its utilization for product development. Therefore, this study assessed the chemical, functional and pasting properties and the microbial and aflatoxin content of HQCF being sold in Lusaka markets. Nine samples of HQCF (coded CM 01 to 09) were collected from supermarkets, one major open market, and one cassava processing centre. The samples were analyzed for chemical, functional and pasting properties and the microbial and aflatoxin content using standard laboratory methods. Samples CM 01, CM 08, and CM 09 had starch content above 60%, while CM 02 to CM 07 had starch slightly above 40%. The mean value of bulk density (BD) was 0.51 ± 25.49 g ml−1, dispersibility 68 ± 2.63%, swelling power (SP) 7.84 ± 0.76%, solubility index 135.80 ± 18.8%, and water absorption capacity (WAC) 6.28 ± 32.49%. The mean value for the peak viscosity was 437.46 ± 94.12 RVU, trough viscosity 217.55 ± 27.41 RVU, breakdown viscosity 219.91 ± 77.94 RVU, final viscosity 284.31 ± 29.96 RVU, and setback viscosity 66.77 ± 5.30 RVU. There was no detection of aflatoxins B1, B2, G1, and G2, especially aflatoxin B1 (AFB1) that belongs to group 1 carcinogens for humans. Bacteria colony counts in samples CM 02, CM 03, CM 07, and CM 09 were higher with CFU mg−1 of 2,280,000, 260,000, 200,000, and 510,000, respectively. The study’s information will guide the quality standard specifications, breeding programs, and end-use of HQCF.
PUBLIC INTEREST STATEMENT
The rapid increase in cassava flour usage for product development has led to increased demand, and various grades are available in the markets for human consumption. However, cassava flour needs to meet the high-quality requirements in terms of physicochemical characteristics, microbial safety, and cyanogenic glucoside content for its acceptability by the food industry. This study provided information on the chemical, functional, and pasting properties and the microbial and aflatoxin contamination of the cassava flour sold in the major markets of Lusaka, Zambia. The information could help develop and refine the quality standard specifications for high-quality cassava flour in Zambia for end-use.
1. Introduction
Cassava (Manihot esculenta Crantz) is one of Africa’s most important food crops because of its high adaptability to a wide range of ecological conditions (Abass, Citation2008; Adebayo et al., Citation2010, Citation2009; Alamu et al., Citation2019). It is also the second main food security crop after maize in Zambia (Abass, Citation2008; Arega et al., Citation2013). The cassava production is confined to the north and northwestern parts of Zambia and is exclusively produced for consumption (Sitko et al., Citation2013). In Zambia, small-scale farmers mainly grow cassava, 36% and 32% found in the Luapula and Northern provinces. Cassava also contributes 38% of Zambia’s total human consumption requirements and is a staple food for at least 30% of the population (Government of the Republic of Zambia (GRZ), Citation2010). Cassava can also contribute significantly to a healthy and nutritional diet if the suitable varieties are combined with the leaves’ consumption due to their high protein content. Over 800,000 tons of cassava produced in Zambia is for home consumption (Government of the Republic of Zambia (GRZ), Citation2010). However, only 8% of the produced crop is marketed for income (Sitko et al., Citation2013). The cassava’s identified benefits include its use as a significant source of needed revenue for most farmers in cassava-growing sub-Saharan Africa (SSA) areas, increased employment opportunities for those engaged in cassava processing, and a source of competitively priced raw materials for industries, most notably for confectionery producers.
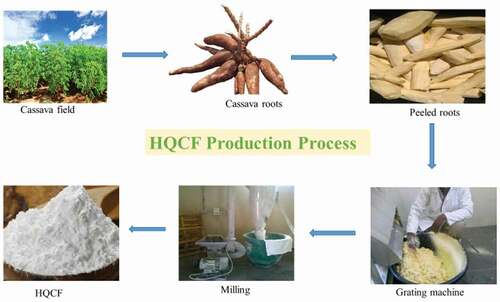
Artisanal techniques characterize cassava processing in Zambia, and the leading distribution channel aims to fill the local demand for convenience food and glue (Alamu et al., Citation2019). The fastest growing and most promising market among various products from cassava is high-quality cassava flour (HQCF) and its use as a substitute for wheat flour in the bakery and confectionery sectors and the production of plywood. HQCF is unfermented cassava flour, usually whitish or creamy in colour, odourless, bland or sweet, and free from adulterants, insect infestation, sand, peel fragments, dust, and other impurities (Iwe et al., Citation2017). The main food products made from cassava flour substitution are pies/pastries, cakes, biscuits, doughnuts, and bread. HQCF is increasingly used as a substitute for imported starch and wheat flour in the local industries, such as breweries, textile, adhesives, bakery, feed mills (Adebayo et al., Citation2010). The rapid increase in cassava flour usage for product development has led to increased demand for HQCF. Thus, various grades of cassava flour are available in the markets for human consumption. Many potential end-users (industries, supermarkets, etc.) have started taking practical steps to use cassava products by developing recipes and procedures for cassava flour. Nuwamanya et al. (Citation2010) evaluated starch samples extracted from nine cassava varieties for physicochemical and functional properties. They found that the amylose content ranged between 19% and 25%, and there was a negative correlation between the amylose and the swelling power and solubility but positively correlated to starch content. Iwe et al. (Citation2017) evaluated HQCF processed from five different improved cassava varieties to determine their suitability for baking and reported significantly (p < 0.05) low levels of moisture, ash, fat, fibre, and protein between the samples. Again, Alamu et al. (Citation2017a) evaluated HQCF processed from the roots of 45 cassava genotypes and found out that the amylose content ranged from 15.71 to 22.25%, while the starch content ranged between 67.08% and 82.42%.
Aflatoxins are produced by Aspergillus flavus, A. parasiticus, and A. nominus in both field and storage (Alamu et al., Citation2018). Aflatoxins are categorized into aflatoxins B (B1 and B2) and G (G1 and G2) as a result of blue and green fluorescence, respectively, on the thin layer chromatography plates under UV light (Sweeney & Dobson, Citation1998; Matsiko et al., Citation2017. Aflatoxin contamination is a threat to improved health and economic status in sub-Saharan Africa (Gong et al., Citation2004; Kaaya & Warren, Citation2005; Pritchard et al., Citation2016), especially in Zambia (Akello et al., Citation2017; Alamu et al., Citation2018). Matsiko et al. (Citation2017) evaluated cassava and maize flours collected from five open markets in Kigali city and analyzed for aflatoxin B1, B2, G1, and G2 using high-performance thin-layer chromatography(HPTLC). In all the cassava flour samples, aflatoxins analyzed were below the detection limit (0.15 ppb for aflatoxin B1, 0.2 ppb for B2, 0.2 ppb for G1, and 0.5 ppb for G2). Chiona et al. (Citation2014) conducted a study in Malawi and Zambia to assess the level of fungal and mycotoxin contamination in commonly processed cassava products collected from farming households; none of the samples analyzed was contaminated either by fungal or aflatoxins B1, B2, G1, and G2. Adebayo-Oyetoro et al. (Citation2013) investigated microorganisms involved in the fermentation and spoilage of fermented cassava flour. They found a predominance of Staphylococcus aureus, Aspergillus spp., and Escherichia coli in all samples. The total bacterial count in the fermented cassava flour ranged between 4.9 × 10⁶ CFUmg−1 and 8.10 × 10⁶ CFUmg−1.
To be widely accepted by the food industry, HQCF needs to meet the high-quality requirements in terms of physicochemical characteristics, microbial safety, and cyanogenic glucoside content. The difference in the functional properties of HQCF gives opportunities for its uses in industrial, food, and non-food applications. Due to the influx of various qualities of HQCF in the market due to demand, there is a need to evaluate the quality of the HQCF being sold in the market for human consumption. This study aimed to assess the chemical, functional and pasting properties and the microbial and aflatoxin contamination of the selected HQCF sold in Lusaka markets.
2. Materials and method
2.1. Study design
The study was a cross-sectional survey carried out in Lusaka, where most of the population dwells in Zambia. The HQCF samples were collected in August and September 2018 at different sales points in Lusaka; seven samples from big supermarkets, one sample from an open and major market, and one sample from a cassava processing centre (with adequate facilities). Lusaka’s population is engaged in various economic and social activities, including business/trade and small-scale industrial manufacturing (Central Statistical Office, Citation2016). Lusaka has both formal and informal markets.
2.2. Sampling procedures
Seven major supermarkets at shopping malls in different areas of Lusaka city, one primary open market, and one cassava processing centre were selected for sample collection. From each source, four incremental samples of 250 g of HQCF were picked at random from four different bags of the same suppliers to make a composite sample of 1000 g (Osuret et al., Citation2015). The incremental samples were packed in sterile paper bags after collection. A total of nine samples were collected and carefully mixed using the quartering method to obtain a homogenized sample, according to Osuret et al. (Osuret et al., Citation2015). The subsamples were then packed in a zip-lock polyethylene bag, labelled, and shipped to the IITA, Ibadan Food Science and Nutrition Laboratory for chemical, functional, and pasting property analysis and the IITA Pathology Laboratory for microbial and aflatoxin analysis. The samples with their assigned codes and manufacturer details are presented in .
Table 1. High-quality cassava flour (HQCF) samples collected from different markets with sample code
2.3. Determination of chemical composition
2.3.1. Moisture content determination
Moisture content was determined using the Association of Official Analytical Chemists (AOAC) method (AOAC, Citation2005). The sample was dried at 100–105 °C for 24 h in a draft air Fisher Scientific IsotempR Oven model 655F (Loughborough, United Kingdom). The difference in weight was recorded as moisture.
2.3.2. Ash content determination
Ash content was determined by AOAC (Citation2005) method, which involved burning off moisture and all organic constituents at 600 °C in a VULCANTM furnace model 3-1750 (Cole-Parmer, IL 60061 United States). The weight of the residue after incineration was recorded as the ash content.
2.3.3. Protein content determination
Protein content was determined by the Kjeldahl method using KjeltecTM model 2300, as described in FOSS (Citation2003). The technique involved the digestion of the sample at 420 °C for 1 h to liberate the organically bound nitrogen in the form of ammonium sulfate. The ammonia in the digest (ammonium sulfate) was then distilled off into a boric acid receiver solution and then titrated with standard hydrochloric acid. A conversion factor of 6.25 was used to convert from total nitrogen to percentage crude protein.
2.3.4. Starch and sugar content determination
The method of Dubois et al. (Citation1956) was used for starch and sugar determination. The analysis involved weighing 0.2 g of the sample into a centrifuge tube with 1 ml of ethanol (0.789 g/ml), 2 ml of distilled water, and 10 ml of hot ethanol. The mixture was vortexed and centrifuged for 10 minutes at 2000 rpm using the Sorvall centrifuge model GLC-1 (Newtown, Connecticut, USA). The supernatant was decanted into another centrifuge tube and used for sugar determination, while the sediment was used for starch determination. Perchloric acid (7.5 ml) was added to the residue and allowed to stand for 1 h, after which 17.5 ml of distilled water was added and vortexed. An aliquot of 0.05 ml of the solution was pipetted into a test tube, into which was added 0.95 ml of distilled water, 0.5 ml of phenol, and 2.5 ml of H2SO4. The centrifuge tube was then vortexed. The mixture was cooled, and the absorbance read on a spectrophotometer model Spectronic 601 (Milton Roy Company, USA), already standardized at 490 nm wavelength. The absorbance of both starch and sugar was read at 490 nm.
2.3.5. Amylose content determination
Amylose content was determined using the method described by Williams et al. (Williams et al., Citation1958). It is a spectrophotometric method based on the formation of a deep blue complex with iodine, the absorbance of which is read at 620 nm.
Total carbohydrate
Total carbohydrate was determined by difference, which is the addition of the percentages of moisture, protein, fat, and ash content subtracted from 100% (Alamu et al., Citation2015); % CHO = 100 – (% MC + % protein + % fat + % ash + crude fiber).
2.4. Determination of pasting properties
Pasting characteristics were determined with a Rapid Visco Analyser (RVA) (model RVA 4500, Perten Instruments NA, Inc., Hägersten, Sweden). Peak viscosity, trough, breakdown, final viscosity, set back, peak time, and pasting temperature was read from the pasting profile with the aid of Thermocline for Windows version 3 (TCW3) software interface with a personal computer for viscometric data acquisition and analysis (Perten Instrument, Citation2012).
2.5. Determination of functional properties
2.5.1. Water absorption capacity (WAC)
One gram of the sample was added to 15 ml distilled water in a pre-weighed centrifuge tube. The tube with its content was agitated on a flask Gallenkamp shaker for two minutes and centrifuged at 4000 rpm for 20 minutes on a Sorvall GLC-1 Tabletop Centrifuge (model 06470, USA). The amount of water bound by the flour was determined by the difference and expressed as the weight of water bound by 100 g dry flour (Alamu et al., Citation2015).
2.5.2. Swelling power and solubility
This was determined using the methods described by Alamu et al. (Citation2015) and Leach et al. (Citation1959). It involved weighing 1 g of milled sample into 100 ml conical flask, adding 15 ml of distilled water, and mixing gently at low speed for five minutes. The slurry was heated in a thermostatic water bath (Thelco model 83, USA) at 80 °C for 40 minutes. During heating, the slurry was stirred gently to prevent the starch from becoming lumpy. The content was transferred into a pre-weighed centrifuge tube, and 7.5 ml distilled water was added. The tubes containing the paste were centrifuged at 2200 rpm for 20 min using Sorvall GLC-1 Tabletop Centrifuge (model 06470, USA). The supernatant was decanted immediately after centrifuging into a pre-weighed can and dried at 100 °C to a constant weight. The weights of the sediment and soluble were measured and recorded.
2.5.3. Water binding capacity
Water binding capacity was determined using the method described by Alamu et al. (Citation2015), and it involved weighing 2.5 g of each sample into a tarred 50 ml centrifuge tube. Distilled water (3.7 ml) was added, and the tube was capped and agitated on a wrist action shaker for 1 h. The tube was then centrifuged for 10 minutes at 2200 g or 7500 rpm, and the water decanted. The centrifuge tube content was weighed, and the quantity of bound water calculated.
2.5.4. Bulk density
The milled samples’ bulk density was determined using the method described by Wang and Kinsella (Citation1976). A known amount of each sample was weighed into a 25 or 50 ml measuring cylinder. The sample was packed by gently tapping the cylinder on the benchtop 10 times, and the volume recorded. The bulk density(g/ml) was calculated using the weight and the volume.
2.6. Aflatoxin determination using Thin Layer Chromatography (TLC)
The methods described by Ferreira et al. (Citation2005), Atehnkeng et al. (Citation2008), and Odoemelam and Osu (Citation2009) were adapted for aflatoxin determination. Before analysis, the cassava flour samples were hand mixed to obtain a homogeneous sample. Twenty g of homogenized cassava flour was weighed out (in two replications) and thoroughly blended with 100 ml of 70% methanol for 3 min using a waring blender. The composite sample was transferred into a 250 ml Pyrex® conical flask and sealed with parafilm, then homogenized on an orbit shaker (Lab-line Instruments. Inc.) at 4 × 100 rpm for 30 minutes to ease the extraction of aflatoxins. The mixture was filtered into a clean conical flask through a qualitative Whatman filter paper (No.1, 185 mm, cat No. 1001 185); 40 ml of the filtrate was collected and poured into a separating flask. After that, 20 ml of distilled water and 25 ml of dichloromethane were added, gently hand-shaken, and left to separate for a few minutes. The lower phase was drained through a bed of 20 g anhydrous sodium sulfate into a 100 ml white tri-pour graduated plastic beaker. The separation process was repeated with the addition of 10 ml of dichloromethane to the residual extract in the separating flask for complete extraction. The combined extract was dried overnight in a fume hood. The dried extract was dissolved with 1.5 ml of dichloromethane, transferred into a clean 1.5 ml Eppendorf tube, and again left in the hood to dry overnight.
Before the TLC spotting, the dried extract was re-dissolved in 1 ml of dichloromethane. Exactly 4 ul of each sample extract and the aflatoxin standard B1, B2, G1, and G2 solutions were spotted onto a calibrated TLC plate. After that, the plate was moved to the development chamber containing a solution of diethyl ether, methanol, and distilled water in the ratio of 96:3:1 for the spot development. After the spot development, the plate was displaced to a scanning densitometer (CAMAG TLC Scanner 3, ISO 9001, Reg. No. 11,668–01) to automatically scan the results at 360 nm, and the concentration of each aflatoxin evaluated was recorded.
2.7. Microbiological analysis
2.7.1. Media preparation, isolation, and characterization of microorganisms in the samples
The culture media method, which is primarily intended to predict product shelf-life and prevent spoilage, was considered in this investigation. The media used was composed of different nutrients to enhance microbial growth: acidified potato dextrose agar (APDA), plate count agar (PCA), and nutrient agar (NA). Both qualitative and quantitative results of microorganisms present in the food samples were obtained. In this investigation, the standard plate count (SPC), which is the most widely used method for finding the number of practical colonies forming units (CFU), was used (Sutton, Citation2011). The spreading plate technique was applied. For effective microbial enumeration, an approved method of serial dilutions was carried out. For each sample, six 40 ml clean vials were selected and filled with 9 ml of distilled water. The vials served as dilution blanks and were labeled as 1:10, 1:100, 1:1000, 1:10,000, 1:100,000, and 1:1,000,000. Following this preparation, the desired media APDA, PCA, and NA were prepared according to the manufacturer’s instruction. Both media and vials were then autoclaved at 121 °C for 20 min. The media were cooled to 45 °C and kept in a water bath until ready to pour. The first dilution was done by carefully weighing 1 g of thoroughly mixed cassava flour and transferring it into the 40 ml vial labelled 1:10 holding 9 mL of the dilution liquid and then mixed thoroughly. The food sample was now diluted by a factor of 10. The second dilution was done by taking a 1 mL aliquot from the vial 1:10 and then added to the 9 mL of dilution liquid in the vial 1:100. This was thoroughly mixed before adding to the next vial. The procedure continued in that manner up to the longer serial dilutions of 1:1000, 1:10 000, 1:100,000, and 1:1,000,000. Plating was done by transferring 0.1 ml from each of 10−3, 10−4, 10−5, and 10−6 dilutions onto the surface of the agar plates. The inoculum was spread with a sterile spreader until the surface of the agar was dry and sticky. At least two replicates of the desired dilution factors were plated onto the agar plate. Incubation in the plates took place for two days at 37 °C for bacteria and five days at room temperature (28 ± 2 °C) for fungi. The plates were examined for growth after the incubation. The number of viable colonies on the plates was counted and expressed in the number of colony-forming units (CFU) per gram or millilitre of the sample (Tomasiewicz et al., Citation1980), while plates with a higher number of colonies were recorded as too numerous to count (TNTC) as recommended by Sutton (Citation2011). Potassium hydroxide (KOH) test and Gram staining were used to characterize the bacteria’s morphology isolates and view the bacterial isolates’ morphology. In contrast, the fungal isolate was identified as Rhizopus spp. by spore staining and spore morphological examination under the microscope
2.8. Statistical analysis
The mean, standard deviation, and coefficient of variance of the values were calculated using Statistical Package for Social Scientists (SPSS) version 20. The LSD means were separated using Duncan’s Multiple Range Test at a 95% confidence level.
3. Results and discussion
3.1. Chemical properties of HQCF samples
The chemical properties of the HQCF collected from major markets of Lusaka are presented in . The moisture content of the HQCF samples ranged from 10.51 to 14.20%, with a mean of 12.34%. CM 03 from a food processing factory in Lusaka had the highest moisture content; CM 09 had the lowest at 10.51%, which was the sample collected from the factory that received HQCF production training from Food and Nutrition Sciences of IITA-Zambia. The MC of the six HQCF samples from commercial markets was higher than the recommended MC for HQCF (10–12%). MC has a direct impact on proximate composition and is one factor that checks the shelf life of the HQCF. MC confers higher shelf life on the flour and is a good sign of microbial stability (Alamu et al., Citation2017a; Ogbonnaya & Hamza, Citation2015; Ogiehor & Ikenebomeh, Citation2006). The high MC results could be inferred that most commercial HQCF would have a low shelf life and low microbial stability during storage. The lower the initial MC of a product, the higher the drying method’s efficiency. This shows that a considerable amount of moisture contained in the fresh sample or product has been removed. The high MC recorded in this study might be due to moisture absorption during storage by the sellers. All the HQCF samples showed an ash content ranging from 1.09 to 2.08% with a mean of 1.55%, crude fibre (1.87–2.99%) with a mean of 2.47%, starch (41.06–63.66) with a mean of 50.40%, and amylose (21.25–23.38) with a mean of 22.11%. These values agree with the report for HQCF obtained in another country (Adebowale et al., Citation2008; Alamu et al., Citation2017a), although the starch content (75.5–76.6%) reported by these authors was a little bit higher, which could be due to genetic and environmental effects. CM 01, 08, and 09 had starch content above 60%. This showed that HQCF quality parameters are not country dependent but processing dependent. Thus, the same quality of flour could be obtained if the method of processing is the same. CM 02, 06, 07, 08, and 09 had ash content less than 1.5%, which complies with the regulatory standard of not more than 1.5 g/100 g ash content. There was a significant (p < 0.05) difference in ash content for all the samples, but CM 03 and CM 04 had the highest ash content at 2.07% and 2.08%, respectively. The fat content was very low (below 1.5%) with no significant difference (p > 0.5) for all flour samples; CM 09 had the highest (1.23%). Cassava has been known to possess little or no fat, and the fat results are as expected. The above 1% fat content in some samples may be due to contamination during processing. The CF content ranged from 1.87 to 2.99% with an overall mean of 2.47 ± 0.42%, and all samples showed a CF value above 2% except CM 07 with 1.87 ± 0.03%. The samples could be medium fibre samples as it has been reported that samples could only be referred to as high fibre samples if their CF is above 5.0%. A high-fibre diet may help reduce the risk of obesity, heart disease, and diabetes. It has been recommended that women eat at least 21 to 25 g of fibre a day, while men should aim for 30 to 38 g a day (MFMER, Citation2019). Thus, HQCF-based products could be a source of fibre, especially for cassava-consuming regions of the world.
Table 2. Chemical composition of commercial high-quality cassava flour from major Lusaka markets
The samples’ overall protein content was 1.87 ± 0.84%, but CM 06 had the highest (3.87 ± 0.39%), and CM 05 showed the lowest (1.03 ± 0.08%). There was no significant difference in the samples’ protein content; this implies that the processing method did not affect the protein content of the samples. The starch and sugar content ranged from 41.06 ± 0.43 to 63.66 ± 0.07% and 2.27 ± 0.00 to 5.38 ± 0.08%, respectively. Samples CM 01, CM 08, and CM 09 had starch content above 60%, while the other samples (CM 02 to CM 07) had starch just above 40%. The significant (p = 0.05) difference in the samples’ starch content could be due to the genetic variability of the cassava varieties used for the flour. CM 08 had the highest starch content, while CM 02 had the lowest. However, CM 02 and CM 04 had the highest sugar content of above 5.0%, while CM 07 and 08 had the lowest values of just above 2.0%. All the samples’ amylose content was statistically different (p = 0.05) and ranged from 21.25 ± 0.11 to 23.38 ± 0.11 with a mean value of 22.11 ± 3.18%. CM 09 had the highest (23.38 ± 0.11%), and CM 06 the lowest. Contrarily, CM 06 had the highest amylopectin at 78.74%, while CM 09 had the lowest value of all sampled cassava meals. The results confirmed those of Chiona et al. (Citation2014), though samples were collected on dry processed cassava products from households in rural areas of Zambia’s cassava growing zone. The low levels of ash, fat and protein contents observed for all of the samples were in agreement with Iwe et al. (Citation2017) that reported significantly (p < 0.05) low levels of moisture, ash, fat, fibre, and protein between the cassava varieties they investigated.
3.2. Functional and pasting properties of HQCF samples
The functional properties of the cassava flour samples are presented in . The mean value of bulk density (BD) was 0.51 ± 25.49 g/ml, of dispersibility 68 ± 2.63%, swelling power (SP) 7.84 ± 0.76%, solubility 135.80 ± 18.8%, and water absorption capacity (WAC) 6.28 ± 32.49. CM 04 and CM 09 showed similar bulk density (0.66 g/ml) and dispersibility (66%) values. While most samples had a similar per cent solubility, CM 09 was quite distinct, with its highest value at 9.81% and CM 06 with the lowest at 6.91%. This was like solubility potential, which was the highest among the meals at 169.96%. CM 03 had the lowest water absorption capacity at 3.64% compared to other samples, but CM 07, CM 08, and CM 09 showed higher values than other samples.
Table 3. Functional properties of commercial high-quality cassava flour from major Lusaka markets
presents the pasting properties of the flours. The pasting characteristics are the starch properties used to assess the flour application’s suitability as functional ingredients in food and other industrial products (Adegunwa et al., Citation2019). However, the essential pasting characteristic is pasting viscosity. The viscosities observed at the start of the holding period of the pasting profile and during the cooling reflect the ease of cooking the starch and its paste stability. The mean values for Peak 1 (Initial viscosity) were 437.46 ± 94.12 RVU, 217.55 ± 27.41 RVU for trough 1, 219.91 ± 77.94 RVU for break down, 284.31 ± 29.96 RVU for final viscosity, and 66.77 ± 5.30 RVU for setback viscosity. CM 09 had the highest values for peak 1 (initial viscosity), break down, and setback viscosities but had the lowest peak time and pasting temperature. This implies that CM 09 is the best flour because it has the highest initial viscosity in the shortest time and at the lowest temperature. It will need very little energy to cook CM 09, although it shows a high setback value. The setback could explain the gelling of the cooked starch mass when the straight-chain amylose starch molecules are realigning to form a stable gel structure. CM 08 had the highest pasting temperature and lowest values for final viscosity. Only CM 01 had a lower value compared to all other flours.
Table 4. Pasting properties of commercial high-quality cassava flour from major Lusaka markets
3.3. Anti-nutritional factors of HQCF samples
The samples’ anti-nutritional components were within the recommended safe World Health Organization (WHO) limit, especially the cyanide content of 10 ugg−1 dry weight basis (). CM 05 had the highest cyanogenic potential (CNP) of 3.52 ± 0.04 mg/kg, while CM 04 had the lowest value (1.13 ± 0.06 mg/kg). However, the CNP values were higher among the samples when compared with the other anti-nutritional parameters (phytic acid and tannin), which confirms that cyanide is the major anti-nutritional factor of cassava. This could be removed by processing, especially processing cassava into HQCF. CM 02 had the highest tannin content, while CM 09 had the lowest. Phytic acid/phytate content was highest in CM 06, CM 07, and CM 08. While tannin content seemed to be higher than phytic acid across all samples, there was little deviation observed among samples for phytic acid compared with tannin content.
Table 5. Anti-nutrient properties of commercial high-quality cassava flour from major Lusaka markets
3.4. Correlation analysis of the chemical, functional, and pasting properties of HQCF samples
3.4.1. Linear correlation coefficients between proximate and functional properties
The correlation coefficients showed some important relationships between the proximate and functional properties analyzed. shows that the correlation between moisture content and dispersibility was a significant positive relationship (r = 0.805, p < 0.05). A significant negative relationship (r = —0.935, p < 0.01) was exhibited between moisture content and solubility, but a strong negative association (r = —0.795) was exhibited between ash and water absorption capacity. CF and dispersibility showed a negative relationship (r = —0.677, p < 0.01) and a significant and strong positive relationship (r = 0.642, p < 0.01) between CF and solubility. as expected, crude fibre reduces the flour’s dispersibility because fibre comprises true cellulose and insoluble lignin that are highly non-dispersed in water. The CF and solubility’s positive relationship indicates that CF from cassava comprises soluble fibre, unlike the flour of soybean, which negatively correlates with CF (Alamu et al., Citation2017b). As for starch, it showed a negative relationship with dispersibility (r = —0.524) and positive relationships with solubility (r = 0.490) and WAC (r = 0.527) respectively, but sugar exhibited a negative relationship with WAC (r = ‒0.741, p < 0.05). This shows that as starch increases, the dispersibility decreases but solubility increases. Amylopectin exhibited negative relationships with swelling power(r = —0.661, p < 0.01) and solubility(r = —0.530, p < 0.05) respectively, while amylose exhibited positive relationships (r = 0.661 and r = 0.530) significant at p < 0.01 and p < 0.05 with swelling power and solubility, respectively.
Table 6. Correlation coefficients of proximate, anti-nutritional, functional and pasting properties of high-quality cassava flour in the Lusaka market
3.4.2. Linear correlation coefficients between proximate and anti-nutritional properties
The correlation coefficients of proximate anti-nutritional properties showed some significant relationships, as shown in . The ash and phytate content exhibited a negative relationship (r = —0.470) significant at p < 0.05 . The starch content showed a negative correlation (r = —.530) significant at p < 0.05 with tannin content. The sugar content and tannin content showed a significant (p < 0.01) positive correlation (r = 0.632).
3.4.3. Linear correlation coefficients between proximate and pasting properties
MC exhibited a positive relationship (r = 0.673), significant at a 0.01 level with pasting properties (). Ash and peak time had a similar relationship (r = 0.555), significant at p < 0.05 . CF and pasting temperature exhibited a negative relationship (r = —0.703), which was significant at a 0.01 level. Sugar showed positive relationships (r = 0.654 and 0.612) at the significant level 0.01 with both trough 1 and final viscosity, respectively. Amylopectin exhibited negative relationships (r = —0.768 and—0.797) at a significant level of 0.01 with peak and breakdown viscosities, respectively. At the same time, it also exhibited a positive relationship (r = 0.649) at a significant level of 0.01 with peak time. Amylose exhibited positive relationships (r = 0.768 and 0.797) at a significant level of 0.01 with peak 1 and break down, respectively, and a negative relationship (r = —0.649) at P < 0.05 with peak time.
3.4.4. Linear correlation coefficients between functional and pasting properties
shows the relationship between functional and pasting properties. Dispersibility and pasting temperature exhibited a positive relationship (r = 0.756) at a significant level of 0.01. Swelling power showed positive relationships (r = 0.852, r = 0.879, r = 0.476, and r = 0.481) at significant levels of 0.01 for peak 1 and break down and 0.05 for final viscosity and setback, and a negative relationship (r = —0.590) at a significant level of 0.05 with peak time. The solubility exhibited positive relationships (r = 0.518 and 0.609) at significant levels of 0.05 and 0.01 with peak and break down, respectively, and a negative relationship (r = —0.617) at a significant level of 0.01 with pasting temperature.
Table 7. Aflatoxins B1, B2, G1, and G2 (ppb) contents of high-quality cassava flour from Lusaka markets a
3.6. Enumeration of microorganisms in HQCF samples
Both fungal and bacterial isolates were detected in the nine samples tested. Six bacteria and one fungus species were isolated from the samples. Five of the isolated bacteria were Gram-positive, while the remaining one was Gram-negative (, ). The bacteria isolates were also plated on violet red bile agar (VRBA) to confirm if they were related to the Lacto-fermenting coliform bacteria. The results obtained proved that they were not related. Rhizopus species was detected in four out of nine samples: CM 04, CM 06, CM 07, and CM 08, while the remaining samples were without fungal growth at all. The level of fungal growth on acidified potato dextrose agar (APDA) for all samples was satisfactory. Rhizopus species appeared in 44% of the total samples tested (). It is a very fast-growing fungus, which has white mycelia and black sporangia. Some species are saprophytic, while some are beneficial in making tempeh and certain other mould-fermented foods (Kathleen & Fung, Citation1993). It requires high-moisture conditions for growth. The fungus in the food samples might be associated with the level of sanitation during handling and processing and the quality of the water used for processing.
Table 8. Gram staining and KOH reaction of bacterial isolates in high-quality cassava flour from Lusaka market
Figure 1. Gram staining reactions of the bacteria isolates (+ve = positive and -ve = negative) from high-quality cassava flour (HQCF) from Lusaka markets
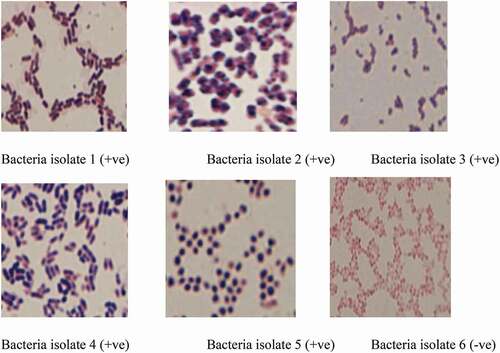
Table 9. Bacterial and fungal isolates detected in the high-quality cassava flour from Lusaka markets
The correlation analysis has provided a measure of the degree of association between the parameters investigated. The positive linear correlations observed among the parameters indicated that they are positively associated; the other is also growing if one is increasing. The observed negative correlation showed that they are negatively associated; if one is rising, the other is decreasing. This information is l beneficial for breeders to identify the parameters that could be bred together to improve cassava roots’ quality to produce acceptable HQCF.
3.5. Aflatoxin content of HQCF
Cassava flour samples analyzed did not show any sign of aflatoxins B1, B2, G1, and G2, especially AFB1, which was considered a group 1 carcinogen for humans by International Agency for Research on Cancer (IARC) (). A good reason could be that aflatoxin levels in the samples were below the analytical method’s detection limit of 1 ppb. Proper storage conditions after drying must have resulted in very low humidity, leading to a decrease in moisture levels, hence creating a non-conducive environment for the growth and proliferation of toxin-producing organisms. During the production and drying process, hygienic conditions might have also resulted in non-contamination with Aspergillus species that produce aflatoxins, a major health concern to humans and livestock. The result agrees with the findings of Matsiko et al. (Citation2017). They reported that aflatoxins in studied cassava flours were below the detection limit (0.15 ppb for aflatoxin B1, 0.2 ppb for B2, 0.2 ppb for G1, and 0.5 ppb for G2).
Results also showed that all the nine samples tested were contaminated with bacteria except sample CM 01. On plate count agar, bacteria isolate 1 and 6 occurred in 56% of the samples, isolate 2 occurred in 11%, while isolates 3, 4, and 5 occurred in 33% of the total samples enumerated. Enumeration with nutrient agar showed strains 1 and 6, occurring in 78% of the samples. Strains 3 and 4 occurred in 56% of the samples, while strain 2 and 5 occurred in 33% and 44% of the samples, respectively ().
The colony-forming units (CFU) of CM 04, CM 06, CM 07, and CM 08 showed equal amounts of CFU of 1 × 10⁴ of Rhizopus species, indicating that the presence of the fungus is economically and hygienically insignificant (). This agrees with the reports and recommendations of Sanni et al. (Citation2005) that cassava flour maximum total count should be 104 to meet international standards. Bacteria colony counts in samples CM 02, 03, 07, and 09 were higher with CFU/ml of 2.8 × 10⁵, 2.6 × 10⁵, 2 × 10⁵, and 5.1 × 10⁵, respectively, when compared with other samples plated on the same plate count agar. However, an enumeration with nutrient agar showed samples CM 03, 07, 08, and 09 had higher bacteria counts. Sample CM 07 significantly showed bacteria colonies that were TNTC (). The bacteria colony counts found in this study for some of the HQCF were close to what Adebayo-Oyetoro et al. (Citation2013) reported for fermented cassava flour samples (between 4.9 × 10⁶ CFUmg−1 and 8.10 × 10⁶ CFUmg−1). It implies that most of the HQCF sold at the Lusaka markets is slightly fermented.
Table 10. Colony-forming unit (CFU) per gram of bacteria and fungi in high-quality cassava flour from the Lusaka markets
From the results in , the CFUs of some samples were fewer and below the recommended level of 50–200 CFU/plate (Breed & Dotterrer, Citation1916). Only a few samples had high CFU when plated on plate count and nutrient agar media. The first test used in bacterial classification is the gram stain, the result of which is shown in . Six bacteria isolated from the samples were classified as Gram-positive and Gram-negative. Gram-positive organisms are blue/purple, while Gram-negative organisms are pink/red (). It is possible to have both groups present in each food sample either as pathogens or non-pathogens. Microscopic examination showed they are mostly rod-shaped. Pathogenic Gram-negative bacteria are more dangerous as disease organisms because a capsule or slime layer often hides their outer membrane. The presence of a membrane around Gram-negative bacteria’s cell wall increases the risk of toxicity to the host; this membrane is absent in Gram-positive bacteria. That all the six bacteria isolates did not grow when plated on VBRA shows that they are not likely to be related to pathogenic bacterium/bacteria. This submission does not stop conducting biochemical tests like catalase, citrate, coagulase, indole, oxidase, and urease to confirm each isolate’s identity. The evaluation of raw materials, such as HQCF, gives important information about the heat-processing parameters that would be necessary to meet the microbiological standards, guidelines, or specifications of a product. The total microbial population in food samples varies greatly. It depends on (1) the level of sanitation used during handling and processing and (2) the processing and preservation methods adopted to kill and prevent microorganisms’ growth.
4. Conclusion
Based on the chemical, functional, and pasting properties, we conclude that most of the HQCF (CM 02, CM 04, CM 07, CM 08, and CM 09) samples tested could be used for confectionery. Also, the aflatoxin level of commercial HQCF from Lusaka markets is very low and below the detection limit. There was no sign of aflatoxins B1, B2, G1, and G2, especially aflatoxin B1 (AFB1) that belongs to group 1 carcinogens for humans. Bacteria colony counts in samples CM 02, CM 03, CM 07, and CM 09 were high, and the HQCF samples were contaminated with microorganisms that are detrimental to health. This implies that most of the HQCF sold at the Lusaka markets is slightly fermented. However, the samples’ anti-nutritional components were within the recommended safe World Health Organization (WHO) limit, especially the cyanide content of 10 ugg−1 dry weight basis. There is a need to update and implement the safety standards for HQCF in Zambia. Training of processors on HQCF production is also recommended.
Competing interests
The authors declares no competing interests.
Acknowledgements
The authors acknowledge the support received from the CGIAR Research Program on Roots, Tubers, and Bananas (RTB) and from the Zambia Youth Agripreneurs, who assisted in sample collection.
Disclosure statement
The authors reported no potential conflict of interest.
Additional information
Funding
Notes on contributors
Emmanuel Oladeji Alamu
E. O. Alamu (PhD) is an Associate Scientist at the International Institute of Tropical Agriculture (IITA), Lusaka, Zambia.
Therese Gondwe
Therese Gondwe (PhD) is a Technology Dissemination Scientist at the International Institute of Tropical Agriculture (IITA), Lusaka, Zambia
Olalekan Ayinde
Olalekan Ayinde is Research Administrative Manager at the International Institute of Tropical Agriculture (IITA), Ibadan, Nigeria.
Gbenga Akinwale
Gbenga Akinwale (PhD), is a Project Manager at the International Institute of Tropical Agriculture (IITA, Lilongwe, Malawi
Pheneas Ntawuruhunga
Pheneas Ntawuruhunga (PhD), is a Cassava Breeder at the International Institute of Tropical Agriculture (IITA), Lusaka, Zambia
Wasiu Awoyale
Wasiu Awoyale (PhD), is a Lecturer at the Department of Food Science and Technology, Kwara State University, Ilorin, Nigeria.
Adebayo Abass
Adebayo Abass (PhD), is a Postharvest Specialist and Coordinator for TAAT Cassava Compact at International Institute of Tropical Agriculture (IITA), Dar es Salaam, Tanzania
Busie Maziya-dixon
Busie Maziya-Dixon (PhD), is a Senior Food and Nutrition Scientist at the International Institute of Tropical Agriculture (IITA), Ibadan, Nigeria.
References
- Abass, A. (2008). Recent developments in cassava processing, utilization, and marketing in East and Southern Africa and lessons learned. Paper presented at the FAO Expert Consultation Meeting held at the Natural Resources Institute, University of Greenwich, United Kingdom. http://projects.nri.org/gcpmd/files/1_Abass_paper.pdf.
- Adebayo, K., Abayomi, L., Abass, A., Dziedzoave, N. T., Forsythe, L., Hillocks, R. J., Gensi, R., Gibson, R. W., Graffham, A. J., Ilona, P., Kleih, U. K., Lamboll, R. I., Mahende, G., Martin, A. M., Onumah, G. E., Orr, A. W., Posthumus, H., Sanni, L. O., Sandifolo, V., & Westby, A. (2010). Sustainable inclusion of smallholders in the emerging high-quality cassava flour value chains in Africa: Challenges for agricultural extension services. Journal of Agricultural Extension, 14(1), 1–21. DOI: https://doi.org/10.4314/jae.v14i1.64062
- Adebayo, K., Lamboll, R. I., & Westby, A. (2009). Contextualizing Environmental, Social and Behavioral Issues in the Cassava Post-harvest System in Africa. Anthropologist, 5, 137–146. Special Volume No.
- Adebayo-Oyetoro, A. O., Oyewole, O. B., Obadina, A. O., & Omemu, M. A. (2013). Microbiological Safety Assessment of Fermented Cassava Flour “Lafun” Available in Ogun and Oyo States of Nigeria. International Journal of Food Science, 2013, 5. pages Article ID 845324. https://doi.org/https://doi.org/10.1155/2013/845324..
- Adebowale, A. A., Sanni, L. O., & Onitilo, M. O. (2008). Chemical composition and pasting properties of tapioca grits from different cassava varieties and roasting methods. African Journal of Food Science, 2, 077–082. https://academicjournals.org/journal/AJFS/article-full-text-pdf/39FD93216730
- Adegunwa, M. O., Oloyede, I. O., Adebanjo, L. A., Alamu, E. O., & Yildiz, F. (2019). Quality attribute of plantain (Musa paradisiaca) sponge-cake supplemented with watermelon (Citrullus lanatus) rind flour. Cogent Food & Agriculture, 5(1), 1631582. https://doi.org/https://doi.org/10.1080/23311932.2019.1631582.
- Akello, J., Kachapulula, P. W., Bandyopadhyay, R., & Cotty, P. J. (2017). Aspergillus section Flavi community structure in Zambia influences aflatoxin contamination of maize and groundnut. International Journal of Food Microbiology, 261, 49–56. https://doi.org/https://doi.org/10.1016/j.ijfoodmicro.2017.08.014.
- Alamu, E. O., Gondwe, T., Akello, J., Sakala, N., Munthali, G., Mukanga, M., & Maziya-Dixon, B. (2018). Nutrient and aflatoxin contents of traditional, complementary foods consumed by children of 6–24 months. Food Science and Nutrition, 6, 1–9. https://doi.org/https://doi.org/10.1002/fsn3.621.
- Alamu, E. O., Gondwe, T., Mdziniso, P., Maziya-Dixon, B., & Yildiz, F. (2017b). Assessment of nutritional characteristics of products developed using soybean (Glycine max (L.) Merr.) pipeline and improved varieties. Cogent Food & Agriculture, 3(1), 1398042. https://doi.org/https://doi.org/10.1080/23311932.2017.1398042.
- Alamu, E. O., Maziya-Dixon, B., & Dixon, G. A. (2017a). Evaluation of proximate composition and pasting properties of high-quality cassava flour (HQCF) from cassava genotypes (Manihot esculenta Crantz) of β-carotene-enriched roots. LWT - Food Science and Technology, 86(2017), 501–506. https://doi.org/http://dx.doi.org/10.1016/j.lwt.2017.08.040.
- Alamu, E. O., Maziya-Dixon, B., Menkir, A., Olaofe, O., & Irondi, E. (2015). Effect of maturity stages and roasting method on the proximate composition of orange maize hybrids. Global Advanced Research Journal of Agricultural Science, 4(8), 462–468.
- Alamu, E. O., Ntawuruhunga, P., Chibwe, T., Mukuka, I., & Chiona, M. (2019). Evaluation of cassava processing and utilization at the household level in Zambia.. https://doi.org/https://doi.org/10.1007/s12571-018-0875-3.
- AOAC. (2005). Official methods of analysis. Association of official analytical chemists (AOAC) (18th ed ed.). USA.
- Arega, D. A., Khataza, R., Chibwana, C., Ntawuruhunga, P., & Moyo, C. (2013). Economic impact of cassava research and extension in Malawi and Zambia. Journal of Development and Agricultural Economics, 5(11), 457–469. https://doi.org/https://doi.org/10.5897/JDAE2013.0496
- Atehnkeng, J., Ojiambo, P. S., Donner, M., Ikotun, T., Sikora, R. A., Cotty, P. J., & Bandyopadhyay, R. (2008). Distribution and toxigenicity of Aspergillus species isolated from maize kernels from three agro-ecological zones in Nigeria. International Journal of Food Microbiology, 122(1–2), 74–84. https://doi.org/https://doi.org/10.1016/j.ijfoodmicro.2007.11.062
- Breed, R. S., & Dotterrer, W. D. (1916). The number of colonies allowable on satisfactory agar plates. Journal of Bacteriology, 1(3), 321. https://doi.org/https://doi.org/10.1128/JB.1.3.321-331.1916
- Central Statistical Office. (2016). 2015 Living Conditions Monitoring Survey Report 2015 (pp. 194). Zambia Statistics Agency Publications. http://www.zamstats.gov.zm/index.php/publications/category/27living-conditions
- Chiona, M., Ntawuruhunga, P., Benesi, I. R., Matumba, L., & Moyo, C. C. (2014). Aflatoxins contamination in processed cassava in Malawi and Zambia. African Journal of Food, Agriculture, Nutrition, and Development, 14(3), 8808–8920.
- Dubois, M., Gilles, K. A. E., Hamilton, J. K., Rebers, P. A., & Smith, J. (1956). Calorimetric Dubois Method for Determination of Sugar and Related Substances. Analytical Chemistry, 28(3), 350–356. https://doi.org/https://doi.org/10.1021/ac60111a017
- Ferreira, A. S., Ribeiro, F., Corrêa, D. H. B., Greiner, R., & Villavicencio, A. L. C. H. (2005). Evaluation of Viability of Aspergillus flavus and Aflatoxins Degradation in Irradiated Samples of Maize. Brazilian Journal of Microbiology, 36, 352–356.
- FOSS. (2003). Manual for Kjeltec System 2300 Distilling and Titration Unit. FOSS Analytical, 69, Slangerupgade, DK-3400.
- Gong, Y. Y., Hounsa, A., Egal, S., Turner, P. C., Sutcliffe, A. E., Wild, C. P., Cardwell, K., & Wild, C. P. (2004). Postweaning Exposure to Aflatoxin Results in Impaired Child Growth: A Longitudinal Study in Benin, West Africa. Environmental Health Perspectives, 112(13), 1334–1338. https://doi.org/https://doi.org/10.1289/ehp.6954
- Government of the Republic of Zambia (GRZ). (2010). Zambia cassava sector development strategy 2010–2015 (pp. 90). Agricultural Commodities Programme (ACP). www.intracen.org/Workarea/DownloadAsset.aspx?id=69309
- Iwe, M. O., Michael, N., Madu, N. E., Onwuka, E., . O. N., Nwabueze, G. I., U., T., & Onuh, J. O. (2017). Agrotechnology physicochemical and pasting properties high-quality cassava flour (HQCF) and wheat flour blends. Agrotechnology, 6(3), 1-8. https://doi.org/https://doi.org/10.4172/2168-9881.1000167.
- Kaaya, N. A., & Warren, H. L. (2005). A review of past and present research on aflatoxin in Uganda. African Journal of Food, Agriculture, Nutrition, and Development, 5, 1–18. http://www.bioline.org.br/pdf?nd05010
- Kathleen, A. H., & Fung, D., . Y. C. (1993). Tempeh: A Mold-Modified Indigenous Fermented Food Made from Soybeans and Cereal Grains. Critical Reviews in Microbiology, 19(3), 137–188. https://doi.org/https://doi.org/10.3109/10408419309113527
- Leach, H. W., McGowen, L. D., & Schoch, T. J. (1959). Structure of the starch granule I: Swelling and solubility patterns of various starches. Cereal Chem, 36(6), 534–544.
- Matsiko, F., Kanyange, C., Ingabire, G., Dusingizimana, T., Vasanthakaalam, H., & Kimonyo, A. (2017). Detection and quantification of aflatoxin in cassava and maize flour sold in Kigali open markets, Rwanda. International Food Research Journal, 24(1), 459–464. http://www.ifrj.upm.edu.my/24%20(01)%202017/(61).pdf
- MFMER (2019). Mayo Foundation for Medical Education and Research. Accessed online on 04/02/2019 https://www.mayoclinic.org/healthy-lifestyle/nutrition-and-healthy-eating/in-depth/high-fiber-foods/art–20050948.
- Nuwamanya, E., Baguma, Y., Emmambux, N., Taylor, J., & Rubaihayo, P. (2010). Physicochemical and functional characteristics of cassava starch in Ugandan varieties and their Progenies. Journal of Plant Breeding and Crop Science, 2(1), 001–011. https://doi.org/https://doi.org/10.5897/JPBCS.9000107
- Odoemelam, S. A., & Osu, C. I. (2009). Aflatoxin B1 Contamination of Some Edible Grains Marketed in Nigeria. E-Journal of Chemistry, [ Retrieved August 28, 2012, from], 6(2), 308–314. http://www.e-journals.net
- Ogbonnaya, C., & Hamza, A. (2015). Effects of moisture content and storage period on proximate composition, microbial counts, and total carotenoids of cassava flour. IJISET - International Journal of Innovative Science, Engineering & Technology, 2(11), 63–73. http://ijiset.com/vol2/v2s11/IJISET_V2_I11_96.pdf
- Ogiehor, I., & Ikenebomeh, M. (2006). The effect of different packaging materials on the shelf stability of gari. African Journal of Biotechnology, 5(2006), 741–745. https://www.ajol.info/index.php/ajb/article/view/56029/44482
- Osuret, J., Musinguzi, G., Mukama, T., Halage, A. A., Natigo, A. K., Ssempebwa, J. C., & Wang, J. S. (2015). Aflatoxin contamination of selected staple foods sold for human consumption in Kampala markets, Uganda. Journal of Biological Sciences, 16(1–2), 44–48. https://doi.org/https://doi.org/10.3923/jbs.2016.44.48
- Perten Instrument. (2012). Rapid Visco Analyser – Application and Method (p. 2–4).
- Pritchard, B., Ortiz, R., & Shekar, M. (2016). The agriculture-nutrition disconnect (pp. 425–441). Chapter 28 in The Routledge Handbook of Food and Nutrition Security.
- Sanni, L. O., Maziya-Dixon, B., Akanya, J. N., Okoro, C. I., Alaya, Y., Egwuonwu, C. V., Okechukwu, R. U., Ezedinma, C., Akoroda, M., Lemchi, J., & Ogbe, F. (2005). Standards for cassava products and guidelines for export. IITA. (pp. 5).printed in Nigeria by IITA.
- Sitko, N. J., Chapoto, A., Kabwe, S., Tembo, S., Hichambwa, M., & Lubinda., R. (2013). Technical compendium: Descriptive agricultural statistics and analysis for Zambia in support of the USAID Mission’s Feed the Future Strategic Review. URL: http://fsg.afre.msu.edu/zambia/wp52.pdf. Accessed June 2020.
- Sutton, S. (2011). Accuracy of plate counts. Journal of Validation Technology, 17(3), 42. http://www.microbiologynetwork.com/content/file/JVT_2011_v17n3_Accuracy-of-Plate-Count.pdf
- Sweeney, M. J., & Dobson, A. D. W. (1998). Mycotoxin production by Aspergillus, Fusarium, and Penicillium species. International Journal of Food Microbiology, 43(3), 141–158. https://doi.org/https://doi.org/10.1016/S0168-1605(98)00112-3
- Tomasiewicz, D. M., Hotchkiss, D. K., Reinbold, G. W., Read, J. R., & Hartman, P. A. (1980). The most suitable number of colonies on plates for counting. Journal of Food Protection, 43(4), 282–286. https://doi.org/https://doi.org/10.4315/0362-028X-43.4.282
- Wang, J. C., & Kinsella, J. E. (1976). Functional properties of novel proteins: Alfalfa leaf protein. Journal of Food Science, 41(2), 286–292. https://doi.org/https://doi.org/10.1111/j.1365-2621.1976.tb00602.x
- Williams, V. R., Wu, W., Tsai, H. Y., & Bates, H. G. (1958). Rice Starch, Varietal Differences in Amylose Content of Rice Starch. Journal of Agricultural and Food Chemistry, 6(1), 47–48. https://doi.org/https://doi.org/10.1021/jf60083a009