?Mathematical formulae have been encoded as MathML and are displayed in this HTML version using MathJax in order to improve their display. Uncheck the box to turn MathJax off. This feature requires Javascript. Click on a formula to zoom.
ABSTRACT
Obtaining geocoded electoral results at precinct level can be challenging in many countries. In this study, we present two validated methodologies developed to overcome these difficulties, and we build new geocoded electoral results for several Italian cities. Our dataset covers the last 20 years (1999-2022) and includes data for various types of elections, including national, regional, municipal and referendum. We provide an overview of some notable patterns in voting trends in major Italian cities. These include a high level of heterogeneity in voting within cities, an increase in spatial polarization of voting behaviour, and an increasing concentration of left-wing voters in central and wealthier areas of metropolitan cities. These trends may be influenced by a range of factors and can have significant implications for political representation and policy-making. Our dataset provides a valuable resource for understanding these trends and exploring their underlying causes.
Introduction
Electoral results at national and regional level are now relatively easy to retrieve for many countries thanks to decades of data collection efforts.Footnote1 However, things get complicated when we need to access detailed and granular-level electoral results. Precinct-level electoral results and the associated GIS (Geographic Information System) files – which generally constitute the most granular data – are still difficult to obtain for many countries, including Italy.Footnote2
The present contribution aims to tackle this lack of data by providing a new openly available dataset of Italian electoral results, geocoded at precinct (‘sezione elettorale’) level.Footnote3 Along with this dataset, which we have dubbed ‘Sezioni Elettorali Italiane’ (SEI), we illustrate a set of methodological solutions intended to overcome the obstacles to collecting these types of data.Footnote4
Precinct-level electoral results are valuable for a variety of reasons. The first significant benefit is that a lower level of aggregation reduces the risk of ecological fallacy (Alabrese et al. Citation2019; Robinson Citation2009; Russo Citation2017; Schwartz Citation1994). Second, precinct-level electoral results provide an excellent alternative to using individual surveys, which can be affected by factors such as reporting bias (Amos, McDonald, and Watkins Citation2017; Bernstein, Chadha, and Montjoy Citation2001; Selb and Munzert Citation2013). Third, having information on the geographical residence of voters (often absent or scarce in surveys) opens up the possibility of carrying out very detailed spatial analysis (Beck, Gleditsch, and Beardsley Citation2006; Bivand et al. Citation2008; Darmofal Citation2015; Mobasheri et al. Citation2020; Sinton and Lund Citation2007; Weidmann and Schutte Citation2017).
The difficulty associated with collecting precinct-level and geolocated electoral results in Italy (as in many other countriesFootnote5) is twofold. First, precinct-level data are stored in (often) poor format at municipality level. Second, the dataset containing information linking voters to precincts (‘viario elettorale’) – which is used by electoral offices to allocate voters – does not generally provide geo-encoded information.
As far as we know, this is the first contribution that provides (1) a systematic methodology for building precinct boundariesFootnote6 and (2) a dataset of geocoded electoral precincts in Italy.Footnote7 In fact, although the territorial distribution of voting in Italy has been extensively studied – even at sub-municipal level – none of these studies have achieved such a level of granularity (Crulli Citation2022; Lelo, Monni, and Tomassi Citation2021; Truglia, Fruncillo, and Addeo Citation2018; Valbruzzi Citation2021).
We have organized the paper as follows. First, we present the institutional background of Italian elections and the methodology that we employed to build the dataset. Then, we apply our new dataset to conduct an exploratory analysis of voting patterns in the three larger Italian metropolises: Rome, Milan and Turin. We detected: a) a high level of heterogeneity of voting within cities, b) an increase in the spatial inequality and polarization of voting behaviour, and c) an increase in the concentration of left-wing voters towards the centre and wealthier areas of metropolitan centres (Cini et al. Citation2021; Dijkstra, Poelman, and Rodríguez-Pose Citation2020; Pratschke et al. Citation2021).
Background of the electoral process in Italy
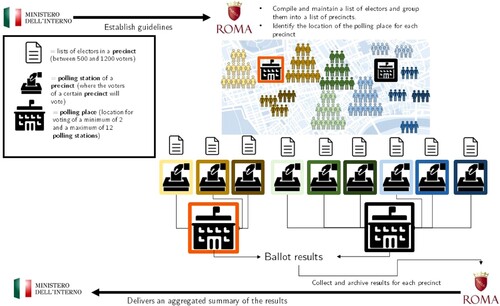
The very reason why electoral data at precinct level are not readily available can be traced back to the way in which the electoral process is structured and managed in Italy (which is similar to other countriesFootnote8). Precinct-level data are collected and archived in local municipal electoral offices and not transmitted to the central archive.Footnote9
The structure of the electoral process is based on a hierarchical framework. The Ministry of the Interior (Ministero dell’Interno) oversees the entire electoral process, which is implemented and organized by the local offices of municipalities (Ufficio elettorali dei comuni).
The local offices of municipalities compile the voter lists (liste elettorali / electoral roll) and classify voters into groups of precincts (sezioni elettorali), based on their place of residence. Voters in a precinct can only vote in the polling station (seggio elettorale) for that precinct, which is located in a predetermined polling place (locali del seggio elettorale).Footnote10 There can be from two to 12 polling stations assigned to each polling place.Footnote11
Precinct level is the most granular level for which electoral results can be retrieved. The size of Italian voting precincts usually ranges between 500 and 1,200 voters, but can also vary over those limits. The law permits (a small number of) exceptions where the conditions in terms of distance and viability pose problems in guaranteeing to the right to vote.Footnote12
According to Italian law, a citizen can cast his or her vote only in the predetermined polling place where the assigned polling station is located. In other words, voters cannot choose where to vote. Polling places are generally set up in certain selected public schools. There are some exceptions, represented by special polling stations (seggi speciali) set up within prisons and hospitals for people who are unable to get to their assigned polling stations, and by special rules for people working in polling stations on election day (who have the option of voting in the place where they are working).Footnote13
Each polling station is administered by a small committee headed by a President Officer (Presidente del seggio elettorale), who is responsible for ensuring that everything runs smoothly, that voting is done correctly.Footnote14 At the end of the vote count – carried out at the polling station – the Presiding Officer of each polling station delivers a summary of the results to the mayor’s representative (delegato del sindaco) at the electoral office for the municipality.
The results at precinct level are stored in the archive of the municipality’s electoral office. Only a summary of the results is delivered to the competent department of the Ministry of the Interior. summarizes the process described above.
Figure 1. Organization of the electoral process in Italy – example for the municipality of Rrome.
Methodology for constructing the GIS data
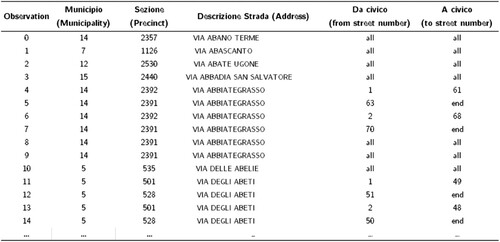
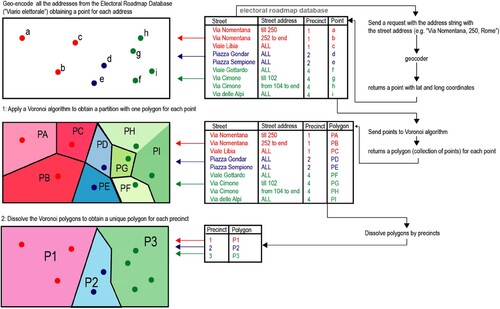
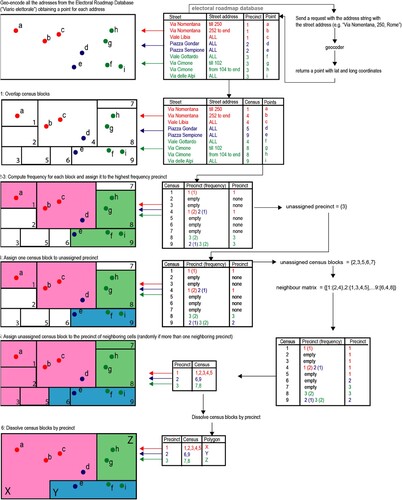
Data regarding the location of the precinct are not immediately available as a GIS shapefile. The Municipal Electoral Office only provides the Electoral Roadmap Dataset (Viario Elettorale).Footnote15 The Electoral Roadmap Dataset is a dataset that provides the ranges of addresses delimited by street numbers that belong to a specific precinct. The dataset aggregates the street name/ number data in the voter list file stored in the municipality archive.Footnote16 provides a snapshot of the Electoral Roadmap Dataset for the municipality of Rome.
Figure 2. The Electoral Roadmap Dataset.
As we can see, the Electoral Roadmap Dataset only provides the address in the form of a string and not the actual latitude and longitude coordinates. Thus, our first step is to obtain the coordinates of the addresses.
To do this, we geo-encoded the address strings for each address using a geocoder.Footnote17 After collecting the geocoordinates for all of the more than 30,000 addresses (in the Rome example) in the Electoral Roadmap Dataset, we were left with a cloud of geo-encoded points with latitude and longitude values. Each point-address we obtained belongs to a specific precinct.
After obtaining the cloud of geo-encoded address-points, we considered two different options to reconstruct the area of the precincts. The first option relies on using the Voronoi Diagram (Burrough, McDonnell, and Lloyd Citation2015, 160), while the second option uses census blocks.
Voronoi precinct
We have illustrated the algorithm for the first option (which we call Voronoi Precinct) in and in the following points.
1. For each point, compute the Voronoi area to obtain a set of polygons: one polygon for each point.
2. Dissolve all the Voronoi polygons among precincts and obtain one unique polygon for each precinct.
Figure 3. Voronoi procedure.
Census precinct
The algorithm for the second option (which we call Census Precinct) is represented in and described in the following points.
Overlap the shapefile of census blocks on the cloud of points.
For each census block, compute the frequency of points-per-precinct it contains.
Assign each census block to the precinct with the highest frequency (calculated in the previous step).
After steps 1–3 have been applied, some precincts will remain unassigned (because of the low frequency of their points), and some blocks will remain unassigned (because they do not have points on their surface). To assign all precincts to at least one census block, run the following loop:
Select all census blocks that have been assigned to a precinct that has already been assigned to more than one census block (>1).
Within the list census obtained from step 1, establish whether any of those census blocks contains at least one point belonging to an unassigned precinct. If you find one, assign the block to that precinct (for example, point e in ).
Repeat from 4a until all precincts have been assigned to at least one census block.
To assign any remaining unassigned census blocks to at least one precinct, run the following loop:
For each census block, obtain a list of all the precincts assigned to the neighbouring census blocks.
Assign the census block to a randomly chosen precinct from the list obtained in step 1.
Repeat until all census blocks have been assigned (we need this step because there might be census blocks that are isolated).
Dissolve all census blocks by precinct.
Figure 4. Census procedure.
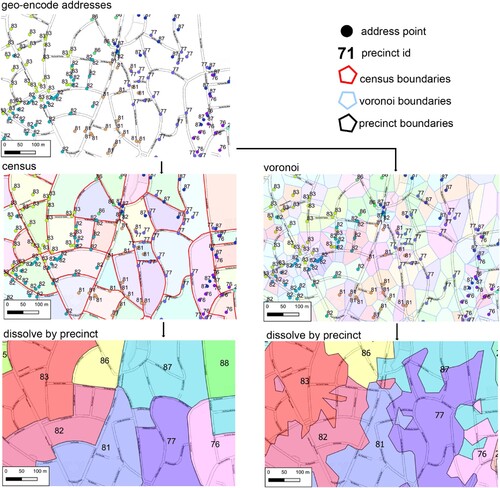
In both cases (Voronoi and Census precincts), we are left with a collection of polygons (one for each precinct). In we have provided an example of how the two procedures are applied to actual data.
Figure 5. A comparison between the two procedures (Voronoi vs Census) in a neighbourhood of Rome.
Limitations
As we can see, the two procedures produce two different collections of polygons. Which should be preferred? What are the pros and cons?
The census precinct overlaps the actual network of streets, while the Voronoi precinct does not (or not always). Census precincts are also generally contiguous areas, which is not often the case for Voronoi precincts.
Voronoi precincts can be applicable and scalable to other countries, even in the absence of census block shapefiles (or when census blocks are larger than precincts). In fact, the census precinct model relies on a relatively old shapefile (2011 for Italy) that might not sufficiently reflect the current urban structure of the local area.
Some other limitations apply to both procedures and are relevant for researchers who wish to use these data or are willing to replicate the exercise. First, the geo-encoding API might sometimes return blatantly wrong coordinates. We must exclude the points represented by those addresses where we believe that this is the case, applying a rule-of-thumb model.Footnote18 Second, in some cases multiple precincts might have a shared address. When this is the case, we must split the resulting geometry into as many pieces as there are overlapping precincts.Footnote19 Third, it is important to acknowledge that the polygons we produced do not represent the exact area and borders of the precincts, but are rather only a proxy of the area where voters live.Footnote20 Fourth, although census blocks and electoral precincts are constructed using a toponymic approach (for example, street names and numbers), there is no unique correspondence.Footnote21
These limitations are relevant and should be considered when using these data. However, as we will show in the next section through a validation procedure, we are confident that these methodologies represent a valuable data source and a reasonably good approximation.
Validation
Some Italian municipalities provide a GIS shapefile of precincts.Footnote22 We can look at these municipalities to validate our proposed methodologies. Our validation procedure will compare the GIS shapefile we obtained by employing our two methodologies (Census and Voronoi) with the official GIS shapefile provided by the municipality. As a case study, we examined the official GIS shapefile provided by the municipality of Rimini in the Emilia Romagna region.Footnote23 Polygons in the official GIS shapefile have been constructed by hand-drawing the boundaries from the local electoral office in the Electoral Roadmap Dataset. It should be noted that the official GIS shapefile does not have legal force, whereas the Electoral Roadmap Dataset does. Since the boundaries have been hand-drawn, they cannot be absolutely precise. Still, we believe they can represent a valuable external source for validating our methodologies.Footnote24
For validation purposes, we applied our methodology to the Electoral Roadmap Dataset for the municipality of Rimini, precisely applying the steps explained in the previous sections. After having obtained two GIS shapefiles using the two methodologies, we compared those shapefiles with the official shapefile provided by the municipality of Rimini.
Our validation procedure relies on two intuitive metrics – coverage and centroid distance – computed for each of the 142 precincts of the city of Rimini.
Coverage is the percentage area that overlaps between the polygon representing the official precinct and the corresponding polygon for the same precinct we produced using our methodologies (Census precinct and Voronoi precinct). Formally (EquationEquation 1(1)
(1) ), for each precinct
,
is equal to the ratio between: 1) the size of the area of intersection of polygon
(the polygon for the Official precinct
) and polygon
(the polygon produced by our methodology, either the Census precinct or the Voronoi precinct) and 2) the area of the polygon
(the Official precinct).
(1)
(1)
ranges between 0 and 1. It will be equal to 0 if the two polygons
and
do not have any area in common and equal to 1 if they overlap perfectly.
The second metric we use is the (EquationEquation 2
(2)
(2) ), which is the geodesic distance (expressed in kilometres) between the centroid
of polygon
(the ‘official’ polygon for precinct
) and the centroid
of polygon
.
has a positive value and can be a minimum of 0 (if the two centroids overlap perfectly) and a maximum distance equal to the diameterFootnote25 of the municipality.
(2)
(2) shows an example for one precinct. illustrates the descriptive statistics for the two metrics computed for all Voronoi and Census precincts in the municipality of Rimini compared to the official precincts. As we can see, the two procedures provide similar outcomes. On average, a Census precinct covers 67% of the area of an official precinct (70% for Voronoi precincts). The median value is 75% and 70% respectively. The average distance between centroids is 230 metres for Census precincts compared to 160 metres for Voronoi precincts. However, in this case also, the median values are much lower (100 and 70 metres). Manual review of the results shows that larger precincts skew the distribution to the right.Footnote26
Figure 6. Validation metrics.
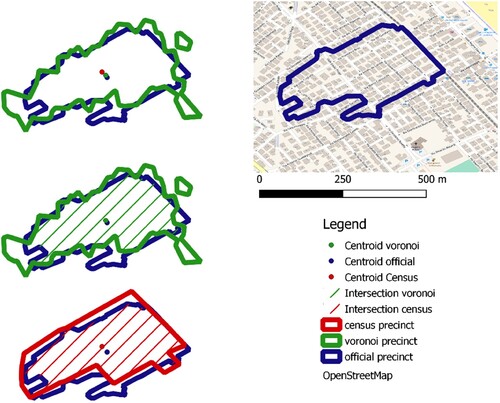
Table 1. Results for validation metrics.
The dataset
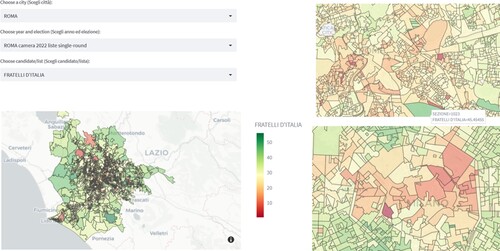
We applied the methodologies described in the previous sections to those cities that made the Electoral Roadmap Dataset available. At time of writing, the dataset includes ten of the largest Italian cities, covering 8 million people (13% of the Italian population). We are making the resulting geo-encoded dataset available in the form of an Esri shapefile, which can be downloaded from a public repository (https://github.com/-gabrielepinto/dati-sezioni-elettorali), in both formats (Voronoi and Census precinct). To enhance the usability of the data, we have attached the following to each dataset for each city: 1) a list of geocoded polling places with their geocoded locations, 2) interpolated census data from the National Institute of Statistics (ISTAT), and 3) a clean dataset of the precinct-level electoral results, collected from online archives of local municipalities. These data are poor quality and stored in a range of different formats (such as excel, html, etc.). We collected and cleaned all these files, creating unique CSV files (all with the same format). To provide an idea of the effort involved, the electoral archive for the municipality of Rome contains more than 5,000 excel files, relating to the last 20 years. Using Python, we cleaned all of those files to obtain one single file for each election. Furthermore, we constructed a web application to enable interactive exploration and display of the dataset ().Footnote27
Figure 7. Screenshot of the web app.
Exploratory analysis
This section provides a descriptive overview of the main electoral patterns that we observed using the SEI dataset. However, the dataset can be applied to conduct several other types of analyses.
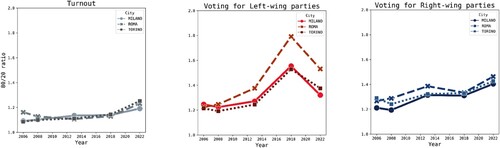
We explored spatial inequalities in voting behaviour, specifically examining whether voting patterns within cities have become more unequal and polarized over time. To do so, we used three different indices: a) the Gini inequality index, b) the Moran I index of Spatial Inequality, and c) the ratio between the 80th and 20th percentiles of the vote. The Gini Index is a widely used metric designed to evaluate the distribution of vote shares across a given area (Bochsler Citation2010). A lower Gini Index indicates less inequality in the distribution of electoral support. If support for a political party is evenly distributed, the index will be equal to 0. On the other hand, the Moran I Index is used to identify the presence of spatial autocorrelation and polarization (Kinsella, McTague, and Raleigh Citation2015; Moran Citation1950). The 80/20 percentile ratio measures the distance between the top and bottom of a distribution. A greater distance between the extremes suggests more polarization.
We calculated the three indices for turnout and voting for left and right-wing partiesFootnote28 in parliamentary elections held between 2006 and 2022. The three indices are plotted in , and . Overall, there has been a consistent increase in spatial inequality and polarization in voting behaviour over the selected period. This trend is particularly pronounced for left-wing parties. Indeed, there was sustained growth in the polarization of left-wing electoral support until the peak in 2018.
Figure 8. Inequality in voting behaviour – Gini Index.
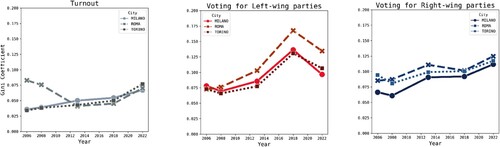
Figure 9. Spatial polarization in voting behaviour – Moran I Index.
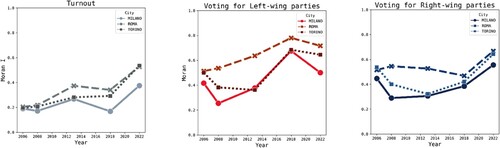
Figure 10. Spatial inequality in voting behaviour – Polarization index (80/20 percentiles ratio).
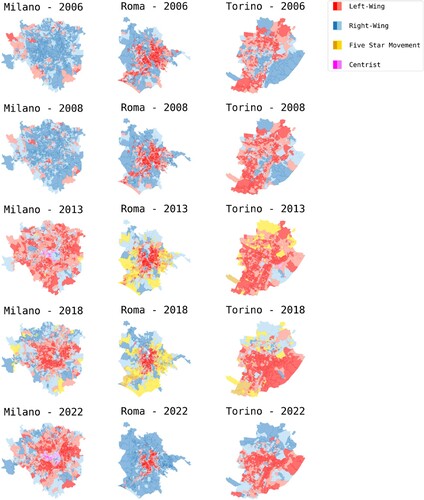
We also plotted maps showing the type of coalition/party that earned the most votes in each precinct during all the parliamentary elections under consideration (; lighter colours highlight a narrow margin below 10%). We can thus detect a trend of concentration of left-wing electoral support in more central areas of major cities, which often correspond to wealthier areas. This trend is particularly evident in Milan and Rome. At the same time, we account for the emergence of the M5S (Movimento 5 Stelle (Five Star Movement)) in the outskirts of Rome and Turin.
Figure 11. First party/coalition in national election at precinct level.
These findings suggest that spatial inequalities in voting behaviour may be a significant factor influencing the political landscape in cities and should be further examined in order to understand the underlying causes and potential consequences. One possible explanation for the increase in spatial inequality and polarization in voting behaviour that we observed could be the increasing economic and social divide between different geographical areas. Certain better-off neighbourhoods or districts within major cities have much higher levels of wealth and education, compared to lagging, disadvantaged and usually peripheral places that have lower levels of these resources. This can lead to divergent political preferences, with those in more affluent areas tending to support different parties than those in poorer areas. Furthermore, the concentration of certain groups in specific geographical areas can contribute to political polarization, as these groups may have more influence in shaping the political landscape in their area. Other potential factors that could be contributing to the observed trend include changes in media and communication patterns, changes in political parties and their platforms, or shifts in social and cultural values within different communities (Agnew Citation1996; Cini et al. Citation2021; Crulli Citation2022; Dijkstra, Poelman, and Rodríguez-Pose Citation2020; Emanuele Citation2018; Johnston, Manley, and Jones Citation2016; Pratschke et al. Citation2021; Truglia, Fruncillo, and Addeo Citation2018; Walks Citation2005). Further research is needed to properly understand the underlying causes and consequences of these trends.
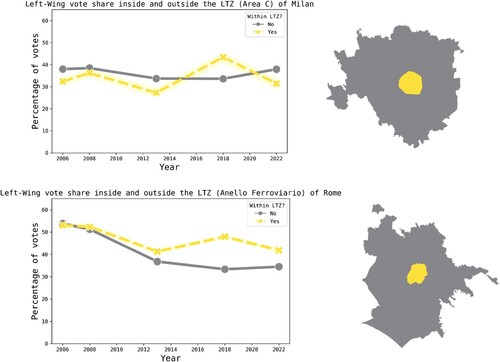
In the last part of our exploratory analysis, we took a deeper look at the most central areas of cities, also known as LTZ (Limited Traffic Zones). In doing so, we attempted to test a definition that has become very popular among commentators in the aftermath of the 2018 election: ‘partito delle ZTL’ (an LTZ party). Commentators have used this definition to refer to left-wing parties (especially the Partito Democratico (PD) (Democratic Party) and its allies) and the progressive concentration of their consensus in the most central and wealthiest areas of cities at the expense of peripheral areas.Footnote29
In , we have plotted the mean share of votes for left-wing parties, distinguishing between precincts inside and outside the LTZ. In Milan (top panel) we can see this inner/outer divide only in the 2018 election. In Rome (bottom panel), however, we can see a divide emerging since 2013, when left-wing parties started to become more popular within rather than outside the LTZ area. However, we do not see the huge difference often described in public discussion (D’albergo Citation2022; Domani Citation2022; Ferrara Citation2018; Zurlo Citation2022). As for Milan, much of the loss incurred by right-wing parties in LTZ areas has actually been captured by centrist parties (pink polygons in ).
Figure 12. Support for left-wing parties in Limited Traffic Zones (national elections).
Conclusions
Precinct-level electoral data and the related GIS files can be incredibly valuable for researchers studying electoral patterns, but they are among the most challenging data types to collect. In this study, we developed a new methodology and technical guide designed to overcome these challenges and make these data more accessible in Italy. Our dataset currently includes data from the ten largest Italian cities, covering the past 20 years. However, we plan to continue with the project, including more cities and countries.
The exploratory analysis on our dataset revealed interesting voting patterns and trends in large Italian cities. Specifically, we found evidence of increasing spatial polarization of voting behaviour, with certain areas becoming more politically heterogeneous over time. We also observed a trend towards a concentration of left-wing voters in wealthier, central areas of these cities. Various socio-spatial factors – such as income, education and geographic location – may influence these trends.
The granularity of these data allows us to delve more deeply into these trends and explore the underlying causes of spatial polarization and inequality in voting behaviour. This information can be useful for policymakers and political analysts looking to better understand the political landscape in these cities and how it may change over time.
Data availability statment
The data that support the findings of this study are openly available in a github repository that can be accessed at this link https://github.com/gabrielepinto/dati-sezioni-elettorali
Disclosure statement
No potential conflict of interest was reported by the author(s).
Additional information
Funding
Notes
1 For international dataset of elections see the CLEA project (Kollman et al. Citation2019). For Italy, see the Eligendo Project (Dell’Interno Citation2021).
2 Until a few years ago, precinct-level electoral data were also scarce outside Europe. However, there have been significant contributions to collecting this type of data in the United States (Baltz et al. Citation2022; Voting and Election Science Team Citation2020).
3 In Italy, electoral precincts correspond to ‘sezioni elettorali' or ‘electoral sections'. They are the smallest units into which electoral districts are divided and comprise between 500 and 1,200 voters.
4 We also provide:
1) A repository with the whole dataset and a Python package that can be used to reproduce the study and to replicate the methodology for other cities and countries (https://github.com/gabrielepinto/dati-sezioni-elettorali).
2) A user-friendly dashboard with interactive maps to explore the dataset (https://gabrielepinto-dashboard-sezioni-elettorali-appstreamlite-4t5mbj.streamlit.app/).
5 In the next section we will discuss circumstances that are specific to Italy. However, Willis et al report very similar experiences for the United States (Willis, Merivaki, and Ziogas Citation2021).
6 There are some contributions on this issue for the United States, mainly from a series of publications by Brian Amos and Michael McDonald. However, none of these specifically addresses the methodology for reconstructing precinct boundaries (Amos, McDonald, and Watkins Citation2017; Amos, Smith, and Claire Citation2017; Baltz et al. Citation2022; Voting and Election Science Team Citation2020). See also: https://openprecincts.org/about/.
7 The most important contribution on this type of data in Italy is from Keti, Monni and Tomassi, authors of the ‘mapparoma' project (https://www.mapparoma.info/). These authors provide electoral data (for the city of Rome only) for ‘urban zones' (‘zone urbanistiche’) (Lelo, Monni, and Tomassi Citation2021). In addition to expanding the coverage to other cities, we have also significantly increased the level of granularity of the data. This is 16 times greater (the city of Rome is divided into 155 ‘zone urbanistiche’ and 2,600 ‘sezioni elettorali'). Another important contribution that should be mentioned is the work by Corbetta and Piretti (Corbetta and Piretti Citation2009), who have created a historical atlas of Italian elections (1860 to 2008). However, their data are generally aggregated at municipality level.
8 For instance, see the obstacles to the collection of precinct-level data in the US (Willis, Merivaki, and Ziogas Citation2021).
9 According to a request for clarification (accesso civico), the Ministry of the Interior’s Internal and Local Affairs Department (Dipartimento affari interni e territoriali) is currently running an experimental program to check the feasibility of collecting precinct results from municipalities. No data have yet been made available by the Ministry. In the absence of a centralized archive and coordinated standards, collection of all precinct data requires an examination of 7,980 archives (almost the total number of Italian municipalities).
10 To clarify, each voter is assigned to a precinct (sezione), and can only vote in a specific corresponding polling station (seggio elettorale) that is located in a polling place (locale del seggio elettorale) representing multiple polling stations. The polling station is a specific room where only voters from a certain precinct can vote. The polling station is located in a building that constitutes the polling place, where there are multiple polling stations.
11 Article 34 of Presidential Decree No 223 of 20 March 1967.
12 Article 34 of Presidential Decree No 223 of 20 March 1967.
13 Article 40 of Presidential Decree No 570 of 16 May 1960; Article 48 of Presidential Decree No 361 of 30 March 1957; Article 51 of Presidential Decree No 361 of 30 March 1957.
14 Both the Presiding Officer and the poll clerks are appointed from among citizens enrolled in specific registers (‘albo degli scrutatori' and ‘albo dei presidenti di seggio').
15 Some municipalities do offer an electoral precinct shapefile. The largest of these are Florence and Rimini.
16 For this reason, the procedure we have described here could be reproduced by aggregating voter list files (liste elettorali). The voter list file for Italian municipalities should be accessible for research purposes under Italian law. However, in practice, it is difficult to obtain these files in digital format. We tried to request the voter list file from the electoral office in Rome but without success.
17 Using the address shown in as an example, for the first observation, we submitted the query with the name of the street ‘Via Abano Terme, Roma, Italy' to the API for the geocoder. The API returned the location of the street with latitude and longitude. In some cases, a unique street corresponds to multiple precincts depending on the street number. For instance, in the example above (), ‘Via Abbiate Grasso' corresponds to multiple precincts: odd street numbers from 1 to 61 and even street numbers from 2 to 68 vote in precinct 2392, while all other residents of ‘Via Abbiate Grasso' vote in precinct 2391. In those cases, we submitted four different queries to the API: ‘Via Abbiate Grasso 1', ‘Via Abbiate Grasso 2', ‘Via Abbiate Grasso 68' and ‘Via Abbiate Grasso 61' for precinct 2392, and ‘Via Abbiate Grasso 70' and ‘Via Abbiate Grasso 63' for precinct 2391.
18 Clearly wrong geo-encoding occurs when 1) the coordinates received are outside the administrative boundaries of the municipality, or 2) the coordinates are extremely far from other points of the same precinct (we set the bar at three times larger than the mean distance between all other points of the same precinct). In Appendix 2 we have provided a comprehensive explanation of the process we have applied (Figure A-2, A-3 and A-4).
19 For example, in the Electoral Roadmap Dataset for the municipality of Rome, there are five precincts (with IDs from 2413 to 2417) that all correspond to only one unique address: Largo dell’Olgiata 15.
20 The address we geo-encoded is the ‘postal address' of a voter. This might not coincide with the voter’s residence if the street entrance is some distance from where the house is located.
21 In principle, both electoral precincts and census blocks are created from a dataset of addresses and street numbers. In theory, they should be reconcilable. However, the two procedures are carried out with clearly different objectives: census blocks are created for statistical purposes, while electoral precincts are only created to assign voters to polling stations in line with the limit imposed by existing legislation (as discussed in the first section of this paper). In a private conversation with municipal officers, those individuals confirmed to us that the two procedures are performed independently. The only exception is the boundaries of electoral constituencies (‘collegi elettorali'). In fact, when the new electoral law for parliamentary elections came into force in 2018, the National Institute of Statistics (ISTAT) had to design the new boundaries for the constituencies (Commissione Collegi Elettorali Citation2020). When the commission responsible needed to assign multiple constituencies to one municipality, it used statistical sub-units within the municipality. For instance, in the case of Rome, the commission used the boundaries of the ‘Zone Urbanistiche’, which represent an aggregation of census blocks. For this reason, the boundaries of electoral constituencies will match the boundaries of census blocks. However, in some cases, an electoral precinct could overlap different electoral constituencies. In such cases, the law envisages that the precinct be assigned to the constituency where the polling place is located (Article 3(2) of Legislative Decree No 189/2017).
22 Rimini, Florence and Genoa.
23 Available here: https://opendata.comune.rimini.it/dataset/sezioni-elettorali1.
We chose the municipality of Rimini (and not Florence or Genoa) because that municipality made available both the GIS shapefile and the Electoral Roadmap Dataset. We also had several personal contacts with the local office of the municipality who provided helpful explanations about the data. That was not the case for the municipality of Florence, which did not respond to our requests for clarification.
24 This is the clarification we received from the office: ‘The shapefile was drawn manually following the electoral roadmap, where the streets names and numbers belonging to each section are indicated. Because the borders do not pass through the center line, they are not absolutely precise and must be reviewed periodically, since new constructions in the map could be shown visually in another precinct' (translation from Italian to English by the author).
25 For example, the diameter of the circle that contains the entire area of the municipality.
26 In larger precincts the Centroid Distance metric is higher. The distribution of the metrics is right-skewed, with the mean larger than the median because of the presence of large extreme values.
28 We classified all parties competing in national elections into four main groups: left-wing, right-wing, Five-Star Movement (M5S) and centrist. In the ‘Appendix Table A-1', we have provided a full list of parties for each group.
29 The term ‘Partito delle ZTL' became popular after it was mentioned by the journalist Massimo Giannini on a political talk show (Di Martedì) on 13 March 2018 (just after the elections on 4 March). However, the term had already appeared in some twitter discussions from that time, and it seems that its coining can be attributed to the journalist Leonardo Panetta (Mediaset): https://twitter.com/marcobreso/status/972047046332035072.
References
- Agnew, J. 1996. “Mapping Politics: How Context Counts in Electoral Geography.” Political Geography 15 (2): 129–146.
- Alabrese, E., S. O. Becker, T. Fetzer, and D. Novy. 2019. “Who Voted for Brexit? Individual and Regional Data Combined.” European Journal of Political Economy 56: 132–150.
- Amos, B., M. P. McDonald, and R. Watkins. 2017a. “When Boundaries Collide.” Public Opinion Quarterly 81 (S1): 385–400.
- Amos, B., D. A. Smith, and C. S. Claire. 2017b. “Reprecincting and Voting Behavior.” Political Behavior 39 (1): 133–156.
- Baltz, S., A. Agadjanian, D. Chin, J. Curiel, K. DeLuca, J. Dunham, J. Miranda, et al. 2022. “American Election Results at the Precinct Level.” Scientific Data 9 (1): 1–12.
- Beck, N., K. S. Gleditsch, and K. Beardsley. 2006. “Space is More than Geography: Using Spatial Econometrics in the Study of Political Economy.” International Studies Quarterly 50 (1): 27–44.
- Bernstein, R., A. Chadha, and R. Montjoy. 2001. “Overreporting Voting.” Public Opinion Quarterly 65 (1): 22–44.
- Bivand, R. S., E. J. Pebesma, V. Gómez-Rubio, and E. J. Pebesma. 2008. Applied Spatial Data Analysis with R. New York: Springer.
- Bochsler, D. 2010. “Measuring Party Nationalisation: A new Gini-Based Indicator That Corrects for the Number of Units.” Electoral Studies 29 (1): 155–168.
- Burrough, P. A., R. A. McDonnell, and C. D. Lloyd. 2015. Principles of Geographical Information Systems. Oxford: Oxford university press.
- Cini, L., P. Colloca, N. Maggini, F. Tomassi, and M. Valbruzzi. 2021. “Inchiesta su periferie urbane, disagio socio-economico e voto. I casi di Bologna, Firenze e Roma.” Quaderni Di Scienza Politica 28 (2): 137–177.
- Commissione Collegi Elettorali. 2020. Proposta dei collegi uninominali e plurinominali per la Camera dei deputati e il Senato della Repubblica. http://www.riformeistituzionali.gov.it/media/1364/commissione-collegi-elettorali_relazione_13-novembre-2020-con-errata-corrige.pdf.
- Corbetta, P., and M. S. Piretti. 2009. Atlante Storico-Elettorale D’Italia: 1861-2008. Bologna: Zanichelli.
- Crulli, M. 2022. Vote Metropolitanization After the Transnational Cleavage and the Suburbanization of Radical Right Populism: The Cases of London and Rome. Quaderni Dell’Osservatorio Elettorale QOE-IJES 85.1: 3–21.
- D’albergo, L. 2022, September 26. Il Pd va sotto anche nel centro storico di Roma. Non era mai successo: “Non siamo più il partito della Ztl.” La Repubblica. https://roma.repubblica.it/cronaca/2022/09/26/news/pd_roma_centro_storico_ztl_sconfitta-367334149/.
- Darmofal, D. 2015. Spatial Analysis for the Social Sciences. New York: Cambridge University Press.
- Dell’Interno, M. 2021. Eligendo. https://elezioni.interno.gov.it/.
- Dijkstra, L., H. Poelman, and A. Rodríguez-Pose. 2020. “The Geography of EU Discontent.” Regional Studies 54 (6): 737–753.
- Domani, E. 2022. Il Pd resta chiuso in una Ztl sempre più stretta. Domani. https://www.editorialedomani.it/politica/italia/il-pd-resta-chiuso-in-una-ztl-sempre-piu-stretta-uvfs78pu.
- Emanuele, V. 2018. Cleavages, Institutions, and Competition: Understanding Vote Nationalization in Western Europe (1965-2015). Washington DC: Rowman & Littlefield.
- Ferrara, E. 2018. PD, OVVERO IL PARTITO DELLE ZTL. https://ricerca.repubblica.it/repubblica/archivio/repubblica/2018/06/27/pd-ovvero-il-partito-delle-ztlFirenze01.html.
- Johnston, R., D. Manley, and K. Jones. 2016. “Spatial Polarization of Presidential Voting in the United States, 1992–2012: The “Big Sort” Revisited.” Annals of the American Association of Geographers 106 (5): 1047–1062.
- Kinsella, C., C. McTague, and K. N. Raleigh. 2015. “Unmasking Geographic Polarization and Clustering: A Micro-Scalar Analysis of Partisan Voting Behavior.” Applied Geography 62: 404–419.
- Kollman, K., A. Hicken, D. Caramani, D. Backer, and D. Lublin. 2019. Constituency-Level Elections Archive (CLEA)(Data File and Codebook). Ann Arbor, MI: Center for Political Studies, University of Michigan (Producer and Distributor). Available at: http://www.Electiondataarchive.Org.
- Lelo, K., S. Monni, and F. Tomassi. 2021. Le mappe della disuguaglianza: una geografia sociale metropolitana. Roma: Donzelli Editore.
- Mobasheri, A., H. Mitasova, M. Neteler, A. Singleton, H. Ledoux, and M. A. Brovelli. 2020. “Highlighting Recent Trends in Open Source Geospatial Science and Software.” Transactions in GIS 24 (5): 1141–1146. Wiley Online Library.
- Moran, P. A. 1950. “Notes on Continuous Stochastic Phenomena.” Biometrika 37 (1/2): 17–23.
- Pratschke, J., T. Vitale, N. Morelli, B. Cousin, M. Piolatto, and M. Del Fabbro. 2021. “Electoral Support for the 5 Star Movement in Milan: An Ecological Analysis of Social and Spatial Factors.” Journal of Urban Affairs 43: 1–24.
- Robinson, W. S. 2009. “Ecological Correlations and the Behavior of Individuals.” International Journal of Epidemiology 38 (2): 337–341.
- Russo, L. 2017. “The use of Aggregate Data in the Study of Voting Behavior: Ecological Inference, Ecological Fallacy and Other Applications.” In The Routledge Handbook of Elections, Voting Behaviorand Public Opinion, edited by Justin Fisher, Edward Fieldhouse, Mark N. Franklin, Rachel Gibson, Marta Cantijoch, and Christopher Wlezien, 484–495. London: Routledge.
- Schwartz, S. 1994. “The Fallacy of the Ecological Fallacy: The Potential Misuse of a Concept and the Consequences.” American Journal of Public Health 84 (5): 819–824.
- Selb, P., and S. Munzert. 2013. “Voter Overrepresentation, Vote Misreporting, and Turnout Bias in Postelection Surveys.” Electoral Studies 32 (1): 186–196.
- Sinton, D. S., and J. J. Lund. 2007. Understanding Place: Gis and Mapping Across the Curriculum. Redlands, CA: ESRI, Inc.
- Truglia, F. G., D. Fruncillo, and F. Addeo. 2018. “Territorializzazione del consenso elettorale: Determinati spaziali, socio-economiche e culturali.” Fruncillo e Addeo (a Cura Di) Le Elezioni del 2018 1: 83–111.
- Valbruzzi, M. 2021. Comportamento Elettorale e Disagio Sociale Nelle Città Italiane. Bologna: Il Mulino.
- Voting and Election Science Team. 2020. 2020 Precinct-Level Election Results. Harvard Dataverse.
- Walks, R. A. 2005. “City–Suburban Electoral Polarization in Great Britain, 1950–2001.” Transactions of the Institute of British Geographers 30 (4): 500–517.
- Weidmann, N. B., and S. Schutte. 2017. “Using Night Light Emissions for the Prediction of Local Wealth.” Journal of Peace Research 54 (2): 125–140.
- Willis, D., T. Merivaki, and I. Ziogas. 2021. “Election Data Transparency: Obtaining Precinct-Level Election Returns.” Public Integrity 24(2): 1–16.
- Zurlo, S. 2022, https://www.ilgiornale.it/news/politica/pd-partito-ztl-ormai-fuori-realt-2070351.html “il pd è il Partito Della ztl, Ormai Fuori Dalla Realtà.” In IlGiornale.it.
Appendix 1:
Coverage of the dataset and classification of parties
Figure A1. Coverage of the dataset.
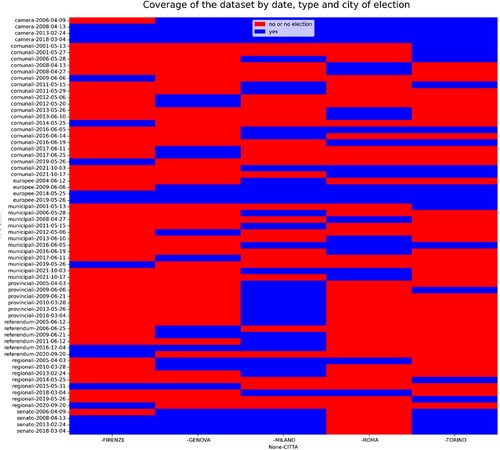
Table A1. Classification of parties
Appendix 2:
Data Cleanup
The geocoder results can often provide wrong coordinates for addresses. How can we deal with these errors? The following paragraphs provide a detailed explanation that primarily relies on a rule-of-thumb model derived from manual inspection of these errors.
Before explaining our cleanup procedure, we would like to state some crucial assumptions. First, different geocoders and contexts (city or country) might require different approaches. Second, while the procedure might be prone to errors, the final results might not be affected, especially when we use the census procedure to clean up residual error points using the ‘majority’ rule (step 3 of the census procedure). Third, we can evaluate the quality of the results by comparing the final precinct polygons against an externally hand-drawn dataset (such as we do in the main corpus of the paper for the city of Rimini). Of course, if we had an external dataset of geocoded addresses, we could evaluate the errors made by the geocoder, but, in that case, we would not need a geocoder at all! If the Archivio nazionale degli stradari e dei numeri civici (ANSC) project is delivered in the future, we would no longer need a geocoder. In this example, we will look at the city of Turin, but the same reasoning applies to other cities.
Cleaning points outside a city or a municipality (Figure A-2)
The first thing we do is check whether the coordinates are in the municipality of Turin. In the example below (Figure A-2), we can see that some points (those highlighted in yellow) fall well outside the municipal border (retrieved from ISTAT). These points are errors in the geocoder. At the same time, some points fall just at or over the border (see the green markers). These points are less likely to be errors. They might be points that fall precisely on or very close to the boundaries. To avoid deleting these points, we buffer the city borders slightly. After the buffering process, we keep all points within the city. By doing this, we have eliminated all points that are definitely geocoder errors because they fall into the wrong municipality.
Cleaning errors within a municipality
Identifying geocoder errors within a municipality is much more difficult. We should distinguish two fundamental cases.
The first case is when the geocoder cannot find the address. In this case, most of the geocoder will always return to the city’s centroid point. How do we identify these errors? The fastest way is to sort all geocoded points by their frequency. If some addresses have abnormal frequencies, they are most likely errors. Figure A-3 provides an example for Turin and Palermo, highlighting the erroneous values in yellow.
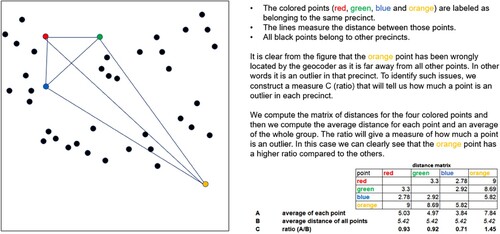
The second case builds on simple intuition. A point should be close to all other points in the same precinct. If a point is far from all other points in the same precinct, it is likely an error. To identify these errors, we compute an index of how much a point is an outlier in each precinct. Figure A-4 shows the calculation using a graphical example. By manual inspection of these cases, we set a threshold as a rule of thumb where points with an index larger than 3 will be labelled as errors and dropped. For precincts with only two points, this procedure is not applicable. In these cases, we simply compute distances between points in the same precinct and check which ones have the highest value. When this value is higher than plausibly expected (3 km), we manually examine whether these points are not wrong.
Figure A2. Delete points outside city borders.
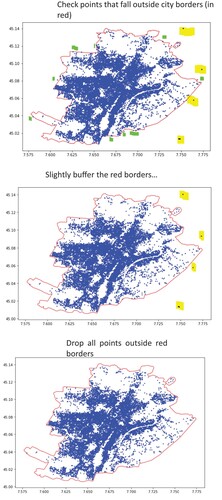
Figure A3. Geocoder errors in Palermo and Turin.
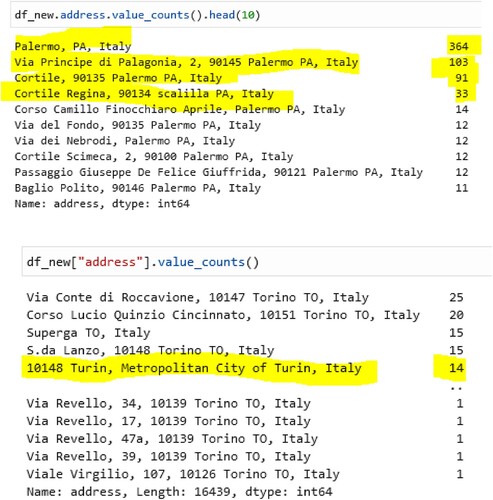
Figure A4. Label wrongly geocoded points.