Abstract
Al-alloys incorporating Mn, Cr and Zr, tailored for powder bed fusion-laser beam processes with solubilities three times equilibrium have recently been developed that yield a high strength. Mn and Cr-enriched precipitates that form during printing and heat treatment influence the material’s mechanical properties hence making it important to understand their kinetics. In this study, direct imaging of these precipitates was accomplished through the utilisation of in situ synchrotron-based scanning X-ray fluorescence. During heat treatment, a selective accumulation of Cr and Mn in two distinct types of precipitates at grain boundaries was observed. Additionally, the microstructure at the melt-pool boundary, containing precipitates found in the as-printed state, remains thermally stable during the heat treatment. Both these results shed light on the active role Cr plays in the precipitation kinetics of the material. The study also demonstrates the significant value of employing high-sensitivity in-situ X-ray fluorescence microscopy in exploring the kinetics of sub-micrometre scale precipitation.
GRAPHICAL ABSTRACT

Introduction
Powder bed fusion-laser beam (PBF-LB) is an additive manufacturing (AM) process that leverages selective melting of a thin layer of metal powder (20–80 µm thick) using a laser of small spot diameter (40–100 µm) (DebRoy et al., Citation2018; Gu et al., Citation2012). The process entails a high cooling rate (103–105 K/s) which for aluminium (Al) alloys enables higher supersaturation of alloying elements (Jones, Citation1978; König et al., Citation2023). Using rapid solidification, previously >10 wt% of Mn and Cr have been dissolved in solid solution in Al-alloys. These alloys were then strengthened via precipitation hardening due to the formation of nanoscale Al12(Mn,Cr) or alpha-AlMnSi precipitates (Izumi et al., Citation1968; Li et al., Citation2012; Liu et al., Citation1988; Shechtman et al., Citation1984). It is widely acknowledged that precipitation hardening is the most efficient mechanism for increasing strength in Al-alloys (ASM International, Citation1998; Easterling & Porter, Citation1992; Totten, Citation2016). As-printed Al-alloys produced through the PBF-LB process demonstrate similar supersaturation of solutes and quenched-in vacancies (Leicht, Citation2020; Mehta et al., Citation2022; Wang et al., Citation2020) thus the rapid solidification during the PBF-LB process allows for the introduction of new elements, facilitating the exploration of novel precipitation reactions. This has led to the creation of Al-Mn-Cr-Zr based alloys, specifically tailored for the PBF-LB process. It was shown in (Mehta et al., Citation2022) that precipitation hardening of such an alloy induced by direct ageing results in a 40 Vicker’s Hardness (HV) increase reaching 142 HV in peak aged condition. The addition of Mn and Cr leads to an increase in hardness from solid solution strengthening in as-printed condition, and partly by the formation of needle-/plate-like Mn-rich precipitates during heat treatment. In as-printed conditions, the microstructure contains low amounts of precipitation (<1%), mostly in the form of large Mn-rich precipitates at melt pool boundaries. In addition, large Mn-rich precipitates form at grain boundaries during heat treatments. Due to their size, all the latter mentioned large Mn-rich precipitates can severely compromise ductility thus making it important to study them. Finally, Cr within several of these precipitates has been detected, although its exact role remains uncertain. In this study, our investigation focuses on the distribution of Cr and Mn at grain boundaries and melt pool boundaries during heat treatment of the recently developed Al-Mn-Cr-Zr alloy.
Other studies have investigated solid-liquid interphases (Eswara et al., Citation2016) or precipitation behaviour in as-atomised Al-Cr-Mn-Co-Zr alloy powders and hot extruded samples using in-situ heat treatment in the STEM (Leonard et al., Citation2021; Vijayan et al., Citation2019). These studies depicted the precipitation of a Mn- and Cr-rich phase. However, no elemental mapping during heating was reported. In the present study, we use synchrotron scanning X-ray fluorescence (s-XRF) for in-situ elemental mapping during heat treatment of the as-printed alloy. Using scanning XRF it is possible to spatially resolve the distribution of elements even at very low concentrations (Troian et al., Citation2018). Using this technique, we get further insight into the microstructural evolution during heat treatments.
Materials and methods
Cubic samples (10 mm side) with >99.8% relative density were manufactured using an EOS M290 PBF-LB machine equipped with a Yb-fiber laser. Parameters used for printing were 370 W power, 1300 mm/s laser speed, 0.13 mm hatch distance and 0.03 mm layer thickness (Mehta et al., Citation2023). A standard scan rotation of 67° was applied between each layer. The samples were made from as-atomised powder (20–53 µm) of Alloy C, see . Please note that Fe and Si are impurities from the atomisation process. A one-axis equilibrium curve drawn using ThermoCalc is shown in as a guide to understanding the possible phases formed in the material upon solidification and during heat treatments at 375 °C.
Figure 1. ThermoCalc one-axis simulation for alloy C which provides a calculated estimate of the stable phases at different temperatures. The inset in red shows phases that may form upon heat treatment at 375 °C. Image redrawn similar to (Mehta et al., Citation2022), calculations conducted with COST507 database (Ansara et al., Citation1998) using ThermoCalc 2022a.
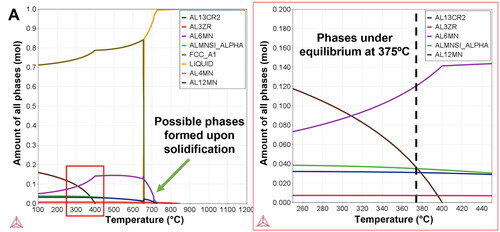
Table 1. Chemical composition (in wt%) of the sample in as-printed condition (Mehta et al., Citation2022).
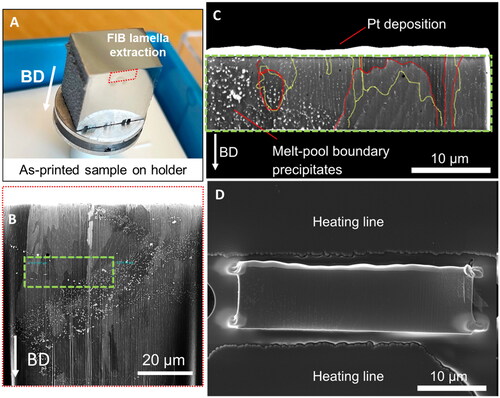
A lamella of material in as-printed condition was extracted and thinned using a Xe+ Plasma Focused Ion Beam (PFIB) SEM (TESCAN AMBER X microscope) (). The inert Xe+ ion source PFIB was used to avoid Ga contamination of grain boundaries commonly occurring with liquid Ga FIB systems (Unocic et al., Citation2010; Xiao et al., Citation2019; Zhong et al., Citation2021). Rocking stage polishing was utilised as the final preparation step, mitigating curtaining artefacts on the lamella surfaces. The lamella was roughly 10 µm and 30 µm in height and width respectively, and 1 µm in thickness. The final lamella can be seen in ). Extraction from the cubic sample () was done along the build direction, containing regions with both melt pool boundary precipitates and solidification boundary precipitates (Mehta et al., Citation2022). The lamella was glued onto a Climate in-situ heating chip (DENSSolutions) by Pt deposition in the corners as seen in ).
Figure 2. Lamella preparation. (A) shows the as-printed sample showing approximately the location of FIB lamella extraction with build direction (BD) marked. (B) is a BSE image of the sample in FIB-SEM wherein the location for final lamella extraction is marked in green. (C) shows the thinned-down lamella before placement on the heating chip. The bright layer on top of the lamella is a protective Pt deposition. Red and yellow lines mark the location of grain boundaries, as seen from both sides of the lamella. (D) Shows the placement of the lamella between two heating lines on the in-situ heating chip. Corners are glued by Pt deposition.
In-situ scanning X-ray fluorescence measurements were performed under an N2 atmosphere using the Climate (DENSsolutions) sample holder with a designed interface adapted for hard X-ray microscopy at the P06 synchrotron beamline at PETRA III, DESY, Hamburg (Fam et al., Citation2019; Schropp et al., Citation2020). The flux was ∼108 ph/s with a photon energy of 9 keV. The spot size on the sample was estimated to be 70 x 70 nm2 from ptychographic reconstructions of the probe, which also serves as an estimate of spatial resolution. Fluorescence was collected using an annular detector (Rococo 3, PNDetector), placed directly upstream from the sample and centred around the beam. Fluorescence data was normalised to the incoming beam intensity and fitted with the pyMCA package to produce elemental map images (Solé et al., Citation2007). Elemental image stacks were co-registered using the OpenCV python package.
In the experiment, the elemental changes due to annealing at 375 °C were to be followed in detail, and thus the following procedure was adopted. For capturing microstructural evolution on different length scales, as well as high temporal and spatial resolutions, four different types of scans were performed. Three shorter in-situ scans were conducted while the sample was held at 375 °C. The first scan was done on the complete lamella with a step size of 150 nm and an exposure time of 20 ms (not shown) for the capture and correction of drift. Two regions of interest spanning 5 µm × 5 µm were then scanned using a 50 nm step size and 120 ms exposure time. One region of interest was at a grain boundary and the second at a melt pool boundary as illustrated in . These three scans were performed in a sequence once every hour. At hours 0, 4, 8, 14, 16, and 24, the sample was cooled to room temperature, where longer scans were performed of the whole lamella, with 50 nm step size and 30 ms exposure time. Cooling of the sample was to prevent significant microstructural changes during the 90-minute scan. Heating and cooling rates were 15–20 °C/min and 45–50 °C/min respectively to avoid sudden contraction/expansion of the lamella. It was previously shown that no microstructural changes occur below 300 °C (Mehta et al., Citation2022), thus the heating/cooling leads to minimal microstructural change (<5 min per cycle). Additionally, comparing this approach to continuous ex-situ heat treatment showed consistent qualitative microstructural features (see Appendix) thus validating our methodology to represent precipitation in-situ for this alloy system.
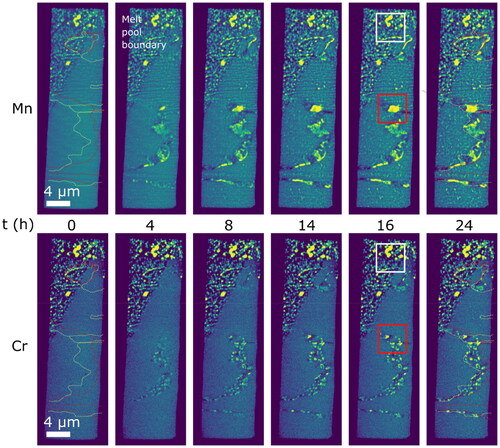
Figure 3. Microstructural evolution during 24 h of heat treatment at 375 °C illustrated by the elemental distribution of Mn (top) and Cr (bottom). Dashed red and yellow lines indicate grain boundaries as observed from each opposite face of the lamella. The regions highlighted in red and white squares contain grain boundary precipitates and melt pool boundary precipitates respectively.
Results
In , the Mn and Cr distribution in the whole lamella can be seen, as a function of heat treatment time. Before heating (time 0 h), precipitates containing Mn and Cr can be seen in the melt pool boundary and a few small Mn-rich precipitates in solidification boundaries. The elemental distribution in the rest of the lamella appears homogeneous. Already after 4 h, Mn- and Cr-rich precipitates can be seen growing in the lamella preferentially at grain boundaries. Although the lamella is only 1 µm thick, it is important to note that the recorded images are the projections of the 3D elemental distributions through its thickness. Thus the precipitates can appear larger in projection, due to them forming along a tilted grain boundary. By noting the grain boundary structure using SEM images on both sides of the lamella before placement on the chip, it was possible to determine regions where grain boundaries are present. The grain boundaries are constrained by the coloured dashed lines at time 0 h and 24 h in and it was assumed that the boundaries extend linearly through the depth of the lamella. Both Mn and Cr enrichment occurs at grain boundaries, confirming results from previous, ex-situ studies (Mehta et al., Citation2022). Additionally, slower growth of numerous small precipitates inside grains occurs, as can be seen in the Mn elemental distribution at 14 h–24 h.
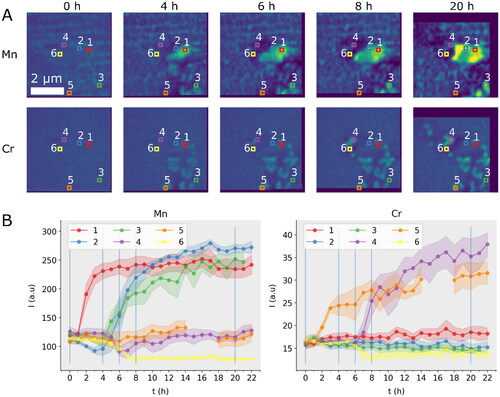
In the microstructural evolution at a grain boundary can be seen and in areas of interest (indicated by numbers 1–6) the Mn and Cr intensities have been obtained as shown in . Similar to the overview results, the initial distribution of elements is quite homogeneous. During heat treatment, Mn forms precipitates accompanied by depletion of Mn in the surrounding matrix. In , a noticeable depletion of Mn in the vicinity of a growing precipitate can be observed. This depletion becomes even more apparent when examining the relative Mn intensities in , particularly for locations 1, 2, and 3. Location 1 is where one precipitate forms and increases rapidly in Mn intensity after only 1 hour, before saturating after 6 h. In location 2, the Mn intensity initially decreases, due to the depletion of Mn, after which it increases when the precipitate grows reaching the same saturated levels as in location 1. In location 6, the matrix is continuously depleted of Mn up until 8 h, after which the concentration stays the same for the rest of the heat treatment time. Location 3 captures the growth of another Mn-rich precipitate, highlighting differences in the onset of growth. Interestingly, Fe is also seen incorporated into these Mn-rich precipitates as evidenced by in the Appendix, which is in contrast to Cr. Cr forms smaller precipitates surrounding the larger Mn precipitate. The earliest observable onset of Cr enrichment can be seen after 2 h of heat treatments. In contrast to locations 1 and 2, at locations 4 and 5, the growth of Cr-rich precipitates is evident by the steep increase in Cr intensity. The minor decrease in Cr intensity in location 6 is due to the depletion of Cr, close to a larger growing Cr-rich precipitate (location 4).
Figure 4. Evolution of Mn and Cr at grain boundary region. (A) Shows the elemental distribution at selected snapshots of heat treatment at 375 °C, for Mn (top row) and Cr (bottom row). (B) shows the Mn and Cr intensity respectively in 6 locations defined by colored squares in (A). Vertical blue lines mark the time snapshots seen in (A). Shaded areas indicate the uncertainty in quantified intensity. Location 5 has a broken line due to this location being outside the imaged region in some frames.
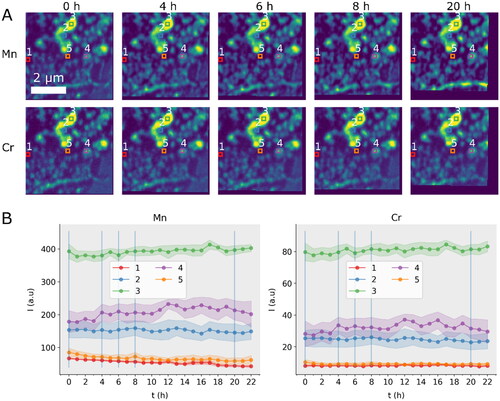
shows the analysis of the microstructural evolution at the melt pool boundary region. The as-printed precipitates present in this region are enriched in both Mn and Cr, with a ratio that remains stable over time. The intensity in some select locations is highlighted by the plots in illuminating the limited activity in this region. A slight matrix depletion may be present in regions in between precipitates at locations 1 and 5. This may be due to a supply of Mn to the growing grain boundary precipitate in the lower right corner of the imaged region. Compared to the trends seen for Cr in , any enrichment or depletion of Cr in is difficult to discern.
Figure 5. Evolution of Mn and Cr at melt pool boundary region. (A) Shows the elemental distribution at selected snapshots of heat treatment at 375 °C, for Mn (top row) and Cr (bottom row). The melt pool boundary precipitates contain both Mn and Cr and are present in the as-printed condition. (B) shows the Mn and Cr intensity respectively in 5 locations defined by colored squares in (A). Vertical grey lines mark the time snapshots seen in (A). Shaded areas indicate the uncertainty in quantified intensity.
Discussion
In this study, we see the formation of a Mn-rich phase at grain boundaries. Based on SEM-EDS and SEM-EBSD studies of heat-treated samples ex-situ (Mehta et al., Citation2022), it was identified as either the Al12Mn or Al6Mn phase in agreement with theoretical predictions in . This phase also seems to integrate Fe, a finding not directly observed before, likely because of Fe’s low concentrations. Theoretical models propose that even small additions of Fe may enhance the stability of the Al6Mn phase in the Al-Mn-Fe system, potentially serving as an indicator of this phase’s development (Mehta et al., Citation2022). This observation highlights the advantage of employing the high-sensitivity XRF technique.
Co-precipitation of a distinct unknown Cr-rich phase occurs adjacent to the Mn-rich precipitates, a phenomenon that has not been seen before. Further studies are being conducted to classify this new phase, where viable structure candidates are the types Al6Mn, Al13Cr2, Al12Mn or alpha-AlMnSi, based on theoretical predictions in .
The present study further shows that the microstructure is thermally stable over time in the melt pool boundary. The precipitates found here are present in the as-printed material, and they do not grow significantly during heat treatments. These precipitates are enriched in both Mn and Cr, and no large change in Mn or Cr distribution was visible in . Based on theoretical predictions in , they are likely Al13Cr2, or alpha-AlMnSi which are known to possibly contain Mn and Cr.
Further investigation involving CALPHAD-based database development and TEM diffraction characterization of all the above mentioned precipitates will be part of future studies. The information gathered in this study will prove valuable for understanding the kinetics of large precipitate formation in these alloys, especially as these precipitate types can severely affect the ductility of precipitation-hardened Al-alloys (ASM International, Citation1998).
The results show that in-situ scanning X-ray fluorescence (s-XRF) can be used as a valuable tool for observing precipitation behavior in this family of materials. Given its utility, a comparison with the similar technique of in-situ Scanning Transmission Electron Microscopy (STEM), is relevant. STEM offers sub-nanometer resolution achieved through the finely focused electron beam, analogous to the X-ray probe size in s-XRF. However, it’s also influenced by the constraints of sample thickness, typically around 100 nm, which approaches the regime of single electron scattering. Such thin samples are advantageous in studying intragranular precipitation where smaller precipitates are expected (Leonard et al., Citation2021; Vijayan et al., Citation2019). The s-XRF technique therefore notably complements the study of larger precipitates, which can grow up to micrometre size. This complementary approach is facilitated by the versatility of the in-situ MEMS chips. Originally designed for STEM applications, these chips are equally well suited for s-XRF, as evidenced in our study where we employed the DENS Solutions Climate chip.
Further, sample dimensions significantly affect diffusion speeds, with samples thinned for electron microscopy showing more pronounced elemental distribution changes, as demonstrated by Kostka et al. in Al-Ni diffusion couples (Kostka et al., Citation2022). This can be attributed to surface diffusion effects. In addition, FIB milling could alter precipitation behaviour, through an increase in dislocation density and solute atom clustering adjacent to the milled surface (Tweddle et al., Citation2022). In thicker lamellae, as the one manufactured for s-XRF in the present study, such surface effects are expected to be less prominent since the likelihood of potential distortions in precipitation kinetics due to these factors decreases with increased lamella thickness.
Energy dispersive spectroscopy (EDS) can readily be performed in the STEM as well for elemental mapping. However, a key distinction between s-XRF and STEM-EDS lies in their detection limits. s-XRF demonstrates superior sensitivity, exhibiting lower detection limits compared to conventional electron-beam-induced EDS (Troian et al., Citation2018). This enhanced capability is due to the absence of bremsstrahlung background radiation in photon excitation, an advantage that has been pivotal in our study for accurately detecting and analyzing elements like Fe and Cr, that are present at low concentrations.
The s-XRF technique’s main limitation is its low temporal resolution, with scans taking about 20 min each. To adapt, we chose temperatures that limited microstructural changes over several hours, matching the scan duration. Another issue is inferring 3D structures from 2D projections in micrometer-thick samples, which is complex due to the aggregate nature of the fluorescence signal. While 3D techniques like X-ray fluorescence computed tomography (XFCT) offer deeper insights, they require longer measurement times and rotational-compatible in-situ setups for comprehensive tomographic data. Future studies combining s-XRF with XFCT and in-situ STEM-EDS could offer a comprehensive approach to material characterisation.
Conclusion
Using in-situ scanning X-ray fluorescence, we observed the microstructural evolution in-situ during 24 h of heating by the Mn and Cr elemental distributions in a novel Al-Mn-Cr-Zr based alloy. At grain boundaries, co-precipitation of separate Cr-rich and Mn-rich phases occurs. At the melt-pool boundary, the microstructure remains stable over time, retaining precipitates enriched in both Mn and Cr. It can be concluded that Cr and Fe play an active role in the precipitation kinetics of this new alloy, a finding that will lead to the further development of CALPHAD databases for this new material family.
Using synchrotron scanning XRF, the ability to study relatively thick samples in-situ, yielding information closer to what is found in the bulk, combined with the <100nm resolution and the opportunity to distinguish and quantify several elements in the material can be emphasized. Still, the combination with other ex-situ and in-situ imaging techniques is needed as they in combination can give a detailed picture of structure and kinetics as well as allow the exclusion of experimental artifacts.
Acknowledgements
We acknowledge DESY (Hamburg, Germany), a member of the Helmholtz Association HGF, for the provision of experimental facilities. Beamtime was allocated for proposal I-20220364 EC. Support from the Production Area of Advance at Chalmers University is acknowledged. Parts of this research were carried out at the P06 PETRA III beamline, and we would like to thank Andreas Schropp, Dennis Brueckner, Mikhail Lyubomirskiy and Shweta Singh for their assistance
Disclosure statement
No potential conflict of interest was reported by the author(s).
Additional information
Funding
References
- Ansara, I., Dinsdale, A. T., & Rand, M. H. (1998). Thermochemical database for light metal alloys. European Communities.
- ASM International. (1998). Introduction to aluminum and aluminum alloys: Metals handbook desk edition (pp. 417–423). ASM International. https://doi.org/10.31399/asm.hb.v02.9781627081627
- DebRoy, T., Wei, H. L., Zuback, J. S., Mukherjee, T., Elmer, J. W., Milewski, J. O., Beese, A. M., Wilson-Heid, A. D., De, A., & Zhang, W. (2018). Additive manufacturing of metallic components – Process, structure and properties. Progress in Materials Science, 92, 112–224. https://doi.org/10.1016/j.pmatsci.2017.10.001
- Easterling, K. E., & Porter, D. A. (1992). Phase transformations in metals and alloys (2nd ed.). Chapman & Hill.
- Eswara, S., Mitterbauer, C., Wirtz, T., Kujawa, S., & Howe, J. M. (2016). An in situ correlative STEM-EDS and HRTEM based nanoscale chemical characterization of solid–liquid interfaces in an aluminium alloy. Journal of Microscopy, 264(1), 64–70. https://doi.org/10.1111/jmi.12417
- Fam, Y., Sheppard, T. L., Becher, J., Scherhaufer, D., Lambach, H., Kulkarni, S., Keller, T.F., Wittstock, A., Wittwer, F., Seyrich, M., & Brueckner, D. (2019). A versatile nanoreactor for complementary in situ X-ray and electron microscopy studies in catalysis and materials science. Journal of Synchrotron Radiation, 26(Pt 5), 1769–1781. https://doi.org/10.1107/S160057751900660X
- Gu, D. D., Meiners, W., Wissenbach, K., & Poprawe, R. (2012). Laser additive manufacturing of metallic components: Materials, processes and mechanisms. International Materials Reviews, 57(3), 133–164. https://doi.org/10.1179/1743280411Y.0000000014
- Izumi, O., Oelschlägel, D., & Nagata, A. (1968). On the decomposition of a highly supersaturated solution of Al-6wt % Mn. Transactions of the Japan Institute of Metals, 9(3), 227–228. https://doi.org/10.2320/matertrans1960.9.227
- Jones, H. (1978). Development in aluminium alloys by solidification at higher cooling rates. University of Sheffield.
- König, H. H., Pettersson, N. H., Durga, A., Van Petegem, S., Grolimund, D., Chuang, A. C., Guo Q., Chen L., Oikonomou C., Zhang F., & Lindwall, G. (2023). Solidification modes during additive manufacturing of steel revealed by high-speed X-ray diffraction. Acta Materialia, 246, 118713. https://doi.org/10.1016/j.actamat.2023.118713
- Kostka, A., Naujoks, D., Oellers, T., Salomon, S., Somsen, C. Öztürk, Savan, A., Ludwig, A., & Eggeler, G. (2022). Linear growth of reaction layer during in-situ TEM annealing of thin film Al/Ni diffusion couples. Journal of Alloys and Compounds., 922, 165926. https://doi.org/10.1016/j.jallcom.2022.165926
- Leicht, A. (2020). Laser powder bed fusion of 316L stainless steel microstructure and mechanical properties as a function of process [Doctoral diss.]. Chalmers Tekniska Hogskola.
- Leonard, H. R., Rommel, S., Li, M. X., Vijayan, S., Watson, T. J., Policandriotes, T., & Aindow, M. (2021). Precipitation phenomena in a powder-processed quasicrystal-reinforced Al-Cr-Mn-Co-Zr alloy. Materials Characterization., 178, 111239. https://doi.org/10.1016/j.matchar.2021.111239
- Li, Y. J., Muggerud, A. M. F., Olsen, A., & Furu, T. (2012). Precipitation of partially coherent α-Al(Mn,Fe)Si dispersoids and their strengthening effect in AA 3003 alloy. Acta Materialia., 60(3), 1004–1014. https://doi.org/10.1016/j.actamat.2011.11.003
- Liu, P., Dunlop, G. L., & Arnberg, L. (1988). Microstructural development in a rapidly solidified Al5Mn2.5Cr alloy. Materials Science and Engineering, 98, 437–441. https://doi.org/10.1016/0025-5416(88)90202-9
- Mehta, B., Frisk, K., & Nyborg, L. (2022). Effect of precipitation kinetics on microstructure and properties of novel Al-Mn-Cr-Zr based alloys developed for powder bed fusion – laser beam process. Journal of Alloys and Compounds, 920, 165870. https://doi.org/10.1016/j.jallcom.2022.165870
- Mehta, B., Frisk, K., & Nyborg, L. (2023). Advancing novel Al-Mn-Cr-Zr based family of alloys tailored for powder bed fusion-laser beam process. Journal of Alloys and Compounds, 967, 171685. https://doi.org/10.1016/j.jallcom.2023.171685
- Mehta, B., Nyborg, L., Frisk, K., & Hryha, E. (2022). Al–Mn–Cr–Zr-based alloys tailored for powder bed fusion-laser beam process: Alloy design, printability, resulting microstructure and alloy properties. Journal of Materials Research, 3, 1–13. https://doi.org/10.1557/s43578-022-00533-1
- Schropp, A., Döhrmann, R., Botta, S., Brückner, D., Kahnt, M., Lyubomirskiy, M., Ossig, C., Scholz, M., Seyrich, M., Stuckelberger, M. E., & Schroer, C. G. (2020). PtyNAMi: Ptychographic nano-analytical microscope. Journal of Applied Crystallography, 53(Pt 4), 957–971. https://doi.org/10.1107/S1600576720008420
- Shechtman, D., Schaefer, R. J., & Biancaniello, F. S. (1984). Precipitation in rapidly solidified Al-Mn alloys. Metallurgical Transactions A, 15(11), 1987–1997. https://doi.org/10.1007/BF02646833
- Solé, V. A., Papillon, E., Cotte, M., Walter, P., & Susini, J. (2007). A multiplatform code for the analysis of energy-dispersive X-ray fluorescence spectra. Spectrochimica Acta B, 62(1), 63–68. https://doi.org/10.1016/j.sab.2006.12.002
- Totten, G. E. (Ed.), (2016). Age-hardening of aluminium alloys. In Heat treating of nonferrous alloys. ASM International. https://doi.org/10.31399/asm.hb.v04e.a0006268
- Troian, A., Otnes, G., Zeng, X., Chayanun, L., Dagytė, V., Hammarberg, S., Salomon, D., Timm, R., Mikkelsen, A., Borgstrom, M. T., & Wallentin, J. (2018). Nanobeam X-ray fluorescence dopant mapping reveals dynamics of in situ Zn-doping in nanowires. Nano Letters, 18(10), 6461–6468. https://doi.org/10.1021/acs.nanolett.8b02957
- Tweddle, D., Johnson, J. A., Kapoor, M., Mileski, S., Carsley, J. E., & Thompson, G. B. (2022). Direct observation of PFIB-induced clustering in precipitation-strengthened Al alloys by atom probe tomography. Microscopy and Microanalysis, 28(2), 1–6. https://doi.org/10.1017/S1431927621013970
- Unocic, K. A., Mills, M. J., & Daehn, G. S. (2010). Effect of gallium focused ion beam milling on preparation of aluminium thin foils. Journal of Microscopy, 240(3), 227–238. https://doi.org/10.1111/j.1365-2818.2010.03401.x
- Vijayan, S., Bedard, B. A., Gleason, M. A., Leonard, H. R., Cote, D. L., & Aindow, M. (2019). Studies of thermally activated processes in gas-atomized Al alloy powders: in situ STEM heating experiments on FIB-cut cross sections. Journal of Materials Science, 54(13), 9921–9932. https://doi.org/10.1007/s10853-019-03562-0
- Wang, G., Ouyang, H., Fan, C., Guo, Q., Li, Z., Yan, W., & Li, Z. (2020). The origin of high-density dislocations in additively manufactured metals. Materials Research Letters, 8(8), 283–290. https://doi.org/10.1080/21663831.2020.1751739
- Xiao, Y., Maier-Kiener, V., Michler, J., Spolenak, R., & Wheeler, J. M. (2019). Deformation behavior of aluminum pillars produced by Xe and Ga focused ion beams: Insights from strain rate jump tests. Materials and Design., 181, 107914. https://doi.org/10.1016/j.matdes.2019.107914
- Zhong, X., Wade, C. A., Withers, P. J., Zhou, X., Cai, C., Haigh, S. J., & Burke, M. G. (2021). Comparing Xe + pFIB and Ga + FIB for TEM sample preparation of Al alloys: Minimising FIB-induced artefacts. Journal of Microscopy, 282(2), 101–112. https://doi.org/10.1111/jmi.12983
Appendix A.
Additional samples and elemental maps
shows the distribution of Mn, Cr and Fe in the control sample. A lamella was extracted from a bulk sample subject to a direct heat treatment at 375 °C for 8 h. The microstructure looks qualitatively similar to the in situ results at the same time snapshot, with grain boundary precipitates grown up to 2 µm wide, and a clear distinction can be seen between Mn-rich and Cr-rich precipitates.
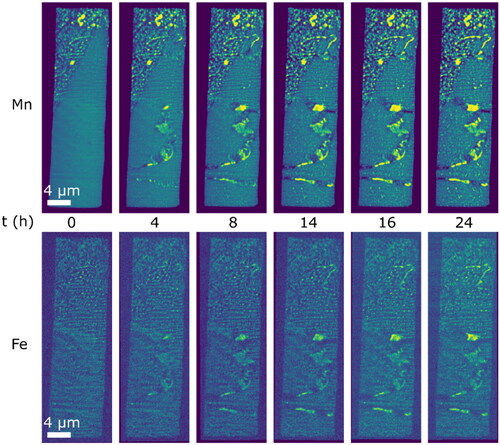
shows the distribution of Fe, along with Mn as a reference. It is evident that Fe dissolves into the larger Mn-rich precipitates at grain boundaries, but not in the Cr-rich phase. Fe is not consistently present in Mn-Cr-rich precipitates in the melt-pool boundary either.
Figure A1. Ex-situ annealed sample. The ex-situ sample was directly heat-treated in bulk at 375 °C for 8 h after which it was extracted and prepared by FIB-SEM.
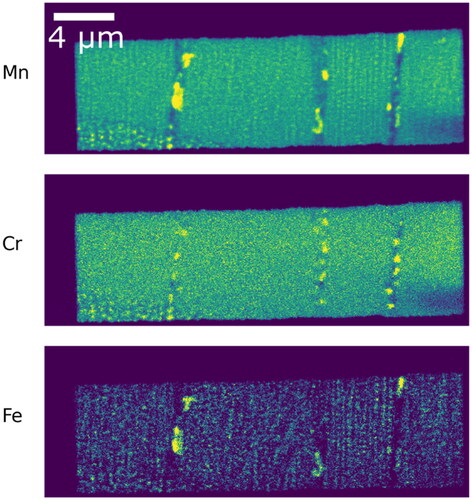
Figure A2. Elemental mapping of Mn and Fe showing Fe entering into the Mn-rich precipitates. Fe is not present in the Cr-rich precipitates nor the as-printed melt-pool boundary precipitates.