
Abstract
Students’ ability to be abreast with the basic concepts in statistics and its applications would help to stay relevant in the modern world due to the dynamic ways of doing things currently. The aims of the study were to assess the psychometric properties of the SATS in the Ghanaian context, to explore attitudes influencing factors and the relationship between psychometric properties of SATS and to examine gender-age effects in assessing statistical literacy among students. In this research the study was conducted to acquire a valid instrument to measure attitudes toward statistics in the Ghanaian context. The study surveyed 1000 undergraduate students from 10 universities. In this study, structural equation modeling through confirmatory factor analysis was used to validate the six-factor structure of the SATS scale and resulted in good model fit indices. A multi-group analysis was performed, which suggests gender and age have significant influence on some of the psychometric properties of the SATS components.
1 Introduction
Statistical literacy among people is a key skill expected of every individual in any data-driven society, and it has become necessary for both the young and old to appreciate numeracy and literacy (Gal Citation2004; Dani and Joan Citation2004). Statistical literacy enables individuals to formulate, apply and interpret basic concepts of statistics and mathematics in many ways, such as the ability to make statistical reasoning and use concepts, procedures, and facts to describe, explain or predict an event (Hidayati and Waluya Citation2020). Knowledge of statistics and its applications enhance people’s ability to solve simple and complex problems facing society. Statistical literacy can simply be understood as an individual capacity to recognize and appreciate the importance of statistics and mathematical concepts and the role they play in real-life situations for effective decisions making in our daily life activities (Hidayati and Waluya Citation2020).
The dynamics of our society and the complexity of ways of doing things require the general concept of statistical knowledge and a certain level of competencies to respond to the everyday problems confronting humans and society in general (Lipič and Ovsenik Citation2020). In a society where there is an adequate number of people with the appropriate statistical knowledge, effective production, economic and political decisions are always geared toward development (Mylnikov Citation2016). Statistical literacy is indeed crucial for promoting better business development, whether for large or small enterprises (Žmuk Citation2015). Individuals in the financial sector can make effective decisions with the relevant statistical concepts (Wainberg Citation2018).
Previous studies have shown that there is no consensus regarding the meaning of attitude (Ajzen and Fishbein Citation1988; Ryan and Giles Citation1982). Baker (Citation1992) believes that attitude is a posture in a picture. For Eiser (Citation1986), attitude toward something is a way of expressing one’s feelings or thoughts, likes or dislikes and so on about something. Other schools of thought have argued that student attitude to statistics usually refers to students’ feelings or behavior toward the concepts of statistics and their applications in relation to relevance, value, difficulty, and self-efficacy (Evans Citation2007; Nieswandt Citation2007). The attitude toward statistics is mostly seen as a complex phenomenon that indicates one’s ability to respond either favorably or unfavorably to the concepts of statistics, which might involve, objects, shapes, tables, situations and statistical figures and their interpretations (Gal et al. Citation1997; Roberts and Bilderback Citation1980; Schau Citation2003; Schau et al. Citation1995; Wise Citation1985).
Schau et al. (Citation1995) developed the Survey of Attitudes toward Statistics (SATS), an instrument for the measurement of statistical attitudes. In this current study six components of attitude toward statistics were used and are defined as follows: “Affect”—examines students’ positive and negative feelings about the concept and application of statistics; “Cognitive” competence measures students’ attitude about their intellectual knowledge and skills when applied to the concepts of statistics; “Value”—examines students attitude about the usefulness, relevance, and worth of statistics in personal and professional life; “Difficulty”—examines students’ attitude about the difficulty of statistics as a subject; “Interest”—measures how students shows positive attitude toward the subject whilst “Effort”- measures the striving behavior of students to understand the statistical concepts. These six- components have been assessed and evaluated by previous researchers using confirmatory factor analysis, which has provided a good model fit to the data collected from respondents (Schau et al. Citation1995).
Caterina et al. (Citation2017) indicated that in most countries’ students progressing toward their degree programs must pass at least one compulsory statistical course, which is used to assess their level of basic numeracy and their ability to appreciate basic concepts of statistics such as regression, ANOVA, test of hypothesis and so on. In teaching statistics and its applications, especially at the tertiary education level, gender, and age might have significant influence on understanding the concepts of statistics. Studies have shown that girls—although they receive similar grades to boys—are more likely to lack confidence in their mathematical abilities (Catsambis Citation1994; Tiedemann Citation2000; Else-Quest et al. Citation2013). Thus, female students may be less confident in their abilities to appreciate the concepts of statistics. They usually have a negative attitude toward any quantitative course of study, compared to the male students. Studies have shown that in the case of mathematical concepts women’s self-efficacies are in general consistently, and significantly lower than those of men (Stevens et al. Stevens2007 2007), irrespective of their actual level of ability (Else-Quest et al. Citation2010).
Literature has shown that student’s ability to appreciate and develop positive attitude toward statistics are based on the student’s prior knowledge in basic mathematics concepts (Brown and Brown Citation1995; Onwuegbuzie Citation2000; Schau Citation2003). Also, the nature and level of the statistics course taught (Watters and Ginns Citation2000) and students’ general knowledge in statistics and how they perceive it relevance in their day-to-day activities influences their attitudes (Mills Citation2004). A study by Mills (Citation2004) shown that males’ students were less likely than females to report fearing statistics and its applications and not feeling confident mastering statistical material (Mills Citation2004). According to a study by Tempelaar et al. (Citation2007) indicated that males’ students usually scored higher on positive Affect toward statistics, Cognitive competence related to statistics and Difficulty of the subject but normally scored lower than females on general Interest and relevance in the subject and the degree of effort they were planning to put into the study of statistics and its application. However, their study could not reveal any gender differences about the value of statistics for their individual and professional lives, but age was found to have significance influence on the SATS constructs (Onwuegbuzie et al. Citation1997; Onwuegbuzie Citation2000).
The SATS instrument is known to be a cross-cultural tool which had been assessed for reliability and validity in different part of the world, education, and context for measuring student attitudes toward statistics (Carmona et al. Citation2005; Chiesi and Primi Citation2009; Dauphinee et al. Citation1997; Khavenson et al. Citation2012). There has been no research instrument adapted to suit the Ghanaian context to measure students’ attitude toward statistics to the best of the researchers’ knowledge until now. The study has three main goals. First, to evaluate the Survey of Attitudes Toward Statistics, SATS (Schau et al. Citation1995) for Ghanaian undergraduate students to acquire understanding in terms of the validity of the measurement model underlying the SATS in the Ghanaian context. Second, to explore attitudes influencing factors and the relationship between psychometric properties of SATS and finally, to examine the association of gender and age on SATS constructs.
2 Materials and methods
2.1 Participants
The study initially contacted 1500 participants which were mostly students selected from 10 universities in Accra-Ghana. Greater Accra has 37 public and private universities running different academic programs. The study employed a stratified random sampling technique to select the respondents. This approach ensured representation across various academic disciplines and year levels. We categorized students based on their majors and academic years, then randomly sampled within these categories. This method enabled us to capture diverse perspectives and experiences within the student body. The selection of 10 universities was based on geographic diversity, proximity to the researchers and academic reputation. We aimed to encompass a mix of institutions from different regions and various tiers of academic excellence. By including universities with varying strengths and demographics, we aimed to enhance the generalizability of our findings.
In each university a total of one-hundred and fifty (150) questionnaires were distributed to various departments and respondents who agreed to form part of the study were given the questionnaires to fill for onwards submission. All participants (students) participated on a voluntary basis. This was done after obtaining university approval. We collaborated with faculty and class representatives of the various campuses to ensure dissemination of information across multiple academic disciplines. By utilizing official university communication channels, we sought to reach a wide range of students and collect comprehensive data for the study.
The decision for a second visit stemmed from the depth of data gathered during the first visit. A single visit seemed insufficient to capture the intricacies of student experiences. The second visit increased the response rate as we had time to interact with respondents and as a result one thousand participants fully completed and submitted the filled form to the researchers. The five hundred participants either replaced, destroyed, or could not complete the questionnaires and as a result, the study made used of the available sample size of one thousand (1000) participants who have enrolled in at least one undergraduate introductory course with basic statistics as part of their course of study at their respective university. The sample size was adequate for the study due to the wide spread of the universities in Accra and the willingness of the students to response to the questionnaire. In Ghana, all universities offer at least one course of study in statistics for those offering non statistics and mathematical courses.
The demographic profile of the one thousand participants were as follows: 60.2% (602) were males and 39.8% (398) females. The statistics on the raw ages of the respondents shown that on average a student age is approximately 22 ± 2 years whilst the minimum and maximum age of the students were 17 and 35, respectively and skewness and kurtosis value of 0.604 and 2.762, respectively. In this study the normality of the items was accessed using skewness and kurtosis and each value must have value between –2 and +2 to be considered acceptable to prove normal univariate distribution (George and Mallery Citation2010). According to Byrne (Citation2010; Hair et al. Citation2010) indicated data is normal if its skewness is between –2 to +2 and kurtosis falls between –7 to +7. As a result, the ages of the students were considered normally distributed since skewness and kurtosis values fall within the recommended range of –2.00 to 2.00 for skewness and kurtosis respectively (Trochim and Donnelly Citation2006; Field Citation2009; George and Mallery Citation2010; Gravetter and Wallnau Citation2012). The raw ages of the participants after computing the age group fall within two age groups: those below 23 years as they formed 66.2% (662) of the total participants while 33.8% (338) were above 23 years of age. Also, 16.6% (166) of the students were in the first year, 24.7% (247) were in the second year, 28.2% (283) were in the third year and 30.5(305) were in the final year of their respective programs of study. The participants were distributed across different academic disciplines, 25% (250 participants) studied business courses, 20% (200 participants each) studied humanities and arts, and natural sciences, 15% (150 participants) studied social sciences, 10% (100 participants) studied engineering and technology, 5% (50 participants each) studied health sciences and development studies. The result revealed that out of one thousand participants, 52.8% (528) of them had taken one statistics course, 28.3% (283) two courses whilst 18.9% (189) are those who have taken at least three courses, and this number includes those who read statistics as program.
2.2 Procedure
For this study, ten field assistants were employed, visited the selected universities for onward administration of the questionnaires to the participants. With the support of the class representatives (popularly known as class rep), the questionnaires were administered to those who were willing to form part of the study in their classrooms. The data collection commenced on 18th August, 2021 and ended two weeks after. All those who were interested in forming part of the study were engaged after the aim of the study was explained to them to the best of their knowledge and understanding and that the results would remain anonymous. On average 15–20 min were spent on each participant.
2.3 Instruments
The study used SATS instrument which consists of thirty-six items that can be grouped into six subscales. For other examples, see the citation of Chiesi and Primi (Citation2009) in the fourth paragraph of Section 4 and the citations of Hannigan et al. (Citation2014) in the fifth paragraph of Section 4. Affect (6 items), Cognitive Competence (6 items), Value (9), Difficulty (7 items), Interest (4 items), Effort (4 items). The SATS scale consists of 36 Likert scale using a 5-point scale ranging from 1 strongly disagree to 5 strongly agree. The SATS scale measures attitudes toward statistics. The total scale score is obtained by computing the means of the responses provided by the respondents. This approach allowed us to aggregate individual responses and derive an overall representation of the respondent’s standing on the scale.
It must be noted that the English version of the SATS was administered in this study. The Cronbach alpha was used to assess the internal consistency of the subscales as they all take values ranging from 0.762 to 0.942 as these suggest acceptability and significance (Schau Citation2003). The demographic characteristics such as age was coded; 1 [Less than 23 years and 2 [Above 23 years] based on the raw ages obtained from the respondents. The motive for the age group of 23 years was based on its apparent ability to capture a relevant age-based distinction within our dataset, aligning with our research goals. Gender was coded as 1 [Males]; 2 [Female].
The research instrument was initially pre-tested using 50 undergraduate students selected from two universities to assess the research instrument on the study area. Feedback highlighted clarity in questions, prompting minor wording adjustments in sections of the questionnaire. Initial Cronbach’s alpha(α) of 0.821 indicated good internal consistency was obtained. This pre-test assures instrument effectiveness for the main study.
2.4 Statistical data analysis
In this study statistical package for social sciences (SPSS version 26) was for the data management as well as various descriptive analyses. In this study Covariance-based structural equation modeling (SEM) was employed to conduct all model tests. This analysis was facilitated using Analysis of Moment Structures (AMOS version 23.0), employing maximum likelihood estimation. This approach aimed to establish and understand the relationships between the variables underconsideration.
According to Suki (Citation2011) SEM is a second-generation multivariate statistical technique an advanced form of the regression technique which can combine multiple regression with confirmatory factor analysis to estimate simultaneously a series of interrelated dependence relationships. The study focus is to examine the interrelationship between the SATS constructs and against gender and age effect in assessing student attitudes toward statistics. In this case six constructs such as: Value, Interest, Effort, Difficulty, Cognitive and Affects were interrelated which formed the SATS constructs against gender and age. The SEM is appropriate for this study because it allowed the researchers to model the complex relationships while considering measurement error of latent variables (Byrne Citation2011).
The technique is robust because other multivariate techniques inadvertently ignore measurement error by not modeling it explicitly whilst in the case of the SEM models it estimates the error variance parameters for both independent and dependent variables (Byrne Citation2010). The results of SEM include two main components namely: (1) Measurement model (2) Structural model. The measurement model (through confirmatory factor analysis) was conducted to establish the relationships between latent variables and observed variables which focus is to provide reliability and validity (convergent validity and discriminant validity) of the study constructs before testing for a significant relationship in the structuralmodel.
2.5 Descriptive statistics of study items
The result in displays the summary statistics such as the mean (M), standard deviation (SD), skewness and kurtosis were used to describe the study items. Six constructs were used for this study namely, Affect (6 items), Cognitive Competence (6 items), Value (9 items), Difficulty (7 items), Interest (4 items) and Effort (4 items). Out of the total 36 items across the six constructs, only 25 items were considered for the study. The remaining 11 items were excluded due to insufficient or inadequate responses from the participants. From , the mean and standard deviation value for all items range from M = 2.70 to 3.62 and SD = 0.88 to 1.25, respectively. To assess the normality of the provided responses, a skewness and kurtosis analysis, as recommended by Gravetter and Wallnau (Citation2012), was conducted. According to their guidelines, an item is deemed to be normally distributed when its skewness and kurtosis values fall within the range of 2.00 to –2.00. The results of the analysis indicated that both skewness and kurtosis values were within the acceptable range of –2 to +2, as suggested by George and Mallery (Citation2010), signifying normal univariate distribution. Additionally, Hair et al. (Citation2010) and Byrne (Citation2010) assert that data is considered normal if skewness falls between –2 to +2 and kurtosis falls between –7 to +7, further supporting the conclusion of normal distribution.
Table 1: Descriptive statistics of construct/items.
Table 2: Standardized regression loading and multiple r squared.
The result obtained indicates that skewness and kurtosis values for all study items were within the acceptable recommended values ranged from (Skewness =–0.75 to 0.19; Kurtosis = 1.16 to 0.28), implying normality distribution of all the responses provided for the items at the univariate normality level as shown in . The z-score was used to standardize the data, enabling comparisons across different scales whilst the p-value-values served as a measure used in hypothesis testing to determine the significance of results.
In this study, there was no missing data point. Also, outliers’ data points that deviate from the norm require careful treatment. Detecting and addressing outliers is crucial for accurate analysis. This study employed standardized values (z-score) to identify univariate outliers and Mahalanobis Distance (D2) for multivariate outliers.
In identifying univariate outliers in this study, cutoff values based on the recommendations of Kline (Citation2015) was applied. Specifically, univariate outliers were defined as values that fell more than 3.29 standard deviations from the mean (Kline Citation2015). This threshold represents the .001 significance level in a normal distribution. Also, in the case of the multivariate outliers, Mahalanobis distances and the critical value approach outlined by Tabachnick and Fidell (Citation2019) was applied. Mahalanobis values were computed and compared against the chi-square critical value using the number of independent variables as the degrees of freedom. Cases that exceeded the critical value cutoff of 18.47 constituted multivariate outliers (Tabachnick and Fidell Citation2019). No outliers exceeding the determined thresholds were found in the dataset, ensuring data integrity (Tabachnick and Fidell Citation2007; Schafer and Graham Citation2002; Montgomery et al. Citation2021).
3 Result
3.1 Confirmatory factor analysis
3.1.1 Measurement model
The data was examined for normality, outliers, and missing values after which further analysis was performed for structural and internal consistency (reliability diagnostics test) of the responses provided by the participants. Confirmatory factor analysis (CFA) was conducted using Analysis of Moment of Structures (AMOS version 26.0) with the help of the maximum likelihood estimator to confirm the dimensions of the items-constructs used for the study (Arbuckle Citation2015). The CFA is performed to measure how satisfactory the model is in terms of validity and reliability before examining the structural model- relationship between the constructs (Ifinedo Citation2006).
3.2 Constructs reliability and validity
The properties of the measurement model include the following: reliability, convergent validity and discriminant validity as indicated in for with and without demographic profile (gender and age) respectively. The internal consistency was measured using composite reliability (CR). The CR is a new fashion to measure scale reliability overall and mostly preferred when conducting confirmatory factor analysis due to it robustness (Hair et al. Citation2010) as against Cronbach alpha which examines the average measure of internal consistency and item reliability and is mostly preferred when conducting an exploratory factor analysis for factor extraction purposes. In this study the CR offers more robust results compared to the Cronbach alpha reliability (Hair et al. Citation2010). The reliability values ranged from zero (0.00) to one (1.00) and CR value of at least 0.70 is considered acceptable as a good reliability level (Hair et al. Citation2010; Pakpour et al. Citation2014). Shown in the and , respectively displays the estimated composite reliability (CR) values for the two model (with and without demographic profile) for all constructs to indicate that there is high level of internal consistency of the responses provided by the respondents since all estimated CR values were above the acceptable value of 0.70 by previous studies. For instance, the model without gender and age has the following CR values for its constructs: 0.892 for Value, 0.884 for Cognitive, 0.913 for Interest, 0.909 for Difficulty, 0.858 for Affect and 0.916 for Effort whilst the model with gender and age has the following CR values: 0.956 for Value, 0.921 for Cognitive, 0.917 for Interest, 0.927 for Difficulty, 0.892 for Affects and 0.835 for Effort. All these values suggest a high level of internal consistency (Henseler et al. Citation2015). It could be observed that the CR values for the model with gender and age were quite higher than the model without gender and age.
Table 3: Model validity with and without demographic profile (gender and age).
Convergent validity, which measures the amount of variance explained by each item in the model (Hair et al. Citation2010), was measured using the standardized loading of each item in the model. According to Hair et al. (Citation2010) standardized loading of at least 0.50 is considered acceptable for convergent validity. At the initial stage of the model fitting, all 36 items were involved, however, after accessing the individual items loading and performance based on literature, some of the items were dropped (19 items) for further analysis. The result obtained suggests that the remaining 17 items have loadings above the acceptable of 0.50 as shown in , hence convergent validity is achieved. Also, the independence of the constructs was measured using discriminant validity. This was done by comparing the Average Variance Extracted (AVE) with correlation squared (Fornell and Larcker Citation1981). To achieve this required measure, the AVE of two constructs must be, at least more than the square of the correlation between any given two constructs in the model ( and ). Also, the r-squared values were used to determine the proportion of variance explained by each item in the model. As evidenced in the model the r-squared for the items ranged from 0.36 to 0.92. Hence, there is high variability observed in the model for each item.
Table 5: Correlation among SATS constructs with age and gender.
Table 6: Correlation among SATS constructs without age and gender.
The result in displays the AVE and the square root of the AVE of the two models with and out demographic profile (age and gender) whilst the correlation that exists between the constructs is shown in and , respectively. Comparing the correlation result with the square root of the AVEs, it could be observed that no correlation is either equal or greater than the square root of the AVE indicating the presence of discriminant validity. From the results, each AVE as indicated in the table is more than correlation square, which implies that discriminant validity is achieved that constructs are indeed distinct (Byrne Citation2010). The results as show suggest that the model validity measures with demographic profile were quite higher than the model without the demographic profile.
Further analysis shown as displayed in suggests that most of the selected participants agreed to the items used in the study, toward statistics and its applications based on the estimated mean value obtained. The overall mean and standard deviation for all the items ranged from 3.22 ± 0.90 which is above neutral result suggesting agreement. The constructs statistics in-terms of the estimated mean and deviation is given as follows: Value (2.98 ± 0.92); Cognitive (3.10 ± 0.93); Interest (3.03 ± 0.90); Difficulty (3.54 ± 0.94); Affect (3.21 ± 0.90) and Effort (3.47 ± 0.83). The construct with the highest mean was Difficulty that indicates that some portions of students have difficulty understanding the concepts of statistics. This implies that students agreed that the concept of statistics is quite difficult or a complicated subject which requires a great deal of discipline to appreciate its practicality. Although the construct has the least estimated mean value, it estimates do not undermine the result, which suggests that students have positive attitudes and perceptions toward statistics and its application.
3.2.1 Structural model
The structural model of the study was performed using a series of tests in accessing the model adequacy of the proposed model. shows the summary results of model fit indices for the two models, with and without demographic profile. As evidence in the result all fit indices met the recommended value as proposed by previous studies (Hair et al. Citation2010; Gaskin and Lim Citation2016) such as: Chi-square (χ2 df = 2.373), CFI = 0.976, GFI = 0.908, SRMR = 0.040, NFI = 0.967, RMSEA = 0.048 and AIC = 571.391 for model 1 (without gender and age) whilst indices for model 2 (with gender and age) has fit indices such as: (χ2 df = 2.813), CFI = 0.983, GFI = 0.921, SRMR = 0.035, NFI = 0.975, RMSEA = 0.043, and AIC = 478.607.
Table 4: Summary of model fit indices.
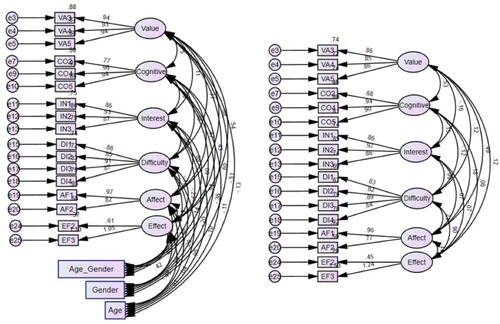
All model fit indices estimated by the maximum likelihood technique were above the recommended values (See ) for details. The values obtained suggest a high level of model adequacy (Henseler et al. Citation2015), hence suggesting that the examination of the path coefficient could be examined (Kline Citation2013; Brown Citation2015). Although the two model’s adequacy indices were satisfactory, the model with gender and age performed quite well compared with the model without gender and age based on the fit indices. Hence the proposed relationship between the constructs could be examined. The structural model, the study examined the correlation among the variables, regression analysis and multigroup analysis among the study variables whilst displays the diagrammatic representation of the correlation among the constructs, with and without gender and age.
Figure 1: Adopted six-factor model of the SATS 36 items with and without demographic profile.
3.3 Model with gender and age effect
displays the correlation between SATS constructs and demographic profile (gender and age) of participants. As evidenced in the results, there is a statistically significant association between all the SATS constructs at 5% significance level. For example, the association between Value and Cognitive was significant (p = 0.531, p < 0.001); Value and Interest shown significant association but in inversely relationship (p = –0.157, p < 0.001) as shown in the among other association between constructs. The association between the SATS constructs and demographic profile suggest that gender only correlates significantly with three SATS constructs: Difficulty (p =–0.094, p < 0.01); Cognitive (p = 0.215; p < 0.001); Value (p = 0.136, p < 0.001). The result suggests that gender has a positive association with Value and Cognitive but have inversely association with Difficulty. The implication of gender effect is that males are more likely related to Cognitive and Value which suggest that males’ students’ have high level of knowledge & skills about statistics and its applications. Also, the result suggests that males’ students value statistics and see it to be usefulness, relevance in personal and professional life. Also, age only correlates significantly with two constructs: Effect (p = 0.147, p < 0.01); Affect (p = 0.089, p < 0.007) showing statistically and positive association among the constructs.
The result shown inverse and significant interaction between Age and Gender on “Difficulty”(p =–0.111; p < 0.001); the interaction of Age and Gender on “Interest” was negative and significant (p = –0.071, p < 0.05); the interaction of Age and Gender has positive association with Cognitive (p = 0.215, p < 0.001); the interaction of Age and Gender has positive association with Value (p = 0.156, p < 0.001).
3.4 Model without gender and age effect
The result as shown in displays the correlation among the study constructs without the demographic profile (gender and age). As shown Value has positive and significant association with Cognitive (p = 0.531, p < 0.001); Difficulty (p = 0.116, p < 0.01); Affect (p = 0.487, p < 0.01) and inversely relationship with Interest (p =–0.157, p < 0.001). The analysis shows that Cognitive has positive and significant association with Affect (p = 0.138, p < 0.000) whilst it has inversely relationship with Interest (p =–0.149, p = 0.001); Difficulty (p =–0.118, p < 0.001). Interest also correlates negatively but significantly with difficulty (p = –0.087, p < 0.001); Affect (p =–0.071, p < 0.001). Difficulty has positive and significant association with Affect (p = 0.125, p < 0.001) whilst Effect has no significant association with the rest of the constructs.
The result as shown in highlights the relationship (standardized regression) that exists between demographic profile (age and gender) and SATS constructs. To evaluate the relationship that exist between the SATS constructs and demographic characteristics of respondents, confirmatory factor analysis was conducted using the SATS constructs as dependent variables whilst the demographic characteristics (age and gender) served as the independent variables. The regression results as indicated in shows that demographic profile has significant association with two constructs (Value and Cognitive). As shown Gender has an inverse relationship with Value (β = –0.504, p < 0.05); age only has an inverse relationship with Value (β = –0.134, p < 0.050). The result suggests that the interaction effect of age *gender has positive and significant relationship with Value (β = 0.601, p < 0.05) whilst the interaction effect of age *gender has positive and significant relationship with Cognitive (β = 0.531, p < 0.05) at 5% significance level.
Table 7: Predictive relationship (standardised regression weights) of age and gender with SATS.
3.5 Model comparison of SATS constructs against age and gender
The result in displays the multigroup analysis, comparing the SATS constructs with age and gender. As evidence, it could be observed that there is significance difference between males and females in the relationship between “Value” and “Cognitive” (Male, t = 9.717; Female, = 6.608). Hence males’ participants shown positive association between value and cognitive than females. In the case of the association between cognitive and interest there was significance association between the two variables (Male, t = –4.019; Female, t = –1.198), the males participants show association highly with Cognitive and Interest than females. The male participants associated well with the association between cognitive and difficulty in terms of gender (Male, t = –4.122, Female, t = 0.827). This implies that males tend to connect more easily the relationship between cognitive functions and challenging tasks compared to females. In the case of cognitive and affect, females shown more significant association than that of male’s participants (Male, t = 1.925, Female, t = 5.877). There is significant association between effect and cognitive in terms of gender (Male, t = 0.186; Female, t = 2.419). The result as shown suggest that female associate significantly between effect and cognitive than males’ participants. Female participants associate significantly between interest and difficulty (Male, t =–0.311; Female, t =–3.527).
Table 8: Multigroup analysis among the SATS constructs.
The difference between the gender levels proved significant in favor of females. The association between value and difficulty proved statistically significant in favor of females than male participants (Male, t = 0.696; Female, t = 4.724) whilst the rest shown no significant association between the SATS constructs among gender. In the case of the age group level, the result suggests that participants who were less than 23 years of age associate significant between the value and cognitive (< 23 years, t = 9.838; >23 years, t = 6.608). The association between value and affect shows a significant relationship in favor of those less than 23 years of age than above 23 years of age. Also, those less than 23 years shown more significant association between cognitive and interest (< 23 years, t=–3.736; >23 years, t=–1.198), hence significant association achieved. Finally, the result suggests that those less than 23 years shown more significant association between cognitive and difficulty than those above 23 years of age as shown in the result (< 23 years =–3.677; >23 years, t = 0.827) whilst the rest of the association shown no significant relationship among the age groups.
4 Discussions
In this study, the measured reliability values using composite reliability (as defined by Hair et al. Citation2010; Pakpour et al. Citation2014) were all above 0.70. This surpasses the threshold set by previous research, indicating a strong internal consistency in the responses. This consistency aligns with findings from earlier studies (Cashin and Elmore Citation2005; Finney and Schraw Citation2003; Schau et al. Citation1995). Furthermore, the model also displayed a high level of convergent validity, as all items had loadings above 0.50, as recommended by previous research (Byrne Citation2010; Hair et al. Citation2010). This suggests that the results are in agreement with prior studies. The study’s discriminant validity, which examines the independence of the measured constructs, was assessed by comparing the average variance extracted (AVE) with the squared correlations (Fornell and Larcker Citation1981). The results indicated that all AVE values were higher than the squared correlations, as detailed in the previous section. This suggests the absence of multicollinearity in the model (Byrne Citation2010), thereby supporting the appropriateness of examining the relationships between the constructs. The purpose of this study is to investigate how gender and age impact undergraduate students’ attitudes toward statistics (SATS) in the context of Ghana. The study uses six factors to assess SATS: Value, Interest, Effort, Difficulty, Cognitive, and Affects.
The measurement scale used to examine students’ attitudes toward statistics and its applications has been validated as reliable. All the indicators of model fit obtained from the analysis meet the acceptable criteria established by prior research. In the first model, which includes age and gender as variables, all the SATS constructs are found to be statistically significant in terms of their correlations. In the second model, which excludes age and gender, most of the constructs exhibit significant correlations, except for the relationship between Effort and Difficulty, Affect, Interest, Cognitive, and Value. Additionally, the correlation between Affects and Interest, as well as with Difficulty, is noteworthy.
The ensuing discussion focuses on the results of the first model, including age and gender, aligning with the research’s primary objective. The findings in indicate a strong correlation between the construct of Value and four others: Cognitive (ρ = 0.531), Interest (ρ = 0.157), Difficulty (ρ = 0.116), and Affect (ρ = 0.490). This suggests that students’ perception of possessing adequate knowledge or skills in a subject significantly impacts the value they attach to what they are learning. Repedro Jr and Diego (2021) highlighted that students’ perception of the importance of succeeding in statistics is positively related to their sense of value. Therefore, this measurement of value assesses students’ perception of the practicality of statistics in both their personal and professional lives.
Emmioğlu (Citation2011) further noted that students with higher cognitive competence tend to exhibit a more positive attitude toward statistics and a higher level of statistical literacy.
It is also recognized that while statistics might be considered an interesting course, its significance to students can diminish if it doesn’t align with their self-perception or career aspirations (Goodenow Citation1993; Lewis et al. Citation2016; Murphy et al. Citation2020). This is particularly notable for students pursuing fields unrelated to statistics or mathematics, like fashion design, as they might not value statistics due to its perceived lack of relevance to their chosen career path (Songsore and White Citation2018). Furthermore, a positive and meaningful connection is found between the construct of Effort and four others: Value (ρ = 0.138), Cognitive (ρ = 0.067), Difficulty (ρ = 0.075), and Affect (ρ = 0.129).
This signifies that students’ exertion of effort in learning statistics can influence their grasp of the subject matter, thereby affecting their statistical literacy and overall attitude. This aligns with Bond et al. (Citation2012), who suggested that students’ positive attitude toward learning statistics drives them to invest more time in acquiring skills in the subject. The outcomes displayed in exhibit noteworthy correlations between the Cognitive construct and three others, both in positive and negative directions: Affect (ρ = 0.184), Interest (ρ = –0.149), and Difficulty (ρ =–0.118). This suggests that gaining knowledge in statistics significantly influences students’ emotions and concerns regarding the subject. This connection could also be interpreted as students who are more confident about statistics tend to place higher value on it, irrespective of its difficulty level. The results imply that students with a positive attitude toward cognitive competence in statistics are likely to perform better as their interest in the subject grows. Comparing these correlation results with earlier studies (Chiesi and Primi Citation2009; Schau et al. Citation1995) reveals both similarities and differences. There is an inverse association between Cognitive and Interest, as well as Difficulty, which aligns with findings by Stanisavljevic et al. (Citation2014). However, this differs from the observations of Vanhoof et al. (Citation2011), where their correlated values were higher than those in this study.
Moving on to the predictive relationship with demographic characteristics, both gender and age show significant associations with certain SATS constructs. Specifically, gender exhibits an inverse relationship only with Value (β=–0.504). This is consistent with some prior research, like Chiesi and Primi (Citation2009), though the direction of their findings might differ. Age, on the other hand, demonstrates a statistically significant inverse relationship with Value (β=–0.134). This result contrasts with Chiesi and Primi (Citation2009) findings that age has no impact on any SATS constructs. Similarly, the interaction effect of gender and age displays a positive and significant relationship with both Value (β = 0.601) and Cognitive (β = 0.531). The role of gender and age in shaping attitudes toward statistics is complex and requires further investigation.
Research has pointed to the significant influence of gender on student attitudes toward statistics (Hilton et al. Citation2004; Cashin and Elmore Citation2005; Chiesi and Primi Citation2015). This study examined gender separately, revealing that females tend to have more significant associations among the SATS constructs than males, despite other studies indicating lower scores for females (Hannigan et al. Citation2014). Similarly, in terms of age, students below 23 years old tend to have stronger associations with SATS constructs, suggesting that younger students appreciate statistical concepts more than older peers. This diverges from Hannigan et al. (Citation2014), where older students showed weaker associations.
Despite the perception of statistics as a challenging subject, this study’s results reflect positively on students’ attitudes toward it. The constructs received high ratings compared to other studies (Zhang et al. Citation2012; Hannigan et al. Citation2014; Chiesi and Primi Citation2015). Enhancing the teaching of statistics through multidisciplinary approaches, statistical software usage, and recruitment of qualified educators is crucial to fostering positive attitudes and better preparing students for data-centric careers (Freeman et al. Citation2008).
5 Conclusions
The study used structural equation modeling, especially the confirmatory factor analysis to establish the relationship between the constructs. The study proposed three main objectives as follows; First, to assess the Survey of Attitudes Toward Statistics, SATS (Schau et al. Citation1995) for Ghanaian undergraduate students to acquire a validity of the measurement model underlying the SATS. Second, to explore attitudes influencing factors and the relationship between psychometric properties of SATS and lastly to examine the influence of gender and age on the SATS components. The result obtained suggest that the psychometric properties of the SATS have been applied to Ghanaian undergraduate students to examine their attitudes toward statistics. Also, the relationship that exists between the psychometric properties of SATS has been established. The result suggests that there was a significant relationship between all the constructs except few of the constructs.
This means that an overall satisfactory result was obtained, and this implied that when students have low or no interest in a course like statistics, it has significant impact on how they feel toward such course. A high interest in the course would motivate them to develop high level of concern for such course. The result suggest that students have difficulty understanding the concepts of statistics and as result the course is seen as a complicated subject and as a result making it difficult for students to have better under-understanding on its application for real life situation. Likewise, the researchers have observed that students were slightly unaware of the importance of statistics, and this affects their concerns toward the learning of the subject.
The result further shows that Gender and Age showed significant influence with the SATS constructs as indicated in . Studies have shown that gender and age has an influence on students’ attitude toward statistics (Opstad Citation2020). It must be noted that because statistics is one of the great courses in this era of data and science, it is very important to explore the factors that influence students’ attitude toward statistics and to further explore the gender and age difference.
Although, the study did not focus on the teaching methodology to improve learning of statistics, it recommends that innovative approach be used to teach the course statistics and through this student would develop positive attitude the to learn statistics in these recent times where data, science and technology is the order of the day for effective decision making. The usage of statistical software that allows students to visualize and interact with data would improve students’ understanding of random phenomena (Weissglass and Curnmings Citation1991) and their learning of data analysis (Rubin et al. Citation1988) may reduce the fear and the negative attitude and perception students have toward statistics especially the act of proofing long theories and huge mathematical formulae usage. Students must be facilitated using practical examples that are related to them to reduce their anxiety level and the negative perception toward statistics and its applications which encourages better formulation of polices and effective decision making. The findings in this study can help to make all educational stakeholders aware of the need to put measures in place to promote the wellbeing of students by way of encouraging them to appreciate the need of statistical education by way of adopting technology in teaching and learning for economic development.
Acknowledgments
We thank the management of the ten (10) universities and field workers who helped us in the gathering of the data for the study.
References
- Ajzen I, Fishbein M. 1988. Theory of reasoned action-Theory of planned behavior. University of South Florida, 2007, 67–98.
- Arbuckle JL. 2015. IBM SPSS Amos user’s guide [Computer software and manual].
- Baker C. 1992. Attitudes and language. Vol. 83. Clevedon: Multilingual Matters.
- Bond ME, Perkins SN, Ramirez C. 2012. Students’ perceptions of statistics: an exploration of attitudes, conceptualizations, and content knowledge of statistics. Stat Educ Res J. 11:6–25.
- Brown TA. 2015. Confirmatory factor analysis for applied research. New York: Guilford publications.
- Brown TS, Brown JT. 1995. Prerequisite course grades and attitude toward statistics. Coll Stud J. 29:502–507.
- Byrne BM. 2010. Structural equation modeling with AMOS: basic concepts, applications, and programming (multivariate applications series). Vol. 396. New York: Taylor & Francis Group. p. 7384.
- Byrne B. 2011. Structural equation modeling with Mplus: basic concepts, applications, and programming (multivariate applications). London: Taylor & Francis.
- Carmona J, Martínez RJ, Sánchez M. 2005. Mathematical background and attitudes toward statistics in a sample of Spanish college students. Psychol Rep. 97:53–62.
- Cashin SE, Elmore PB. 2005. The Survey of Attitudes Toward Statistics Scale: a construct validity study. Educ Psychol Meas. 65:509–524.
- Caterina P, Maria DA, Francesca C. 2017. Are there gender differences in cognitive reflection? Invariance and differences related to mathematics. Think Reason. 24:258–279.
- Catsambis S. 1994. The path to math: Gender and racial-ethnic differences in mathematics participation from middle school to high school. Sociol Educ. 67:199–215.
- Chiesi F, Primi C. 2015. Gender differences in attitudes toward statistics: Is there a case for a confidence gap?
- Chiesi F, Primi C. 2009. Assessing statistics attitudes among college students: pychometric properties of the Italian version of the Survey of Attitudes toward Statistics (SATS). Learn Individ Differ. 19:309–313.
- Dani BZ, Joan G. 2004. Statistical literacy, reasoning, and thinking: goals, definitions, and challenges. In: Ben-Zvi D, Garfield J, editors. The challenge of developing statistical literacy, reasoning and thinking. Dordrecht: Springer. p. 3–15.
- Dauphinee TL, Schau C, Stevens JJ. 1997. Survey of attitudes toward statistics: factor structure and factorial invariance for females and males. Struct Equ Model. 4:129–141.
- Eiser JR. 1986. Social psychology: Attitudes, cognition and social behaviour. Cambridge: Cambridge University Press.
- Else-Quest NM, Hyde JS, Linn MC. 2010. Cross-national patterns of gender differences in mathematics: a meta-analysis. Psychol Bull. 136:103–127.
- Else-Quest NM, Mineo CC, Higgins A. 2013. Math and science attitudes and achievement at the intersection of gender and ethnicity. Psychol Women Q. 37:293–309.
- Emmioğlu E. 2011. A structural equation model examining the relationships among mathematics achievement, attitudes toward statistics, and statistics outcomes. Eurasia J Math Sci Technol Educ. 10:23–31.
- Evans BR. 2007. Student attitudes, conceptions, and achievement in introductory undergraduate college statistics [Doctoral dissertation]. Temple University.
- Field A. 2009. Discovering statistics using SPSS. London: Sage publications Ltd.
- Finney S, Schraw G. 2003. Self-efficacy beliefs in college statistics courses. Contemp Educ Psychol. 28:161–186.
- Fornell C, Larcker DF. 1981. Evaluating structural equation models with unobservable variables and measurement error. J Market Res. 18:39–50.
- Freeman JV, Collier S, Staniforth D, Smith KJ. 2008. Innovations in curriculum design: a multi-disciplinary approach to teaching statistics to undergraduate medical students. BMC Med Educ. 8:1–8.
- Gal I, Ginsburg L, Schau C. 1997. Monitoring attitudes and beliefs in statistics education. Assess Chall Stat Educ. 12:37–51.
- Gal I. 2004. Statistical literacy: meanings, components, responsibilities. In Ben-Zvi D, Garfield J, editors. The challenge of developing statistical literacy, reasoning and thinking. Dordrecht, Netherlands: Kluwer Academic Publishers. p. 47–78.
- Gaskin J, Lim J. 2016. Model Fit Measures. AMOS Plugin. Gaskination’s StatWiki.
- George D, Mallery P. 2010. SPSS for Windows step by step: a simple guide and reference 17.0 update. 10th ed. Boston: Pearson.
- Goodenow C. 1993. The psychological sense of school membership among adolescents: Scale development and educational correlates. Psychol Schs. 30:79–90.
- Gravetter FJ, Wallnau LB. 2012. Forzano LAB. Research methods for the behavioral sciences. 4th ed. Belmont, CA: Wadsworth. p. 78.
- Hair JF, Black B, Babin B, Anderson RE, Tatham RL. 2010. Multivariate data analysis: a global perspective. Hoboken, NJ: Pearson Education Inc.
- Hannigan A, Hegarty AC, McGrath D. 2014. Attitudes towards statistics of graduate entry medical students: the role of prior learning experiences. BMC Med Educ. 14:70.
- Henseler J, Ringle CM, Sarstedt M. 2015. A new criterion for assessing discriminant validity in variance-based structural equation modeling. J Acad Mark Sci. 43:115–135.
- Hidayati NA, Waluya SB. 2020. Statistics literacy: what, why and how? J Phys Conf Ser. 1613:012080.
- Hilton SC, Schau C, Olsen JA. 2004. Survey of attitudes toward statistics: factor structure invariance by gender and by administration time. Struct Equ Model. 11:92–109.
- Ifinedo P. 2006. Acceptance and continuance intention of web-based learning technologies (WLT) use among university students in a Baltic country. E J Info Sys Dev Count. 23:1–20.
- Khavenson T, Orel E, Tryakshina M. 2012. Adaptation of survey of attitudes towards statistics (SATS 36) for Russian sample. Procedia-Social Behav Sci. 46:2126–2129.
- Kline RB. 2013. Beyond significance testing: statistics reform in the behavioral sciences. Washington (DC): American Psychological Association.
- Kline RB. 2015. Principles and practice of structural equation modeling. New York: Guilford Publications.
- Lewis CM, Anderson RE, Yasuhara K. 2016. “I Don’t Code All Day” fitting in computer science when the stereotypes don’t fit. In: Proceedings of the 2016 ACM Conference on International Computing Education Research. p. 23–32.
- Lipič N, Ovsenik M. 2020. The effect of statistical literacy on response to environmental change. Organizacija. 53:147–163.
- Mills JD. 2004. Students’ attitudes toward statistics: Implications for the future. Coll Stud J. 38:349–362.
- Montgomery DC, Peck EA, Vining GG. 2021. Introduction to linear regression analysis. Newark: Wiley.
- Murphy K, Williamson H, Sargeant E, McCarthy M. 2020. Why people comply with COVID-19 social distancing restrictions: Self-interest or duty? Aust NZ J Criminol. 53:477–496.
- Mylnikov L. 2016. Particularities of solving the problems of support for managerial decision making in production and economic systems using the statistical data. Int J Econ Financial Issues. 6:321–331. https://www.econjournals.com/index.php/ijefi/article/view/3759/pdf.
- Nieswandt M. 2007. Student affect and conceptual understanding in learning chemistry. J Res Sci Teach. 44:908–937.
- Onwuegbuzie AJ, Da Ros D, Ryan JM. 1997. The components of statistics anxiety: a phenomenological study. Focus Learning Probl Math. 19:11–35.
- Onwuegbuzie AJ. 2000. Academic procrastinators and perfectionistic tendencies among graduate students. J Soc Behav Personal. 15:103.
- Opstad L. 2020. Attitudes towards statistics among business students: do gender, mathematical skills and personal traits matter? Sustainability. 12:6104.
- Pakpour AH, Zeidi IM, Yekaninejad MS, Burri A. 2014. Validation of a translated and culturally adapted Iranian version of the International Index of Erectile Function. J Sex Marital Ther. 40:541–551.
- Repedro Jr RE, Diego CV. 2021. Attitudes toward statistics and statistical literacy of public senior high school students. Philipp Soc Sci J. 4:48–56.
- Roberts DM, Bilderback EW. 1980. Reliability and validity of a statistics attitude survey. Educ Psychol Meas. 40:235–238.
- Rubin A, Rosebery A, Bruce B. 1988. ELASTIC and reasoning under uncertainty. Research report no. 6851. Boston: BBN Systems and Technologies Corporation.
- Ryan EB, Giles H. 1982. Attitudes towards language variation: Social and applied contexts. London: E. Arnold.
- Schafer JL, Graham JW. 2002. Missing data: our view of the state of the art. Psychol Methods. 7:147–177.
- Schau C, Dauphinee T, Del Vecchio A, Stevens J. 1995. The development and validation of the survey of attitudes toward statistics. Educ Psychol Meas. 55:868–875.
- Schau C. 2003. Students’ attitudes: The “other” important outcome in statistics education. In: Proceedings of the Joint Statistical Meetings. p. 3673–3681.
- Songsore E, White BJ. 2018. Students’ perceptions of the future relevance of statistics after completing an online introductory statistics course. Stat Educ Res. 17:120–140.
- Stanisavljevic D, Trajkovic G, Marinkovic J, Bukumiric Z, Cirkovic A, Milic N. 2014. Assessing attitudes towards statistics among medical students: psychometric properties of the Serbian version of the Survey of Attitudes Towards Statistics (SATS). PLoS One. 9:e112567.
- Stevens T, Wang K, Olivárez A, Hamman D. 2007. Use of self-perspectives and their sources to predict the mathematics enrollment intentions of girls and boys. Sex Roles, 56:351–363.
- Suki NM. 2011. A structural model of customer satisfaction and trust in vendors involved in mobile commerce. Int J Bus Sci Appl Manag (IJBSAM). 6:18–30.
- Tabachnick BG, Fidell LS. 2007. Using multivariate statistics. Boston, MA: Allyn & Bacon/Pearson Education.
- Tabachnick BG, Fidell LS. 2019. Using multivariate statistics. 7th ed. Boston: Pearson.
- Tempelaar DT, Gijselaers WH, van der Loeff SS, Nijhuis JF. 2007. A structural equation model analyzing the relationship of student achievement motivations and personality factors in a range of academic subject-matter areas. Contemp Educ Psychol. 32:105–131.
- Tiedemann J. 2000. Gender-related beliefs of teachers in elementary school mathematics. Educ Stud Math 41:191–207.
- Trochim WM, Donnelly JP. 2006. The research methods knowledge base. 3rd ed. Cincinnati, OH: Atomic Dog.
- Vanhoof S, Kuppens S, Castro Sotos AE, Verschaffel L, Onghena P. 2011. Measuring statistics attitudes: structure of the survey of attitudes toward statistics. Stat Educ Res J. 10:35–51.
- Wainberg J. 2018. Stories vs statistics: the impact of anecdotal data on managerial decision making. Adv Account Behav Res. 21:127–141.
- Watters JJ, Ginns IS. 2000. Developing motivation to teach elementary science: effect of collaborative and authentic learning practices in preservice education. J Sci Teach Educ. 11:301–321.
- Weissglass J, Curnmings D. 1991. Dynamic visual experiments with random phenomena. In: Zimmermann W, Cunningham S, editor. Visualization in mathematics. Washington (DC): Mathematical Association of America. p. 215–223.
- Wise SL. 1985. The development and validation of a scale measuring attitudes toward statistics. Educ Psychol Meas. 45:401–405.
- Zhang Y, Shang L, Wang R, Zhao Q, Li C, Xu Y, Su H. 2012. Attitudes toward statistics in medical postgraduates: measuring, evaluating and monitoring. BMC Med Educ. 12:117.
- Žmuk B. 2015. Business sample survey measurement on statistical thinking and methods adoption: the case of croatian small enterprises. Interdiscip Descr Complex Syst INDECS. 13:154–166.