
Abstract
Background
Ubiquitin-fold modifier-1 (Ufm1) is a recently identified ubiquitin-like protein. We previously confirmed that Ufm1 expression was increased in diabetic mice. However, its role in the development of diabetes remains undefined.
Methods
Lentivirus-mediated gene knockdown and overexpression techniques were used to observe the effect of Ufm1 on the expression of inflammatory factors, adhesion molecules and chemokines, as well as the transcriptional activity of nuclear factor kappa-B (NF-κB) in macrophages. Western blot and immunofluorescence analyses were used to analyse the mechanism by which Ufm1 affects the transcriptional activity of NF-κB. Finally, the effects of Ufm1 on inflammation and pancreatic, renal and myocardial damage were observed in db/db mice.
Results
Knockdown of Ufm1 by lentivirus shRNA targeting Ufm1 (Lv-shUfm1) led to decreased secretion of IL-6, IL-1β, ICAM-1, VCAM-1, MCP-1 and CXCL2 in RAW264.7 cells that were exposed to LPS and TNF-α, while lentiviral overexpression of Ufm1 (Lv-Ufm1) caused the opposite effect. Interestingly, further investigation indicated that Ufm1 induced NF-κB p65 nuclear translocation in RAW264.7 cells via increasing the ubiquitination and degradation of IκBα. In an in vivo experiment, pretreatment of db/db mice with Lv-shUfm1 reduced the mRNA levels of TNF-α, IL-6, IL-1β, ICAM-1, VCAM-1, MCP-1 and CXCL2 in resident peritoneal macrophages (RPMs) and decreased the plasma levels of TNF-α, IL-6, IL-1β, ICAM-1, VCAM-1, MCP-1 and CXCL2. Additionally, in Lv-Ufm1-treated mice, the inverse results were observed. Following treatment with Lv-shUfm1 and Lv-Ufm1, NF-κB p65 nuclear translocation in RPMs was decreased and increased, respectively. Importantly, we observed that Lv-shUfm1 injection led to a decrease in plasma glycaemia, a reduction in urinary albuminuria and cardiomyocyte hypertrophy and an improvement in the histopathological appearance of pancreatic, kidney and myocardial tissue. Pretreatment of the mice with Lv-shUfm1 inhibited macrophage infiltration in the pancreas, kidney and myocardial tissue.
Conclusion
Our data elucidate a new biological function of Ufm1 that mediates inflammatory responses. Ufm1-mediated p65 nuclear translocation occurs by modulating the ubiquitination and degradation of IκBα. Moreover, downregulating Ufm1 is an effective strategy to prevent the development of type 2 diabetes and its complications.
Introduction
Diabetes is a life-threatening metabolic disease that affects 5% of the world’s population. Over 90% of the diabetic population is diagnosed with type 2 diabetes (T2D).Citation1,Citation2 It is well accepted that diabetic complications, such as diabetic nephropathy (DN) and diabetic cardiomyopathy (DC), are the major causes of high mortality.Citation3 In recent years, many pathological factors have been shown to facilitate T2D development, including obesity, insulin resistance, oxidative stress and the inflammatory response.Citation4 Macrophages, the most plastic cells of the haematopoietic system, exhibit great functional diversity and play important roles in homeostasis, tissue repair, the inflammatory response and immunity. Circulating monocytes continuously infiltrate obese adipose tissue, and due to stimulation with inflammatory cytokines, the recruited cells differentiate into pro-inflammatory macrophages.Citation5,Citation6 It is recognized that a chronic low-grade inflammation and an activation of the immune system are involved in the pathogenesis of T2D.Citation7 Macrophage activation has been confirmed to contribute to chronic inflammation in T2D.Citation8 Prospective studies have identified elevated levels of pro-inflammatory cytokines, including tumor necrosis factor (TNF)-α interleukin (IL)-1β and IL-6, chemokines, including monocyte chemotactic protein (MCP)-1 and C-X-C motif chemokine ligand (CXCL) 2, and several adhesion molecules such as intercellular adhesion molecule (ICAM)-1 and vascular cell adhesion molecule (VCAM-1), associate with increased risk of T2D.Citation9 Moreover, pancreatic macrophages may facilitate β-cell regeneration in vivo.Citation10 To better understand the macrophage-mediated inflammatory response in T2D, it will be useful to explore the molecular mechanism and provide potential therapeutic targets to block the onset of diabetes.
The nuclear factor kappa-B (NF-κB) pathway is a pro-inflammatory signalling cascade that regulates pro-inflammatory gene expression, including cytokines, chemokines and adhesion molecules.Citation11 The stimulation of pro-inflammatory cytokines leads to activation of IκB kinase β (IKKβ) and promotes the phosphorylation of inhibitory κB (p-IκB), which releases NF-κB from the cytoplasm to the nucleusCitation11 and regulates target gene transcription, including cytokines (TNF-α, IL-1β, and IL-6), chemokines (MCP-1 and CXCL2) and adhesion molecules (ICAM-1 and VCAM-1).
Ubiquitin-like proteins (Ubls) perform diverse functions on their target proteins. Ubls are involved in various biological processes, including DNA replication, signal transduction, cell cycle control, embryogenesis, cytoskeletal regulation, metabolism, stress response, homeostasis and mRNA processing.Citation12 Ubiquitin-fold modifier-1 (Ufm1) is a recently identified Ubl. Similar to ubiquitination, Ufm1 (ufmylation) modifies protein by using a three-enzyme cascade system.Citation13 However, the detailed biofunctions of Ufm1 are poorly understood, except that it affects cell differentiation and participates in endoplasmic reticulum stress (ERS) in myocardial cells, islet beta cells and tumour cells.Citation14 Notably, we previously found that Ufm1 is dramatically upregulated under atherosclerotic conditions both in vivo and in vitro.Citation15 Moreover, we recently found that Ufm1 expression is increased in the resident peritoneal macrophages (RPMs) of diabetic mice, as well as in RAW264.7 cells subjected to ERS.Citation16 Our findings suggest that Ufm1 may be closely related to the development of diabetes. Moreover, some previously identified Ubls have been confirmed to regulate the activity of NF-κB, such as small ubiquitin-like modifiers (SUMOs) and the ubiquitin-like protein FAT10.Citation17,Citation18 Therefore, the current study aimed to explore the role of Ufm1 in the macrophage-mediated inflammatory response and in the development of T2D and its complications.
Materials and Methods
Cell Culture
The human embryonic kidney 293T (HEK293T) cell line and mouse macrophage cell line RAW264.7 were obtained from the American Type Culture Collection (ATCC; Rockville, MD, USA). All cells were cultured in Dulbecco’s modified Eagle’s medium (HyClone; GE Healthcare Life Sciences, Logan, UT, USA) supplemented with 10% foetal bovine serum (HyClone; GE Healthcare Life Sciences) at 37°C in a 5% CO2 incubator.
Construction of Recombinant Lentivirus and Cell Infection
Lentivirus shRNA targeting Ufm1 (Lv-shUfm1), lentivirus expressing Ufm1 (Lv-Ufm1), negative shRNA control lentivirus (Lv-shNC) and negative control of lentivirus (Lv-NC) were prepared as previously described.Citation16 Briefly, lentiviruses were generated by transfection of 80% confluent HEK293T cells with modified pFU-GW-RNAi plasmid and pHelper 1.0 and pHelper 2.0 helper plasmids (Genechem Co., Ltd., Shanghai, China) using Lipofectamine 2000 according to the manufacturer’s instructions. Lentiviruses were harvested 72 h after transfection and purified using ultracentrifugation. RAW264.7 cells were infected with either Lv-shUfm1 or the negative control Lv-shNC lentivirus. Moreover, we obtained the Ufm1 gene from GenBank (NM_026435), and RAW264.7 cells were infected with either Lv-Ufm1 or the negative control Lv-NC.
Cytokine, Adhesion Molecule and Chemokine Expression
Stably transfected cells were seeded in plates at a density of 5×10⁵ per well, and then the cells were treated with lipopolysaccharide (LPS, 1000 ng/mL, Sigma Chemical Co., St Louis, MO, USA) and TNF-α (20 ng/mL, PeproTech, Rocky Hill, NJ, USA) for 24 h. The cell supernatants were collected, and the levels of IL-6, IL-1β, ICAM-1, VCAM-1, MCP-1 and CXCL2 were measured by ELISA kits according to the manufacturer’s protocol (BD Biosciences, San Jose, CA).
RNA Isolation and Quantitative Reverse Transcription-Polymerase Chain Reaction (qRT-PCR)
Total RNA was isolated from the cells using TRIzol reagent (Invitrogen Life Technologies) according to the instructions. SYBR Green master mix or a TaqMan gene expression assay system (Applied Biosystems) was used. mRNA expression was quantified using the ΔΔCt method, and GAPDH served as the internal control. The following primers for each target gene were used: Ufm1 forward, 5ʹ-TTCCTG CAGCTACAAGTGCG-3ʹ and reverse, 5ʹ-TCCAACTCGGT CTCTAGGAATGAT-3ʹ; TNF-α forward, 5ʹ- TGACCCCCATTACTCTGACC-3ʹ and reverse, 5ʹ- TTCAGCGTCTCGTGTG TTTC-3ʹ; IL-1β forward, 5ʹ-GAGCAACAAGTGGTGTTCTCC-3ʹ and reverse, 5ʹ- AACACGCAGGACAGGTACAG-3ʹ; IL-6 forward, 5ʹ- GGGCTGCGATGGAGTCAGAG-3ʹ and reverse, 5ʹ-TCCCTCACACAGGGCTCGAC-3ʹ; ICAM-1 forward, 5ʹ-AACGACGCTTCTTTTGCTCTG-3ʹ and reverse, 5ʹ- TCTTGCCAGGTCCAGTTCC-3ʹ; VCAM-1 forward, 5ʹ-GGATGCCGGAGTATACGAGTGTG-3ʹ and reverse, 5ʹ-CAATGGCGGGTATTACCAAGGA-3ʹ; MCP-1 forward, 5ʹ- AAGATCTCAGTGCAGAGGCTCG-3ʹ and reverse, 5ʹ- CCA GGGGTAGAACTGTGGTTCAA-3ʹ; CXCL2 forward, 5ʹ-GAACTGCGCTGTCAATGCCT-3ʹ and reverse, 5ʹ-CCGCCCTTGAGAGTGGCTAT-3ʹ; and GAPDH forward, 5ʹ-TGGTGAAGGT CGGTGTGAAC-3ʹ and reverse, 5ʹ-GCTCCTGGAAGATGGTGATGG-3ʹ.
Western Blotting Analysis
Nuclear and cytoplasmic proteins were prepared from the cells using NE-PER nuclear and cytoplasmic extraction reagent kits (ThermoFisher Scientific). The proteins were resolved by 12% SDS-PAGE and transferred to polyvinylidene fluoride membranes (Amersham Pharmacia, NJ, USA). The membranes were preincubated with 5% skimmed milk and then incubated with primary antibodies against Ufm1 (1:10,000; Abcam, Cambridge, MA, USA), NF-κB p65 (1:3000, Santa Cruz Biotechnology, Santa Cruz, CA), p-IKKβ (1:3000; Abcam, Cambridge, MA, USA), p-IκBα (1:3000; Abcam, Cambridge, MA, USA), and IκBα (1:5000; Abcam, Cambridge, MA, USA) at 4°C overnight. After washing, the membranes were stained with ECL detection reagents (Millipore Inc.). The results were detected using a ChemiDoc image analyser (FluorChemo M FM0488, Protein Simple) and are expressed as density values normalized to GAPDH, α-tubulin or histone. Immunoreactive bands were quantified using Gel-Pro 32 software (Media Cybernetics, Inc., Rockville, MD, USA).
NF-κB Transcriptional Activity
Stably transfected cells were stimulated with LPS (1000 ng/mL) and TNF-α (20 ng/mL) for 24 h. The levels of NF-κB p65, IκBα, p-IκBα and p-IKKβ were measured by Western blotting.
Immunofluorescence Analysis
Following treatment with LPS (1000 ng/mL) and TNF-α (20 ng/mL), stably transfected cells were fixed with 95% ethanol for 15 min at −20°C and incubated with antibodies against NF-κB p65, followed by incubation with Alexa Fluor 488 or Alexa Fluor 568-labelled secondary antibodies. Cell nuclei were labelled with DAPI, and images were acquired by laser confocal microscopy (TCS SP8, Leica, Germany).
Animals Study
The current animal experiment was approved by the Committee on Animal Experimentation of Bengbu Medical College and was carried out in accordance with the European Communities Council Directive of 24 November 1986 (86/609/EEC) for the care and use of animals. Six-week-old male db/db mice and db/+ mice were purchased from the Model Animal Research Centre of Nanjing University (Nanjing, China). The mice were housed in cages with standard conditions of 22±2°C, 50%±5% humidity, and a 12 h light-dark cycle. The db/db mice were randomly divided into five groups (n=6). Prior to the injection, 0.1 mL PBS solutions containing 50 μg Lv-shUfm1, Lv-shNC, Lv-Ufm1 and Lv-NC were injected into the mice. The db/+ mice were used as the control group. Finally, the plasma was prepared from the mice at 0, 2, 6 and 12 weeks after injection. Then, the levels of fasting blood glucose (FBG) were detected by an automatic biochemical analyser, and the levels of TNF-α, IL-6, IL-1β, ICAM-1, VCAM-1, MCP-1, and CXCL2 were measured by ELISA kits.
Urine Measurements
Urine was collected for 24 h using metabolism cages. Urinary albuminuria was determined with a commercially available ELISA kit (Exocell, Philadelphia, PA, USA).
Isolation and Culture of Mouse RPMs
RPMs were isolated and cultured according to a previously described method.Citation16 The mRNA levels of TNF-α, IL-6, IL-1β, ICAM-1, VCAM-1, MCP-1, and CXCL2 were measured by RT-PCR. The protein levels of cytoplasmic and nuclear NF-κB p65 were tested by Western blotting.
Histological Analysis
At the end of the study, the mice were anaesthetized and killed. The kidney, heart and pancreatic tissue were removed. The tissues were fixed in 4% paraformaldehyde and embedded in paraffin, and 5-μm sections were stained with haematoxylin-eosin. Pathological scores were recorded based on the following criteria: for the pancreatic tissue,Citation19 the severity of pancreatic islets was scored using a scale of 0–4, where 0 referred to no sign of pathological changes in the pancreatic islets, 1 referred to peri-insulitis (observed pathological infiltration changes only restricted to the surroundings of islets) and a slight reduction in islet area, 2 referred to mild insulitis (less than 25% of the islets showed signs of pathological infiltration changes) and a reduction in islet area, 3 referred to severe evidence of insulitis (between 25 and 75% of the islets showed signs of pathological infiltration changes) and a significant decrease in the area, and 4 corresponded to apparent destructive insulitis (more than 75% of the islets showed signs of pathological infiltration changes). For renal tissues,Citation20 the mesangial expansion index was scored in four levels from 0 to 3: 0, normal glomeruli; 1, matrix expansion appeared in up to 50% of the glomerulus; 2, matrix expansion occurred in 50 to 75% of the glomerulus; and 3, matrix expansion occurred in 75 to 100% of the glomerulus. Micrographs of 10 glomeruli were randomly analysed in each slide. For the myocardial tissues,Citation21 cardiomyocyte hypertrophy was evaluated by measuring cell size, which is usually represented by the short-axis diameters. The short-axis diameters were determined by observation and measurement of the shortest diameters that passed through the cell nucleus. Short-axis diameters of cardiomyocytes were assayed for 10 myocytes per section at 400-fold magnification using an inverted microscope (Olympus, Tokyo, Japan) equipped with an ocular micrometre and then averaged based on the data from 10 myocytes. All pathological evaluations were performed by two independent observers who were blinded to the experimental conditions.
Immunohistochemical Staining
Murine renal, myocardial and pancreatic tissue tissues from each group were fixed for immunohistochemical staining in 10% neutral formalin and processed in the standard manner. Following deparaffinization, all sections were placed in citrate-buffered solution (pH 6.0) and heated for antigen retrieval. The sections were incubated with primary antibody against F4/80 (Santa Cruz Biotechnology, Santa Cruz, CA) overnight at 4°C. After washing, a secondary antibody was added for 30 min at 37°C; the slides were then washed and incubated with DAB for 2 min. F4/80-positive cells were counted and averaged in each sample, which was evaluated in 10 fields by using Image Pro Plus (IPP, Media Cybernetics, Inc., USA).
Statistical Analysis
The data collected are presented as the mean±standard deviation (S.D.). Statistical analysis was tested by one-way ANOVA followed by Tukey’s test (SPSS 16.0, Chicago, IL, USA). A value of P< 0.05 was regarded as statistically significant.
Results
Ufm1 Expression in RAW264.7 Cells Transfected with Lv-Ufm1 and Lv-shUfm1
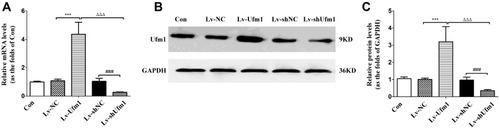
In order to construct Ufm1 knockdown and overexpressed macrophages, Ufm1 expression were detected in RAW264.7 cells transfected with Lv-shUfm1 and Lv-Ufm1. As shown in , the mRNA and protein levels of Ufm1 were both knocked down by Lv-shUfm1 transfection (P<0.001). Moreover, the level of Ufm1 was upregulated in Lv-Ufm1-transfected RAW264.7 cells (P<0.001). All the cells were applied in the following studies.
Figure 1 Ufm1 expression in RAW264.7 cells. (A) Relative mRNA levels of Ufm1 in the control, Lv-NC, Lv-Ufm1, Lv-shNC and Lv-shUfm1 groups were measured by qRT-PCR. (B) The protein levels of Ufm1 in the control, Lv-NC, Lv-Ufm1, Lv-shNC and Lv-shUfm1 groups were assayed by Western blot analysis, and GAPDH was used as an internal control. (C) Relative protein levels of Ufm1 in the control, Lv-NC, Lv-Ufm1, Lv-shNC and Lv-shUfm1 groups were measured by Western blot analysis. The data are presented as the mean±SD, n=3. ***P<0.001 compared to the Lv-NC group, ###P<0.001 compared to the Lv-shNC group, ΔΔΔP<0.001 compared to the Lv-Ufm1 group.
Effects of Ufm1 on the Levels of Inflammatory Cytokines, Chemokines and Adhesion Molecules in RAW264.7 Cells
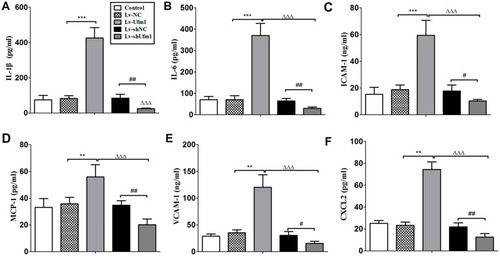
We further investigated inflammatory cytokine, chemokine and adhesion molecule levels in each group of RAW264.7 cells by treatment with LPS and TNF-α. As shown in , no differences in the levels of IL-6, IL-1β, ICAM-1, VCAM-1, MCP-1 and CXCL2 were observed in the control and Lv-NC (or Lv-shNC) groups. However, the production of IL-6, IL-1β, ICAM-1, VCAM-1, MCP-1, and CXCL2 was significantly increased in the Lv-Ufm1 group compared with that in the Lv-NC group (P<0.01). Analogously, the levels of these mediators were significantly decreased in the Lv-shUfm1 group compared with those of the Lv-shNC group (P<0.05). These observations indicate that Ufm1 regulates the release of inflammatory cytokines, chemokines and adhesion molecules in RAW264.7 cells.
Figure 2 Effects of Ufm1 on the levels of IL-6, IL-1β, ICAM-1, VCAM-1, MCP-1, and CXCL2 in RAW264.7 cells. RAW264.7 cells were transfected with lentivirus carrying Lv-shUfm1, Lv-shNC, Lv-Ufm1, and Lv-NC and treated with LPS (1000 ng/mL) and TNF-α (20 ng/mL) for 24 h. The levels of the mediators were assayed by commercial ELISA kits. (A) IL-1β; (B) IL-6; (C) ICAM-1; (D) MCP-1; (E) VCAM-1; and (F) CXCL2. The data are presented as the mean±SD, n=3. **P<0.01, ***P<0.001 compared to the Lv-NC group; #P<0.05, ##P<0.01 compared to the Lv-shNC group; ΔΔΔP<0.001 compared to the Lv-Ufm1 group.
Effects of Ufm1 on NF-κB p65 Nuclear Translocation in RAW264.7 Cells
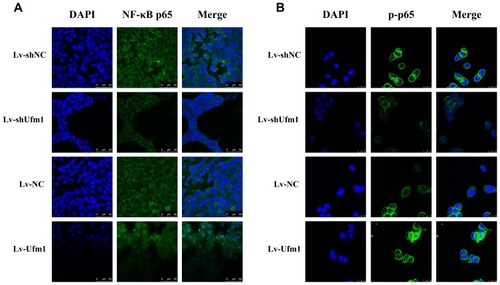
NF-κB mediates the expression of pro-inflammatory genes, including cytokines, chemokines, and adhesion molecules,Citation11 and therefore, we further investigated cytoplasmic and nuclear NF-κB p65 expression in Lv-Ufm1- and Lv-shUfm1-pretreated RAW264.7 cells. Western blot analysis of nuclear extracts revealed that the cytoplasmic levels of the p65 subunit in all groups were decreased time-dependently (P<0.01, ), In contrast, the nuclear levels of the p65 subunit in all groups were increased time-dependently (P<0.01, ). These data suggest that LPS and TNF-α activate NF-κB p65 by promoting its nuclear translocation. More specifically, we found that Lv-Ufm1 led to an increase in nuclear p65 (P<0.01, ) and a decrease in cytoplasmic NF-κB p65 compared with those of Lv-NC-treated cells (P<0.01, 1). Additionally, there was an opposite pattern for NF-κB p65 expression with Lv-shUfm1 treatment compared to that of the Lv-shNC group at the cytoplasmic (P<0.01, ) and nuclear levels (P<0.01, ). We performed immunofluorescence staining to investigate the distribution of NF-κB p65 in RAW264.7 cells. As shown in , p65 and its phosphorylated product p-p65 were predominately found in the cytoplasm of the Lv-shUfm1 group, while NF-κB p65 staining was partially observed in the nucleus. Moreover, p65 and p-p65 increased in the nucleus of Lv-Ufm1-treated cells compared with those of Lv-NC-treated cells, suggesting that Ufm1 promoted the translocation of p65.
Figure 3 Effects of Ufm1 on NF-κB p65 expression in RAW264.7 cells. Immunoblotting results showing cytoplasmic (A) and nuclear (B) NF-κB p65 expression in Lv-shUfm1-, Lv-shNC-, Lv-Ufm1- and Lv-NC-treated RAW264.7 cells. LPS: 1000 ng/mL; TNF-α: 20 ng/mL. The levels of cytoplasmic (A1-A2) and nuclear (B1-B2) p65 were quantified and are shown as the fold change compared to the control (0 min). The data are presented as the mean±SD, n=3. ***P<0.001 compared to the Lv-shNC group; ##P<0.01 compared to the Lv-NC group.
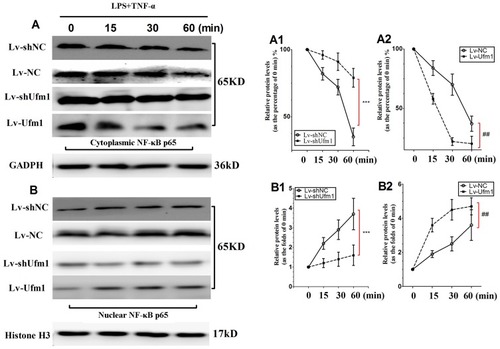
Figure 4 Effects of Ufm1 on NF-κB p65 and p-p65 nuclear translocation in RAW264.7 cells. Immunocytochemical images of NF-κB p65 (A) and p-p65 (B) showing its expression and nuclear translocation in cells treated with LPS and TNF-α for 60 min. LPS: 1000 ng/mL; TNF-α: 20 ng/mL. Green fluorescence indicates localization of the NF-κB p65 or p-p65 subunit, while blue fluorescence indicates nuclear DAPI staining. Magnification: 400×. Representative images of three independent experiments are shown.
Effects of Ufm1 on the NF-κB Signalling Pathway in RAW264.7 Cells
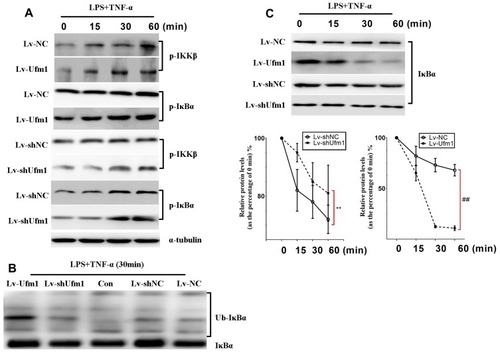
Activation of the NF-κB pathway includes phosphorylation of IKKβ and IκBα and ubiquitination and degradation of IκBα. NF-κB is a heterodimer (composed of p50 and p65 subunits) and is retained in the cytoplasm in an inert form through the interaction of p65 with IκBα.Citation22 In response to various stimuli, IκBα is phosphorylated by an upstream IKK, which in turn triggers ubiquitination and degradation of IkBα, thereby facilitating the nuclear translocation of NF-κB p65.Citation23 To examine how Ufm1 affects NF-κB activation and p65 nuclear translocation, we further studied the cytoplasmic levels of p-IKKβ and p-IκBα. The results showed that the levels of p-IKKβ and p-IκBα in each group were all increased with increasing LPS and TNF-α incubation times (). However, we did not observe any difference in the expression of p-IKKβ and p-IκBα between the Lv-shUfm1 and Lv-shNC groups. The same results were obtained in the groups treated with Lv-Ufm1 and Lv-NC (). Accordingly, to determine whether Ufm1-mediated NF-κB p65 nuclear translocation was due to the ubiquitination and degradation of IκBα, we used the proteasome inhibitor N-acetyl-leucylleucyl-norleucinal (ALLN) to block the degradation of IκBα. As shown in , IκBα ubiquitination was suppressed in Lv-shUfm1 cells compared with that of Lv-shNC cells and was increased in Lv-Ufm1 cells compared with that of the Lv-NC group. Moreover, IκBα degradation in RAW264.7 cells was enhanced in Lv-Ufm1 cells compared with that in Lv-NC cells and was weakened in Lv-shUfm1 cells compared with that in Lv-shNC cells (P<0.01, ).
Figure 5 Ufm1 promotes TNF/LPS-dependent NF-κB activation by promoting the ubiquitination and degradation of IκBα. (A) Effects of Ufm1 on p-IKK and p-IκBα levels in RAW264.7 cells; (B) Effects of Ufm1 on the ubiquitination of IκBα. The cells were incubated with 50 µg/mL ALLN for 30 min and then treated with LPS (1000 ng/mL) and TNF-α (20 ng/mL). Cytoplasmic extracts were fractionated and then subjected to Western blot analysis using specific anti-IκBα antibodies. (C) Effects of Ufm1 on the degradation of IκBα. IκBα levels were quantified and are shown as the fold change compared to the control at 0 min. The data are presented as the mean±SD, n=3. **P<0.01 compared to the Lv-shNC group; ##P<0.01 compared to the Lv-NC group.
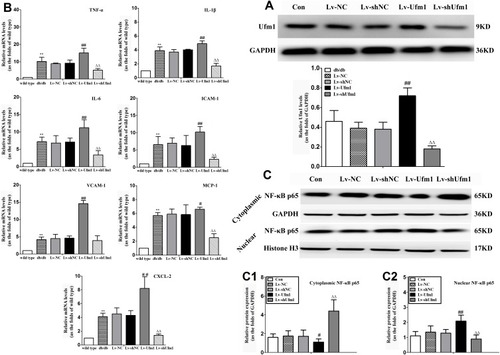
Effects of Ufm1 on the Levels of Inflammatory Mediators and NF-κB p65 Nuclear Translocation in the RPMs of Db/Db Mice
As shown in , treatment of db/db mice with Lv-Ufm1 and Lv-shUfm1 effectively increased and decreased the levels of Ufm1 in the RPMs, respectively. To further investigate the function of Ufm1 in T2D macrophages in vivo, we determined inflammatory cytokines, chemokines and adhesion molecules in RPMs from db/db mice and littermate controls. As shown in , db/db mice displayed high mRNA levels of TNF-α, IL-1β, IL-6, MCP-1, ICAM-1, VCAM-1 and CXCL2 compared with those of control mice (P<0.01). Likewise, in mice pretreated with Lv-Ufm1, the mRNA levels of TNF-α, IL-1β, IL-6, MCP-1, ICAM-1, VCAM-1 and CXCL2 were significantly higher than those of Lv-NC-treated mice (P<0.01, ). Accordingly, in mice pretreated with Lv-shUfm1, the mRNA levels of TNF-α, IL-1β, IL-6, MCP-1, ICAM-1 and CXCL2 were significantly reduced compared with those of the Lv-shNC group (P<0.01, ). As shown in , there were no significant differences in the levels of cytoplasmic and nuclear NF-κB p65 expression between the control and Lv-shNC (Lv-NC) groups. However, increased levels of cytoplasmic NF-κB p65 were found in Lv-shUfm1 cells compared with those of Lv-shNC cells, and decreased expression of the nuclear p65 was observed in Lv-shUfm1 cells compared to that of Lv-shNC cells (P<0.01, ). Moreover, a similar result was also found in the Lv-NC and Lv-Ufm1 groups (P<0.01, ).
Figure 6 Effects of Ufm1 on the levels of inflammatory mediators and NF-κB p65 nuclear translocation in the RPMs of db/db mice. (A). Levels of Ufm1 in RPMs from each group; (B). mRNA expression of pro-inflammatory cytokines (TNF-α, IL-1β, and IL-6), chemokines (MCP-1 and CXCL2) and adhesion molecules (ICAM-1 and VCAM-1) were quantified by using qRT-PCR. For each gene, the mean level was divided by the respective mean of the wild-type; (C). Immunoblotting results showing cytoplasmic and nuclear NF-κB p65 expression in RPMs of the con, Lv-shUfm1, Lv-shNC, Lv-Ufm1 and Lv-NC groups. The expression of cytoplasmic (C1) and nuclear (C2) p65 was quantified and is shown as the fold change compared to the internal control (histone). The data are represented as the mean±SD, n=6. **P<0.01 compared to the control (wild type) group; #P<0.05, ##P<0.01 compared to the Lv-NC group; ΔΔP<0.01 compared to the Lv-shNC group.
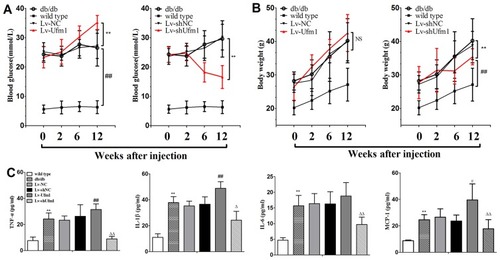
Effects of Ufm1 on Diabetic Performance and Plasma Inflammatory Cytokines in db/db Mice
Changes in the body weights and plasma glucose of all mice studied during the ten-week period are shown in . We found significant differences in glycaemic control and body weight between the db/+ mice and db/db mice (P<0.01, ). As expected, we noticed that there were no significant differences in glycaemic control and body weight between the db/db mice and db/db mice that received Lv-shNC or Lv-NC. FBG levels and body weight in the db/db mice receiving Lv-shUfm1 were lower than those in the Lv-shNC-treated mice (P<0.01, ). Moreover, compared with the levels in Lv-NC-treated mice, FBG levels in the db/db mice receiving Lv-Ufm1 were significantly increased (P<0.01, ). Moreover, we found no significant differences in TNF-α, IL-1β, IL-6 and MCP-1 levels in the db/db mice and db/db mice that received Lv-shNC or Lv-NC. However, knockdown of Ufm1 by Lv-shUfm1 led to decreased levels of TNF-α, IL-1β, IL-6 and MCP-1, and overexpression of Ufm1 in the mice caused an increase in the production of TNF-α, IL-1β and MCP-1 (P<0.01, ).
Figure 7 Effects of Ufm1 on diabetic performance and plasma inflammatory cytokines in db/db mice. (A) At 0, 2, 6 and 12 weeks after injection, blood glucose was detected using a Roche automatic biochemical analyser; (B) Body weight, **P<0.01 compared to the Lv-shNC or Lv-NC group, ##P<0.01 compared to the wild-type group, NS: not significant; (C) The plasma levels of TNF-α, IL-1β, IL-6 and MCP-1 were assayed by commercial ELISA kits. The data are presented as the mean±SD, n=6. **P<0.01 compared to the wild-type group; #P<0.05, ##P<0.01 compared to the Lv-NC group; ΔP<0.05, ΔΔP<0.01 compared to the Lv-shNC group, NS: not significant.
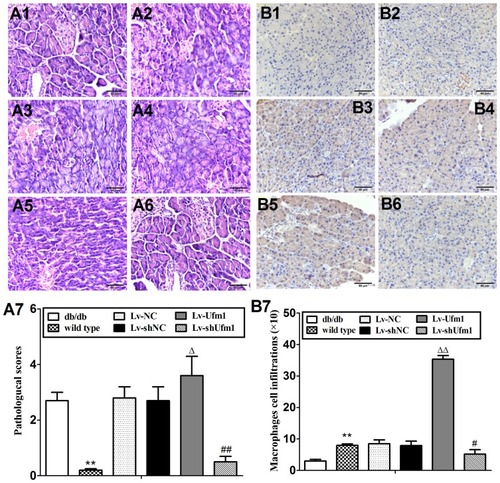
Effects of Ufm1 on the Inflammatory Response in the Pancreas of db/db Mice
As shown in , the wild-type mice displayed regular islet integrity and a larger islet area compared to those of db/db mice (P<0.01), while the mice that were pretreated with Lv-shNC or Lv-NC showed similar pathological performances to that of the control db/db mice. However, – shows that mice treated with Lv-Ufm1 exhibited more disrupted islet integrity with uneven boundaries compared with that of Lv-NC-treated mice (P<0.01), and mice treated with Lv-shUfm1 showed significant improvement in pancreatic pathology compared with that of Lv-shNC -treated mice (P<0.01). The statistical evaluation of pancreatic islet pathological scores in all groups are shown in . Moreover, we found that the numbers of macrophages in db/db mice were similar to those in the Lv-shNC and Lv-NC groups. However, Lv-Ufm1-treated mice exhibited a significant increase in macrophage infiltration, while the Lv-shNC group displayed the opposite results (, P<0.01).
Figure 8 Effects of Ufm1 on pancreatic pathology and macrophage infiltration in db/db mice. H&E staining of pancreatic tissue from db/db mice, and islet size was measured by ImageJ analysis software on alternating pancreatic sections spaced 50 μm apart. Representative pathological pictures of the wild-type (A1), db/db (A2), Lv-NC (A3), Lv-shNC (A4), Lv-Ufm1 (A5), and Lv-shUfm1 groups (A6) and the statistical analysis (A7) are shown. Immunohistochemical analysis of pancreatic sections stained with anti-F4/80 antibody is shown in (B). Representative pictures are provided of the wild-type (B1), db/db (B2), Lv-NC (B3), Lv-shNC (B4), Lv-Ufm1 (B5) and Lv-shUfm1 groups (B6). The statistical results are shown in (B7). The data are presented as the mean±SD, n=6. **P<0.01 compared to the wild-type group; ΔP<0.05, ΔΔP<0.01 compared to the Lv-NC group; #P<0.05, ##P<0.01 compared to the Lv-shNC group.
Effects of Ufm1 on Renal and Myocardial Damage in db/db Mice
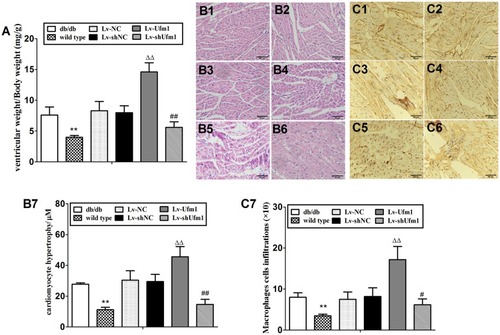
We monitored urinary albuminuria to evaluate the renal function of db/db mice. Twenty-four-hour urinary protein excretion significantly increased in db/db mice compared with that of control mice (P<0.01, ). Furthermore, the level of urinary albuminuria in db/db mice was similar to that of the Lv-NC and Lv-shNC groups. However, Lv-shUfm1 pretreatment markedly attenuated urinary protein excretion in db/db mice, whereas Lv-Ufm1 showed the opposite effects (P<0.01, ). Moreover, renal structures and the inflammatory response were examined by H&E staining and immunohistochemistry, respectively. As shown in , the kidneys of untreated db/db mice showed obvious glomerular epithelial hyperplasia and tubular dilatation. In the mice treated with Lv-shUfm1 and Lv-Ufm1, the pathological scores were markedly decreased and increased, respectively (P<0.01, ). Interestingly, we noticed that deficiency in Ufm1 by Lv-shUfm1 led to reduced macrophage infiltration (P<0.01, ). As shown in –, diabetes-induced myocardial damage and myocardial inflammation in db/db mice were almost completely abrogated in Ufm1 knockdown mice compared to those of the control group (P<0.01). Similarly, there was a higher cardiac index, obvious cardiomyocyte hypertrophy and more macrophage infiltration in the db/db mice than in the control group. Furthermore, in the mice treated with Lv-shUfm1 and Lv-Ufm1, the cardiac index, cardiomyocyte hypertrophy and macrophage infiltration were markedly decreased and increased, respectively (P<0.01, –).
Figure 9 Effects of Ufm1 on spontaneous renal damage in db/db mice. (A). Urinary protein excretion; the data are presented as the mean±SD, n=6, ΔΔP<0.01 compared to the wild-type group; **P<0.01 compared to the Lv-Ufm1 group; ##P<0.01 compared to the Lv-shUfm1 group; (B) Representative renal pathological pictures of the wild-type (B1), db/db (B2), Lv-NC (B3), Lv-shNC(B4), Lv-Ufm1 (B5) and Lv-shUfm1 groups (B6); (B7) shows the pathological scores of each group; (C) Representative renal immunohistochemical pictures of the wild-type (C1), db/db (C2), Lv-NC (C3), Lv-shNC (C4), Lv-Ufm1 (C5) and Lv-shUfm1 groups (C6); (C7) shows the numbers of positive macrophages. The data are presented as the mean±SD, n=6. **P<0.01 compared to the wild-type group, ΔP<0.05, ΔP<0.01 compared to the Lv-NC group; ##P<0.01 compared to the Lv-shNC group.
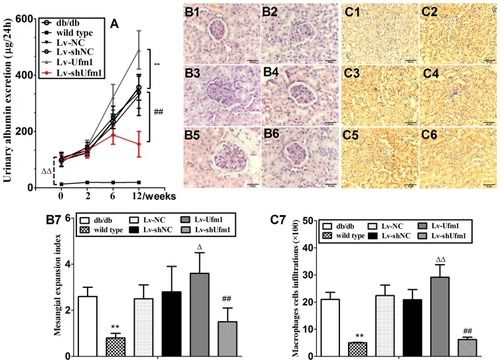
Figure 10 Effects of Ufm1 on diabetic cardiomyopathy in db/db mice. (A). Ventricular index; (B) Representative myocardial pathological pictures of the wild-type (B1), db/db (B2), Lv-NC (B3), Lv-shNC (B4), Lv-Ufm1 (B5) and Lv-shUfm1 groups (B6); (B7) shows the pathological scores of each group; (C) Representative renal immunohistochemical pictures of the wild-type (C1), db/db (C2), Lv-NC (C3), Lv-shNC (C4), Lv-Ufm1 (C5) and Lv-shUfm1 groups (C6); (C7) shows the numbers of positive macrophages in each group. The data are presented as the mean±SD, n=6. **P<0.01 compared to the wild-type group; ΔΔP<0.01 compared to the Lv-NC group; #P<0.05, ##P<0.01 compared to the Lv-shNC group.
Discussion
Ufm1 is a newly identified Ubl that shares 16% sequence identity with ubiquitin.Citation13 At present, little is known about the biological function of Ufm1, although it has been previously reported that Ufm1 affects cell differentiation and participates in ERS in myocardial cells, islet beta cells and tumour cells.Citation14 We have previously found that Ufm1 is dramatically upregulated under atherosclerotic conditions both in vivo and in vitro.Citation15 Moreover, we recently found that Ufm1 expression is increased in RPMs of diabetic mice and in RAW264.7 cells subjected to ERS.Citation16 Our previous findings suggest that Ufm1 may be closely related to the development of diabetes. In the present study, overexpression of Ufm1 in LPS- and TNF-α-treated RAW264.7 cells promoted the secretion of IL-6, IL-1β, ICAM-1, VCAM-1, MCP-1, and CXCL2, while knockdown of Ufm1 by Lv-shUfm1 led to the opposite results. Moreover, our data clearly indicate that Ufm1 promotes the expression of inflammatory cytokines, chemokines and adhesion molecules in RAW264.7 cells in an inflammatory environment.
NF-κB plays key roles in regulating the expression of pro-inflammatory genes, including cytokines, chemokines and adhesion molecules, which has been extensively reviewed elsewhere.Citation11 It is well accepted that translocation of NF-κB from the cytoplasm into the nucleus induces the expression of a broad spectrum of genes.Citation24 Our results showed that overexpression of Ufm1 in RAW264.7 cells enhanced NF-κB p65 nuclear translocation, whereas a reduction in Ufm1 expression inhibited translocation. Moreover, we found that LPS and TNF-α stimulation increased the phosphorylation of IKKβ and IκBα and the ubiquitination and degradation of IκBα, which is in agreement with previous results.Citation24,Citation25 However, altering Ufm1 in RAW264.7 cells by Lv-shUfm1 and Lv-Ufm1 did not affect the phosphorylation of IKKβ or IκBα. Interestingly, overexpression of Ufm1 by Lv-Ufm1 caused enhanced levels of ubiquitination and degradation of IκBα, indicating that Ufm1 mediated NF-κB activation by modulating the total expression of the inhibitory protein IκBα. In a previous study, we reported that Ufm1 increased macrophage cholesterol efflux via increased expression of ATP-binding cassette transporters A1 (ABCA1) and G1 (ABCG1).Citation15 It should be noted that the ABC family member ABCB1, which is expressed on a variety of immune cells, such as monocytes, dendritic cells, T and B cells and macrophages, is involved in the efflux of inflammatory cytokines.Citation26 Activation of the NF-κB pathway induces enhanced biological functions and increases the expression of ABCB1.Citation27 Accordingly, whether the effects of Ufm1 on inflammatory mediator release in RAW264.7 cells depends on ATP-binding cassette transporters remains unclear and needs to be studied in future works.
Diabetes is an inflammatory metabolic disease. We previously found increased Ufm1 expression in the RPMs of diabetic mice. To further support the results of the in vitro study, we investigated the effects of Ufm1 on the inflammatory response in diabetic mice. The present report confirmed that Lv-shUfm1- and Lv-Ufm1-pretreated db/db mice effectively reduced and increased the nuclear translocation of NF-κB p65, respectively. More strikingly, in mice injected with Lv-shUfm1, the serum levels of TNF-α, IL-6, IL-1β, MCP-1, CXCL2, ICAM-1 and VCAM-1 were reduced. The opposite effect was observed in Lv-Ufm1-pretreated mice. Our findings suggest that Ufm1 regulates NF-κB pathway-mediated inflammatory reactions. Of note, our results were similar to and consistent with those of previously described studies. Huang et alCitation28 reported that SUMOs activate NF-κB signalling via sumoylation and ubiquitination of IκBα in inflammation and other diseases under oxidative stress, osmotic pressure, heat shock, ischaemia and infection. Therefore, similar to SUMOs, we hypothesise that Ufm1 plays an important role in regulating protein activity, stability and cellular localization related to immune responses.
Growing evidence has shown that diabetes mellitus, especially diabetic complications, such as diabetic cardiomyopathy and diabetic nephropathy, are the major causes of high mortality.Citation3 Db/db mice are a spontaneous mutation in the 129 C57BL/Ks mouse colony that induces moderate hyperphagia and obesity, accompanied by severe fasting hyperglycaemia that increases with age and a marked increase in plasma insulin concentration.Citation29 Moreover, following the onset of overt diabetes, db/db mice develop progressive kidney disease and diabetic cardiomyopathy, and spontaneous syndromes are extremely similar to those observed in human DN and DC.Citation30,Citation31 Therefore, db/db mice have been widely used to study pathological mechanisms. A number of studies have demonstrated that the activation of macrophages contributes to chronic inflammation in T2D,Citation4 and pro-inflammatory cytokines, chemokines and adhesion molecules positively promote the development of diabetes as well as its subsequent complications. It has been previously shown that macrophages control inflammation in the pancreas, which is characterized by a loss of β-islet cells and decreased insulin production. Hyperglycaemia-induced overproduction of IL-1β by β-cells triggers IL-1β secretion by islet macrophages, resulting in β-cell cytotoxicity and dysfunction.Citation10 TNF-α causes direct cytotoxicity to renal cells, inducing direct renal injury, apoptosis and necrotic cell death.Citation1 Db/db mice with genetic deficiency in ICAM-1 were found to have an 85% reduction in albuminuria compared with that of equally diabetic wild-type controls. MCP-1 is a major chemokine for monocytes/macrophages, and db/db mice that are deficient in MCP-1 have a reduced number of CD68+ macrophages in the glomeruli (48% reduction) and interstitium (78% reduction) compared with that of wild-type mice with diabetes.Citation32,Citation33 Continuous overexpression of both IL-6 and the IL-6 receptor in double transgenic mice is associated with cardiac myocyte hypertrophy.Citation34 As we described before, knockdown of Ufm1 effectively reduced the immunogenicity of macrophages as well as the levels of pro-inflammatory factors. However, whether downregulation of Ufm1 effectively prevents the development of diabetes mellitus, DC and DN remains unknown. At present, our data are the first to show that blockade of Ufm1 in db/db mice significantly inhibits the spontaneous progression of diabetes and diabetic damage in the kidney and heart. It is worth pointing out that knockdown of Ufm1 also led to a reduced number of infiltrating macrophages in the pancreas, kidney and myocardial tissue. Accordingly, we consider that Ufm1 may be a promising drug target for the treatment of T2D and its complications.
Conclusion
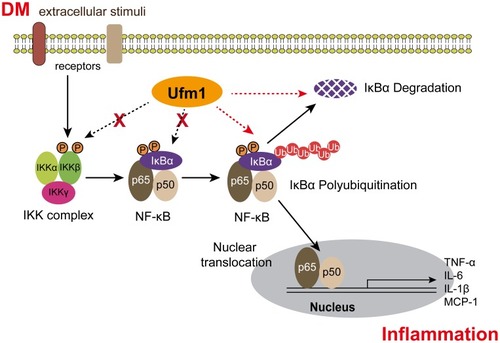
Taken together, our results demonstrate that Ufm1 facilitates NF-κB p65 nuclear translocation not by affecting the expression of p-IKKβ and p-IκBα but increasing the ubiquitination and degradation of IκBα under inflammatory stimuli (). Our data support the regulation of the NF-κB-mediated inflammatory response as a new function of Ufm1. Moreover, reducing Ufm1 expression is an effective strategy to prevent the development of T2D and its complications, and Ufm1 could serve as a promising drug target for the design of new anti-diabetic medicines.
Figure 11 A brief schematic of the molecular mechanism involved in the present study. Ufm1 does not affect the phosphorylation of IKKβ or IκBα but affects the ubiquitination and degradation of IκBα to regulate NF-κB activity.
Disclosure
The authors report no conflicts of interest in this work.
Acknowledgments
This study was supported by the Natural Science Foundation of China (Grant No. 81770803), Anhui Province (Grant No. 1508085SQH220) and the Project of Training and Studying Domestic or Abroad for Excellent Youth Scholars and Key Teacher in Higher Education Institutions of Anhui Province (Grant No. gxgwfx2019028).
References
- BoyleJJ, WeissbergPL, BennettMR. Tumor necrosis factor-alpha promotes macrophage-induced vascular smooth muscle cell apoptosis by direct and autocrine mechanisms. Arterioscler Thromb Vasc Biol. 2003;23(9):1553–1558. doi:10.1161/01.ATV.0000086961.44581.B712869351
- AtteleAS, ZhouYP, XieJT, et al. Antidiabetic effects of Panax ginseng berry extract and the identification of an effective component. Diabetes. 2002;51(6):1851–1858. doi:10.2337/diabetes.51.6.185112031973
- van der MeerIM, RuggenentiP, RemuzziG. The diabetic CKD patient–a major cardiovascular challenge. J Ren Care. 2010;36(Suppl 1):34–46. doi:10.1111/jorc.2010.36.issue-s1
- AhmedM, de WintherMPJ, Van den BosscheJ. Epigenetic mechanisms of macrophage activation in type 2 diabetes. Immunobiology. 2017;222(10):937–943. doi:10.1016/j.imbio.2016.08.01127613200
- KraakmanMJ, MurphyAJ, Jandeleit-DahmK, KammounHL. Macrophage polarization in obesity and type 2 diabetes: weighing down our understanding of macrophage function? Front Immunol. 2014;5:470. doi:10.3389/fimmu.2014.0047025309549
- SuganamiT, NishidaJ, OgawaY. A paracrine loop between adipocytes and macrophages aggravates inflammatory changes: role of free fatty acids and tumor necrosis factor alpha. Arterioscler Thromb Vasc Biol. 2005;25(10):2062–2068. doi:10.1161/01.ATV.0000183883.72263.1316123319
- EsserN, Legrand-PoelsS, PietteJ, ScheenAJ, PaquotN. Inflammation as a link between obesity, metabolic syndrome and type 2 diabetes. Diabetes Res Clin Pract. 2014;105(2):141–150. doi:10.1016/j.diabres.2014.04.00624798950
- WynnTA, ChawlaA, PollardJW. Macrophage biology in development, homeostasis and disease. Nature. 2013;496(7446):445–455. doi:10.1038/nature1203423619691
- MaiorinoMI, BellastellaG, GiuglianoD, EspositoK. From inflammation to sexual dysfunctions: a journey through diabetes, obesity, and metabolic syndrome. J Endocrinol Invest. 2018;41(11):1249–1258. doi:10.1007/s40618-018-0872-629549630
- MorrisDL. Minireview: emerging concepts in islet macrophage biology in Type 2 diabetes. Mol Endocrinol. 2015;29(7):946–962. doi:10.1210/me.2014-139326001058
- LawrenceT. The nuclear factor NF-kappaB pathway in inflammation. Cold Spring Harb Perspect Biol. 2009;1(6):a001651. doi:10.1101/cshperspect.a00165120457564
- CajeeUF, HullR, NtwasaM. Modification by ubiquitin-like proteins: significance in apoptosis and autophagy pathways. Int J Mol Sci. 2012;13(9):11804–11831. doi:10.3390/ijms13091180423109884
- YooHM, ParkJH, JeonYJ, ChungCH. Ubiquitin-fold modifier 1 acts as a positive regulator of breast cancer. Front Endocrinol (Lausanne). 2015;6:36. doi:10.3389/fendo.2015.0003625852645
- HochstrasserM. Origin and function of ubiquitin-like proteins. Nature. 2009;458(7237):422–429. doi:10.1038/nature0795819325621
- PangQ, XiongJ, HuXL, et al. UFM1 protects macrophages from oxLDL-induced foam cell formation through a liver x receptor alpha dependent pathway. J Atheroscler Thromb. 2015;22(11):1124–1140. doi:10.5551/jat.2882926040753
- HuX, PangQ, ShenQ, et al. Ubiquitin-fold modifier 1 inhibits apoptosis by suppressing the endoplasmic reticulum stress response in Raw264.7 cells. Int J Mol Med. 2014;33(6):1539–1546. doi:10.3892/ijmm.2014.172824714921
- DesterroJM, RodriguezMS, HayRT. SUMO-1 modification of IkappaBalpha inhibits NF-kappaB activation. Mol Cell. 1998;2(2):233–239. doi:10.1016/S1097-2765(00)80133-19734360
- GongP, CanaanA, WangB, et al. The ubiquitin-like protein FAT10 mediates NF-kappaB activation. J Am Soc Nephrol. 2010;21(2):316–326. doi:10.1681/ASN.200905047919959714
- HanX, TaoYL, DengYP, et al. Metformin ameliorates insulitis in STZ-induced diabetic mice. PeerJ. 2017;5:e3155. doi:10.7717/peerj.315528439456
- HuX, ZhangX, JinG, ShiZ, SunW, ChenF. Geniposide reduces development of streptozotocin-induced diabetic nephropathy via regulating nuclear factor-kappa B signaling pathways. Fundam Clin Pharmacol. 2017;31(1):54–63. doi:10.1111/fcp.2017.31.issue-127521287
- JiangC, TongYL, ZhangD, LiuLZ, WangJF. Sinomenine prevents the development of cardiomyopathy in diabetic rats by inhibiting inflammatory responses and blocking activation of NF-kappaB. Gen Physiol Biophys. 2017;36(1):65–74. doi:10.4149/gpb_201603327901470
- BaeuerlePA, BaltimoreD. NF-kappa B: ten years after. Cell. 1996;87(1):13–20. doi:10.1016/S0092-8674(00)81318-58858144
- ZandiE, KarinM. Bridging the gap: composition, regulation, and physiological function of the IkappaB kinase complex. Mol Cell Biol. 1999;19(7):4547–4551. doi:10.1128/MCB.19.7.454710373503
- BhushanS, TchatalbachevS, LuY, et al. Differential activation of inflammatory pathways in testicular macrophages provides a rationale for their subdued inflammatory capacity. J Immunol. 2015;194(11):5455–5464. doi:10.4049/jimmunol.140113225917085
- TakadaY, IchikawaH, BadmaevV, AggarwalBB. Acetyl-11-keto-beta-boswellic acid potentiates apoptosis, inhibits invasion, and abolishes osteoclastogenesis by suppressing NF-kappa B and NF-kappa B-regulated gene expression. J Immunol. 2006;176(5):3127–3140. doi:10.4049/jimmunol.176.5.312716493072
- CoryTJ, HeH, WinchesterLC, KumarS, FletcherCV. Alterations in P-glycoprotein expression and function between macrophage subsets. Pharm Res. 2016;33(11):2713–2721. doi:10.1007/s11095-016-1998-x27431863
- Abd EllahNH, TaylorL, AyresN, et al. NF-kappaB decoy polyplexes decrease P-glycoprotein-mediated multidrug resistance in colorectal cancer cells. Cancer Gene Ther. 2016;23(5):149–155. doi:10.1038/cgt.2016.1727125866
- HuangW, XuL, ZhouX, et al. High glucose induces activation of NF-kappaB inflammatory signaling through IkappaBalpha sumoylation in rat mesangial cells. Biochem Biophys Res Commun. 2013;438(3):568–574. doi:10.1016/j.bbrc.2013.07.06523911785
- FellmannL, NascimentoAR, TibiricaE, BousquetP. Murine models for pharmacological studies of the metabolic syndrome. Pharmacol Ther. 2013;137(3):331–340. doi:10.1016/j.pharmthera.2012.11.00423178510
- IslamMS. Animal models of diabetic neuropathy: progress since 1960s. J Diabetes Res. 2013;2013:149452. doi:10.1155/2013/14945223984428
- BetzB, ConwayBR. Recent advances in animal models of diabetic nephropathy. Nephron Exp Nephrol. 2014;126(4):191–195. doi:10.1159/00036330025034792
- ChowFY, Nikolic-PatersonDJ, OzolsE, AtkinsRC, TeschGH. Intercellular adhesion molecule-1 deficiency is protective against nephropathy in type 2 diabetic db/db mice. J Am Soc Nephrol. 2005;16(6):1711–1722. doi:10.1681/ASN.200407061215857924
- ChowFY, Nikolic-PatersonDJ, MaFY, OzolsE, RollinsBJ, TeschGH. Monocyte chemoattractant protein-1-induced tissue inflammation is critical for the development of renal injury but not type 2 diabetes in obese db/db mice. Diabetologia. 2007;50(2):471–480. doi:10.1007/s00125-006-0497-817160673
- HirotaH, YoshidaK, KishimotoT, TagaT. Continuous activation of gp130, a signal-transducing receptor component for interleukin 6-related cytokines, causes myocardial hypertrophy in mice. Proc Natl Acad Sci U S A. 1995;92(11):4862–4866. doi:10.1073/pnas.92.11.48627539136