
 ?Mathematical formulae have been encoded as MathML and are displayed in this HTML version using MathJax in order to improve their display. Uncheck the box to turn MathJax off. This feature requires Javascript. Click on a formula to zoom.
Abstract
Hepatocellular carcinoma (HCC) is one of the most common malignant tumors worldwide. In this study, sorafenib-loaded lipid-based nanosuspensions (sorafenib-LNS) were first developed as an intravenous injectable formulation to increase the efficacy of sorafenib against HCC. LNS were used as nanocarriers for sorafenib owing to their desired features in increasing the solubility and dissolution velocity, improving the bioavailability of sorafenib. Sorafenib-LNS were prepared by nanoprecipitation and consisted of spherical particles with a uniform size distribution (164.5 nm, polydispersity index =0.202) and negative zeta potential (−11.0 mV). The drug loading (DL) was 10.55%±0.16%. Sorafenib-LNS showed higher in vitro cytotoxicity than sorafenib against HepG2 cells (P<0.05) and Bel-7402 cells (P<0.05). The in vivo biodistribution, biocompatibility, and antitumor efficacy of sorafenib-LNS were evaluated in H22-bearing liver cancer xenograft murine model. The results showed that sorafenib-LNS (9 mg/kg) exhibited significantly higher antitumor efficacy by reducing the tumor volume compared with the sorafenib oral group (18 mg/kg, P<0.05) and sorafenib injection group (9 mg/kg, P<0.05). Furthermore, the results of the in vivo biodistribution experiments demonstrated that sorafenib-LNS injected into H22 tumor-bearing mice exhibited increased accumulation in the tumor tissue, which was confirmed by in vivo imaging. In the current experimental conditions, sorafenib-LNS did not show significant toxicity both in vitro and in vivo. These results suggest that sorafenib-LNS are a promising nanomedicine for treating HCC.
Introduction
Hepatocellular carcinoma (HCC) is the sixth most common malignant tumor and the third most frequent cause of cancer death worldwide.Citation1 More than 80% of patients with HCC are diagnosed at advanced stages of the disease and can only receive palliative treatments; therefore, the prognosis is generally poor with a 5-year survival rate of <5%.Citation2,Citation3 Sorafenib was approved for treating HCC by the US Food and Drug Administration (FDA) in 2007 based on the survival advantage identified in a clinical trial, and it was recommended as the first-line drug for HCC therapy by the National Comprehensive Cancer Network and the American Association for the Study of Liver Diseases. Sorafenib has become the standard therapeutic regimen for patients with advanced HCC and also for those progressing after locoregional therapy.Citation4–Citation8
Sorafenib is a small multikinase inhibitor that inhibits cell proliferation via inhibiting the Raf/MEK/ERK signaling pathway and prevents angiogenesis via inhibiting vascular endothelial growth factor and platelet-derived growth factor receptors.Citation9 Currently, sorafenib is administered orally, and the recommended dosage is 400 mg twice daily, although dose reduction or temporary discontinuation occurs frequently because of the unavoidable adverse events, such as gastrointestinal irritation (even major bleeding episodes), diarrhea, and hypertension (estimated to occur in roughly 30% of patients).Citation10–Citation12 In addition, the clinical use of sorafenib is limited by its low oral bioavailability (~8.43%), owing to its poor aqueous solubility.Citation13 Studies have focused on increasing the antitumor efficacy of sorafenib by improving its solubility and developing injectable formulations.Citation14,Citation15
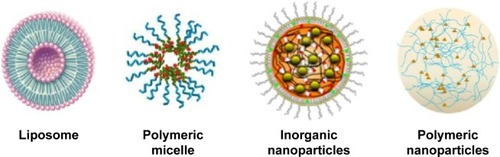
In this context, rapid growth in nanotechnology toward the development of nanomedicine products holds great promise for cancer therapy.Citation16,Citation17 Nanomedicines have unique properties, such as high surface-to-volume ratio and favorable physicochemical characteristics.Citation18–Citation20 These properties can improve the pharmacokinetics and pharmacodynamics of conventional therapeutics and optimize the efficacy of existing anticancer compounds.Citation19 Various types of nanomedicines have been approved by the FDA and the European Medicines Agency, including lipid-based nanocarriers, polymer-based nanocarriers, inorganic nanoparticles (NPs), and nanosuspensions.Citation15,Citation19,Citation21,Citation22
The antitumor efficacy of sorafenib has been improved by using various types of nanocarriers, such as poly(lactic-co-glycolic acid) (PLGA) NPs, polymeric micelles, and microspheres, for efficient sorafenib delivery.Citation14,Citation23–Citation25 For example, sorafenib-loaded a,b-poly(N-2-hydroxyethyl)-d, l-aspartamide–ethylenediamine–poly-lactic acid micelles (~120.2 nm) with a drug loading (DL) of ~3.0% were developed by Craparo et al, and biodistribution studies demonstrated that the amount of sorafenib encapsulated in the micelles reaching the liver was substantially greater than that of free sorafenib, indicating increased accumulation of sorafenib in the liver.Citation26 Lin et al prepared sorafenib-loaded PLGA NPs that were spherical in shape and 270 nm in size. Sorafenib-PLGA NPs prolonged the circulation of sorafenib considerably and increased its antifibrotic and antiangiogenic effects compared with free sorafenib.Citation24 Liu et alCitation14 prepared sorafenib-loaded polymeric NPs at a DL of 2.38%±0.04%, and the NPs exhibited a higher antitumor effect than free sorafenib (P<0.05). These results indicated that sorafenib nanocarriers are promising for HCC treatment ().
Figure 1 Illustration of sorafenib-loaded nanomedicines.
We have developed nanodrug delivery systems to increase the antitumor efficacy of sorafenib, including polymeric NPs and lipidosomes.Citation14,Citation27 Lipid-based nanosuspensions (LNS) show unique advantages. First, the injectable phospholipids were used as the stabilizer to ensure better biocompatibility than polymeric NPs. Second, nanosuspensions have high drug-loading capacities, allowing a high drug concentration to reach the target sites and solving the problems of low loading capacity and drug leakage that other nanocarriers, such as liposomes, suffer from.Citation28 Third, sorafenib has a high lipophilicity (log P=3.8); thus, phospholipids are the appropriate stabilizers to ensure great compatibility with sorafenib.Citation29 In our previous work, we prepared docetaxel-loaded LNS and N3-O-toluyl-fluorouracil-loaded LNS by high-pressure homogenization, and both exhibited good antitumor activity and better tumor accumulation than the free drug, which suggested that LNS may be a promising drug delivery system for cancer therapy.Citation29,Citation30
In this study, sorafenib-loaded LNS (sorafenib-LNS) were prepared by nanoprecipitation as an intravenous (IV) injectable formulation that we expected would increase the therapeutic efficiency and reduce gastrointestinal irritation. The particle size, zeta potential, and in vitro release properties of sorafenib-LNS were characterized. The in vitro cytotoxicity was tested on HepG2 and Bel-7402 cells using the 3-(4-5-dimethylthiazol-2-yl)-2,5-diphenyltetrazolium bromide (MTT) assay. The in vivo imaging, tissue biodistribution, and antitumor efficacy were evaluated experimentally in an H22 liver cancer xenograft murine model. In addition, primary safety evaluations were performed.
Materials and methods
Chemicals and cell lines
Sorafenib was obtained from Shanghai Biochempartner Co., Ltd. (Shanghai, People’s Republic of China). Injectable soya phosphatidylcholine was supplied by Shanghai Pharmaceutical Co., Ltd. (Shanghai, People’s Republic of China). Nonionic surfactant polysorbate 80 (Tween-80) was purchased from Sinopharm Chemical Reagent Co., Ltd. (Shanghai, People’s Republic of China). MTT was purchased from Solarbio Bioscience & Technology Co., Ltd. (Shanghai, People’s Republic of China). The 1,1′-Dioctadecyl-3,3,3′,3′-tetramethylindotricarbocyanine iodide (DiR) was purchased from Fanbo Biochemicals Co., Ltd. (Beijing, People’s Republic of China). All reagents, including acetonitrile and methanol, for high-performance liquid chromatography (HPLC) analysis were HPLC grade. All other chemicals and solvents used were analytical reagent grade.
Human HCC cell line (HepG2) and murine HCC cells (H22) were gifts from the Institute of Immunopharmacology and Immunotherapy, Shandong University (Jinan, People’s Republic of China). The human hepatoma cell line Bel-7402 was donated by the Institute of Pharmacochemistry, Shandong University. The use of these cell lines was approved by the review board of the Institute of Pharmacochemistry.
Animals and tumor model
All animal experiments were carried out in compliance with the requirements of the National Act on the Use of Experimental Animals (People’s Republic of China) and were approved by the Experimental Animal Ethical Committee of Shandong University. Female Kunming mice (4–5 weeks old, ~20 g) and rabbits (New Zealand White, 2.5–3.0 kg) were obtained from the Medical Animal Test Center of the New Drugs Evaluation Center, Shandong University. Mice were housed in groups of six to eight, and rabbits were housed in individual cages. The animals were allowed free access to diet and water and were acclimatized for 1 week before experiments.
To obtain the liver cancer xenograft murine model, a cell suspension (0.1 mL, containing 1×10⁶ viable H22 cells) was implanted into the subcutaneous region of the right flanks of the Kunming mice. After inoculation, the tumor growth in each mouse was closely monitored. The individual tumor volume (V) was calculated by V = (W2 × L)/2, where the width (W) is the shortest tumor diameter, and the length (L) is the longest tumor diameter.
Mice were sacrificed by cervical dislocation, and the rabbits were sacrificed by lethal injection with a sodium pentobarbital solution.
Preparation of sorafenib-LNS
Sorafenib-LNS were prepared by the solvent displacement technique (nanoprecipitation).Citation31 Soya lecithin was used because of its good biocompatibility and its compatibility with hydrophobic drugs. Briefly, soya lecithin (150 mg) and sorafenib (18 mg) were dissolved in methanol (2 mL) to form the organic phase at room temperature under ultrasonication. Tween-80 (1.5%, w/v) was dissolved in water (20 mL) to obtain the aqueous phase. The organic phase was added dropwise, at a speed of 5 mL/h using a microsyringe pump, (KD Scientific, Holliston, MA, USA) to the aqueous phase under mechanical stirring (DC-40; Hangzhou Electrical Engineering Instruments, Hangzhou, People’s Republic of China) at 1,000 rpm in an ice bath. The solution was left at room temperature and then stirred to evaporate the organic solvent, and the obtained sorafenib-LNS were lyophilized to improve the stability. The freshly prepared LNS were dispensed into glass vials, mannitol (5%, w/v) was added as lyoprotectant, and the mixture was frozen at −80°C for 24 hours. The vials were then transferred to a freeze-dryer (ALPHA1-2; Martin Christ Gefriertrocknungsanlagen GmbH, Osterode am Harz, Germany) for 48 hours to obtain the lyophilized sorafenib-LNS powder.
HPLC analysis of sorafenib and drug content
Sorafenib samples were analyzed by reversed-phase HPLC method adapted from Liu et al.Citation14 An HPLC system (HP1200; Agilent Technologies, Santa Clara, CA, USA) with a ultraviolet (UV) detector set at 264 nm was used. Chromatography was performed on a 4.6×250 mm column packed with 5 μm particles (Venusil XBP C-18; Bonna-Agela Technologies, Tianjin, People’s Republic of China) under ambient temperature. The mobile phase consisted of acetonitrile–0.03% aqueous triethylamine (63:37, v/v). The samples were diluted with methanol and directly injected (20 μL) into the HPLC system without further treatment.Citation29 The flow rate was 1.0 mL/min. The calibration curve of the peak area against sorafenib concentration was A=5,908.5C±737.04 (A is the peak area and C is the sorafenib concentration; r=0.9997) for sorafenib concentration of 0.2–20 μg/mL. The precision, calibration curves, and accuracy were quantified. The drug content in the sorafenib-LNS was measured by the HPLC method described earlier. Sorafenib-LNS (0.01 mL) and methanol (0.99 mL) were added to an Eppendorf tube, and then the tube was vortexed for 1 minute. The solution was injected into the HPLC system to detect the drug content in sorafenib-LNS. The DL% of sorafenib-LNS was calculated by
Characterization of sorafenib-LNS
Particle size and zeta potential analysis
The lyophilized sorafenib-LNS were redispersed with phosphate-buffered saline (PBS) (pH 7.4) before measurement. The particle size and zeta potential of sorafenib-LNS were determined at 25°C by dynamic light scattering and electrophoretic mobility, respectively (Zetasizer Nano ZS 3000 SH; Malvern Instruments, Malvern, UK).
Transmission electron microscopy
Characterization of the external morphology of sorafenib-LNS was determined by transmission electron microscopy (TEM). A drop of freshly prepared sorafenib-LNS was adsorbed on the surface of a copper grid and air-dried. Owing to the poor conductivity of the organic samples, negative staining with a drop of 2% aqueous sodium phosphotungstate for contrast enhancement was performed 2 minutes before TEM measurements.Citation32
In vitro release studies
The in vitro release profile of sorafenib was evaluated by the dialysis bag diffusion technique. PBS (pH =7.4) was chosen as the release medium, and 1% (w/v) of Tween-80 was added to solubilize the sorafenib in the release medium.Citation33 Cremophor EL–ethanol (1:1, v/v) was used to dissolve sorafenib, which was then diluted with the release medium to the required concentration.Citation14 Typically, sorafenib solution (1 mL) and sorafenib-LNS (final sorafenib concentration, 15 μg/mL) were placed in preswelled dialysis bags with a 8.0–14.0 kDa molecular weight cutoff, and then the bags were placed in 50 mL conical tubes containing the release media (15 mL). The conical tubes were placed in a shaking incubator with a stirring speed of 100 rpm at a temperature of 37°C. At predetermined sampling times, the whole medium was removed and replaced with fresh PBS to maintain sink conditions. The amount of sorafenib released was determined by the HPLC method described earlier. The release rate was calculated by EquationEquation 2(2) , and the results were expressed as the mean ± SD (n=3).
Preliminary physical stability
Physical stability
The physical stability of the lyophilized LNS was measured at 4°C±2°C and 25°C±2°C. The changes in particle size were recorded over 3 months.
Serum stability study
Lyophilized sorafenib-LNS were redispersed with PBS (pH 7.4) and then were incubated in 20% or 100% serum at 37°C for 0 hour, 1 hour, 2 hours, 4 hours, 10 hours, 12 hours, 26 hours, 36 hours, 48 hours, and 60 hours. The serum stability was monitored by measuring the particle size distribution.
In vitro cytotoxicity of sorafenib-LNS
Cell culture
HepG2 cell line and Bel-7402 cells were cultured in Roswell Park Memorial Institute 1640 media in a 25 cm2 culture flask. The media were supplemented with 10% (v/v) fetal bovine serum and 1% penicillin/streptomycin. The cells were cultured at 37°C under 5% CO2.
Analysis of in vitro cytotoxicity
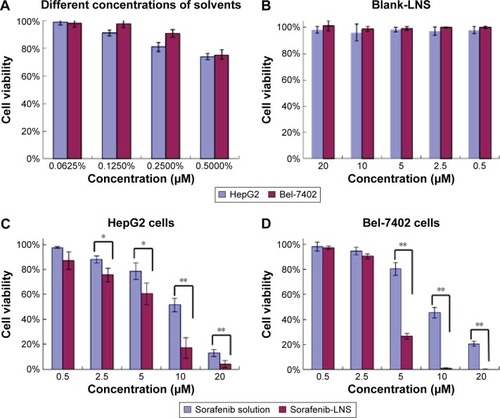
Cell growth inhibition efficiency was assessed on HepG2 and Bel-7402 cells by MTT assay. Cells were seeded in 96-well plates at a cell density of 7,000 cells per well, followed by growth for 24 hours at 37°C in a cell culture incubator to allow cell attachment. In the next 48 hours, the cells were exposed to the following treatments: 1) different solvent concentrations (Cremophor EL–ethanol, 1:1, v/v), 2) blank-LNS, 3) sorafenib solution (dissolved in Cremophor EL–ethanol, 1:1, v/v, diluted with cell-conditioned medium), and 4) sorafenib-LNS. All preparations were sterilized by filtering through a 0.22 μm sterile filter. The stock solutions were serially diluted with serum-supplemented media with solvent concentrations of 0.0625%, 0.125%, 0.250%, and 0.500%, and the final concentrations of sorafenib were 0.5 μM, 2.5 μM, 5 μM, 10 μM, and 20 μM, respectively. Blank-LNS were diluted to the corresponding sorafenib-LNS concentrations using the same method. Each concentration was tested in quintuplicate. After 48 hours of incubation, MTT solution (20 μL, 5 mg/mL in PBS) was added to each well and incubated for another 4 hours. The culture medium and excess MTT were removed, dimethyl sulfoxide (DMSO) (150 μL) was used to dissolve internalized purple formazan crystals, and the plate was placed in the oscillating bioreactor and vibrated for 10 minutes to ensure complete dissolution.
The absorbance (Abs) was measured by a microplate reader (Model 680; Bio-Rad Laboratories Inc., Hercules, CA, USA) with a test wavelength of 490 nm and a reference wavelength of 570 nm.Citation34 All experiments were repeated in triplicate. Untreated cells were taken as control with 100% viability, and cells without MTT were used as a blank to calibrate the spectrophotometer to zero absorbance. Cell viability was calculated according to
A high concentration of alcohol and Cremophor EL can be cytotoxic. To ensure that the cytotoxicity of sorafenib solution was independent of the solvents, the solvents’ concentration was optimized to determine the dilution multiple for sorafenib solution.
In vivo biodistribution of sorafenib-LNS
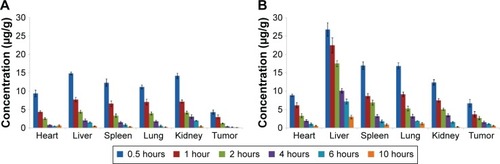
Biodistribution experiments were carried out in Kunming mice, previously inoculated with H22 cells. Both sorafenib-LNS and sorafenib solution (Cremophor EL–ethanol, 1:1, v/v, diluted with normal saline [NS]) were sterilized by filtering through a 0.22 μm sterile filter and administered IV via the tail vein at a dose of 9 mg/kg. The mice were sacrificed by cervical dislocation at predefined time periods (0.5 hours, 1 hour, 2 hours, 4 hours, 6 hours, and 10 hours). The tumors, hearts, livers, spleens, lungs, and kidneys were harvested, washed, weighed, and homogenized (T 10 Ultra-Turrax®; IKA® Werke GmbH & Co., Staufen, Germany). Tissue concentrations of sorafenib were determined by reversed-phase HPLC with UV detector.
In vivo real-time near-infrared fluorophore imaging
To observe the biodistribution of LNS formulation over time, real-time near infrared fluorophore (NIRF) imaging was used to monitor the particle fate. An NIRF dye, DiR, replaced sorafenib in the formulation. When the tumors reached 200–300 mm3, the mice were administered DiR-loaded LNS (DiR-LNS) (200 μL, DiR concentration: 40 μg/mL) IV via tail vein injection. Free DiR (40 μg/mL) and NS were used as controls.Citation35 All preparations were sterilized by filtering through a 0.22 μm sterile filter. After 1 hour, 2 hours, 4 hours, 6 hours, 10 hours, 24 hours, and 48 hours, the mice were anesthetized with 10% chloral hydrate (intraperitoneal) and then placed on their back in a light-tight chamber. The real-time NIRF images were taken using an NIRF imaging system (Xenogen IVIS Lumina; Caliper Life Sciences, Waltham, MA, USA) with an indocyanine green filter (excitation at 745 nm and emission at 835 nm) at the time points.Citation36 The exposure time was 3 seconds. Results were analyzed using the Living Image 3.1 software (Caliper Life Sciences).
In vivo antitumor efficacy evaluation
The in vivo antitumor efficacy evaluation was carried out in H22 tumor-bearing Kunming mice. The tumors grew to a volume of ~100 mm3 5–8 days after inoculation. Mice were randomly divided into the following four groups (n=6 per group): 1) NS, 2) sorafenib solution (Cremophor EL–ethanol, 1:1, v/v, diluted with NS, 18 mg/kg, oral), 3) sorafenib solution (Cremophor EL–ethanol 1:1, v/v, diluted with NS, 9 mg/kg, IV, and 4) sorafenib-LNS (9 mg/kg, IV). All preparations were sterilized by filtering through a 0.22 μm sterile filter. Mice were administered the appropriate preparation every 3 days for 3 weeks. The average tumor sizes were evaluated using a Vernier caliper to monitor the antitumor efficacy; animals were weighed on alternate days to ascertain possible systemic toxicity. In addition, the tumor volume treatment-to-control (T/C) ratio was also used to estimate the antitumor efficacy and was calculated withCitation37
Histological observations
Female Kunming mice (18–22 g) were injected with NS, blank-LNS, and sorafenib-LNS (9 mg/kg) through the tail vein every 3 days. All preparations were sterilized by filtering through a 0.22 μm sterile filter. Three weeks later, the animals were sacrificed, and the organs (hearts, livers, spleens, lungs, and kidneys) were dissected and washed with NS. The organs were treated with formalin, paraffin embedded, and sectioned. The sections were then stained with hematoxylin and eosin for histopathological examination.
In vivo vascular irritation study
The vascular irritation potential of the treatments was evaluated in the ear marginal veins of rabbits. Six rabbits (2.0–2.5 kg) were randomly divided into two groups (group A and group B). The rabbits in group A received sorafenib solution (Cremophor EL–ethanol, 1:1, v/v, diluted with NS), whereas those in group B received sorafenib-LNS at a dosage of 3.2 mg/kg. Accurate volumes of the treatments were injected through the marginal veins of the right ears at a rate of 2 mL/min. As the control treatment, NS was injected into the left ear marginal vein. All injections were performed once a day for five consecutive days. The rabbits were killed 2 days after the last administration, and two parts of the ear vein were obtained for observation, including the regions 1 cm (proximal region) and 2 cm (distal region) from the pinprick. Histopathological examination was performed blindly to evaluate their possible irritation, such as thrombosis, necrosis, and hemorrhage.
Hemolysis assay
Hemocompatibility studies are important for evaluating the safety of IV preparations. In the hemolysis assay, fresh rat blood was collected and stirred to remove the fibrous protein from the blood. Red blood cells (RBCs) were separated from plasma by centrifugation, washed with saline, and resuspended at a 2% (v/v) cell concentration. The RBC suspension was mixed with sorafenib-LNS. Deionized water was added as a positive control, and saline solution was added for the negative control group. After incubation at 37°C for 3 hours, the mixture was centrifuged at 3,000 rpm for 10 minutes to precipitate erythrocytes. The supernatant was collected and analyzed for released hemoglobin with a UV/visible spectrophotometer at 576 nm as an indication of RBC lysis. The hemolysis ratio (HR%) was calculated according to
Use of sorafenib solution
In this pharmacodynamic evaluation, the reasons for selecting sorafenib solution (Cremophor EL–ethanol, 1:1, v/v, diluted in PBS) rather than a commercial product as the control were as follows: 1) sorafenib is currently clinically available in oral tablet formulation, but it is difficult for mice to swallow pills; 2) the dosage for mice is much less than the drug content of each tablet; thus, it is hard to ensure accurate dosage; and 3) Cremophor EL–ethanol mixture (1:1, v/v) was used to dissolve sorafenib because it is already used to overcome the low aqueous solubility of paclitaxel clinically, and this formulation is commercially available as Taxol®, which was approved by FDA for the treatment of breast cancer in 1992.Citation38
Statistics analysis
All studies were repeated at least three times. All experimental data were expressed as the mean ± SD. Statistical differences were evaluated with Student’s t-test (Excel 2003; Microsoft Corporation, Redmond, WA, USA). Differences were considered to be statistically significant when the P-values were <0.05.
Results and discussion
Characterization of sorafenib-LNS
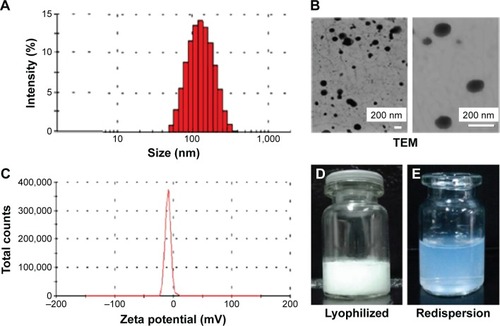
Sorafenib-LNS were prepared by nanoprecipitation, and the optimal formulation was determined (). The nanosuspensions after redispersion were pale blue and semitransparent, indicating that sorafenib-LNS were nanosized.Citation39 The DL of sorafenib-LNS (10.55%±0.16%) was high. The mean particle size and polydispersity index of the three batches of sorafenib-LNS were 164.5±4.5 nm and 0.202±0.015, respectively (), demonstrating that the production method is feasible and stable. Particles <200 nm in size can cause extravasation from microvessels and interstitial transport in tumor issue via the enhanced permeation and retention (EPR) effect.Citation40 Therefore, sorafenib-LNS with a size of 164.5 nm were suitable for tumor-targeted drug delivery. In addition, the morphology of sorafenib-LNS was visualized by TEM (). Sorafenib-LNS were well dispersed as individual nearly spherical particles. The average zeta potential for sorafenib-LNS was −11.0±0.28 mV.
Figure 2 Characterization of sorafenib-LNS.
Notes: (A) Particle size and size distribution, (B) TEM images: level of magnification of the left image is 19,000×; the right image magnification is 70,000×; (C) zeta potential, (D) photograph of lyophilized sorafenib-LNS, and (E) photograph of lyophilized sorafenib-LNS after redispersion.
Abbreviations: Sorafenib-LNS, sorafenib-loaded lipid-based nanosuspensions; TEM, transmission electron microscopy.
In vitro release studies
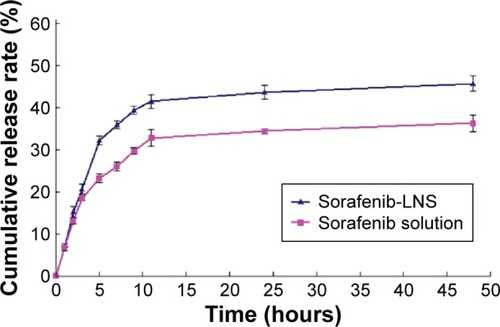
In vitro release of sorafenib-LNS was investigated by the dialysis bag diffusion technique. The amount of released sorafenib was determined by HPLC as described earlier. As shown in , the cumulative release percentage of sorafenib from sorafenib-LNS within 5 hours was ~30%, and the relatively quick release rate was caused by the large surface area-to-volume ratio of LNS. Thereafter, 45.75% of the sorafenib was released within the initial 48 hours. This sustained release could mainly result from the gradual dissolution of the lipid skeleton of the LNS.Citation41 In contrast, the cumulative release percentage of sorafenib from sorafenib solution was 34.53%, which is significantly lower than that of sorafenib-LNS, indicating the poor water solubility of sorafenib and the necessity of the effective delivery of sorafenib.
Figure 3 In vitro release profile of sorafenib in PBS (1.0% Tween-80, pH =7.4) at 37°C±0.5°C.
Note: Data are mean ± SD (n=3).
Abbreviations: PBS, phosphate-buffered saline; sorafenib-LNS, sorafenib-loaded lipid-based nanosuspensions.
Preliminary physical stability
Physical stability
The physical stability of lyophilized sorafenib-LNS was evaluated over 3 months at 4°C±2°C and 25°C±2°C. During this storage period, the appearance and particle size did not change substantially, indicating that the stability of the lyophilized product was good.
Serum stability study
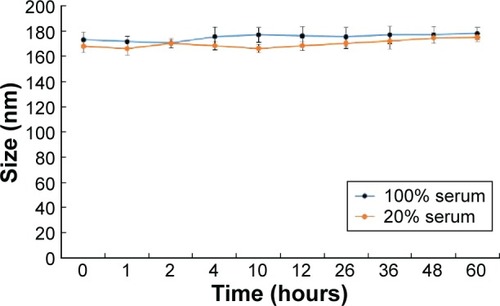
The stability of sorafenib-LNS was evaluated in serum at 37°C. As shown in , sorafenib-LNS in 20% and 100% serum underwent similar particle size and polydispersity index changes within 60 hours. Although the particle sizes changed, sorafenib-LNS were still in the desired ranges for IV injection.
Figure 4 Particle size changes of sorafenib-LNS incubated in 100% or 20% serum at 37°C for 60 hours.
Abbreviation: Sorafenib-LNS, sorafenib-loaded lipid-based nanosuspensions.
In vitro cytotoxicity assay
The in vitro cytotoxicity assay was performed on HepG2 and Bel-7402 cells by the MTT assay for 48 hours at 37°C. The cell viability for different agents is shown in , and the half-maximal inhibitory concentration (IC50) is presented in . The solvents (Cremophor EL–alcohol) showed concentration-dependent growth inhibition in both cell lines, and no cytotoxicity observed at the concentration 0.0625% (). Thus, 0.0625% Cremophor EL–ethanol (1:1, v/v) was used to dissolve sorafenib, so that the cytotoxicity of sorafenib solution was not affected by the solvent. The cellular survival rates of the blank-LNS group were >95% at the experimental dosages in these cells (), indicating the good safety and biocompatibility of blank-LNS carriers. In contrast, the cytotoxicity of sorafenib solution and sorafenib-LNS against both cell lines showed dose-dependent changes from 0.5 μM to 20 μM. There were no significant cytotoxicity differences for sorafenib solution and sorafenib-LNS against HepG2 () and Bel-7402 cells () at low concentrations (<2.5 μM), whereas sorafenib-LNS exhibited higher cytotoxicity than sorafenib solution at relative higher concentrations (P<0.01). Furthermore, the IC50 value of sorafenib-LNS was significantly lower than that of sorafenib solution () in both cell lines (P<0.01). The interaction and intracellular localization could be increased by the lipid components, contributing to the higher in vitro cytotoxicity of sorafenib-LNS.Citation42 These results suggest that LNS are a promising nanocarrier for improving the in vitro cytotoxicity of sorafenib.
Table 1 The IC50 of sorafenib solution, sorafenib-LNS, and blank-LNS for HepG2 and Bel-7402 cells after 48 hours incubation
Figure 5 Effects of different treatments on cell viabilities (percentage from untreated control) of HepG2 cells and Bel-7402 cells.
Notes: (A) Effect of concentrations of solvents (Cremophor EL–ethanol, 1:1, v/v) on cell viabilities of HepG2 and Bel-7402 cells; (B) effect of blank-LNS on cell viabilities of HepG2 cells and Bel-7402 cells; (C) effect of sorafenib solution (Cremophor EL–ethanol, 1:1, v/v, diluted in PBS) or sorafenib-LNS on cell viabilities of HepG2 cells; and (D) effect of sorafenib solution (Cremophor EL–ethanol, 1:1, v/v, diluted in PBS) or sorafenib-LNS on cell viabilities of Bel-7402 cells. Data are presented as the mean ± SD (n=3). *P<0.05 and **P<0.01.
Abbreviations: blank-LNS, blank lipid-based nanosuspensions; PBS, phosphate-buffered saline; sorafenib-LNS, sorafenib-loaded lipid-based nanosuspensions.
Time-dependent variation of sorafenib levels in tissues
The tissue distributions of free sorafenib and sorafenib-LNS were investigated in female Kunming mice following IV administration of sorafenib (9 mg/kg) via the tail vein. Sorafenib was widely distributed in most tissues following IV administration of sorafenib solution (). By contrast, the drug concentration in the livers, spleens, and lungs for sorafenib-LNS group was higher than that for the free sorafenib group (). This may be because the nanosuspensions had a relatively large mean diameter (164.5±4.48 nm). As submicron particles, LNS could be recognized as foreign bodies in the blood circulation and rapidly cleared by mononuclear phagocyte system cells, which are abundant in special tissues and organs, such as the liver, lung, and spleen.Citation43 Similar results have been reported in other studies.Citation30,Citation44,Citation45 After administration of sorafenib-LNS formulation, sorafenib was accumulated in liver to a considerable extent compared with other organs. The passive targeting of sorafenib-LNS to liver indicates the potential for an increased therapeutic effect on HCC and requires further investigation.
Figure 6 Mean tissue concentrations of sorafenib after a single IV injection in mice.
Notes: (A) Mean tissue concentrations of sorafenib after a single IV injection of sorafenib solution (Cremophor EL–ethanol, 1:1, v/v, diluted with normal saline) in mice and (B) mean tissue concentrations of sorafenib after a single IV injection of sorafenib-LNS in mice. Data are presented as the mean ± SD (n=3).
Abbreviations: IV, intravenous; sorafenib-LNS, sorafenib-loaded lipid-based nanosuspensions.
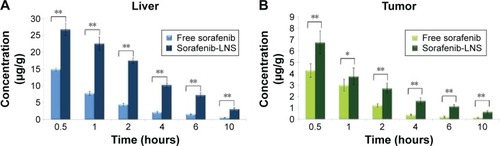
Moreover, the sorafenib-LNS group showed a substantial accumulation of sorafenib in the tumor, which was significantly larger than in the free sorafenib group ( and ). The overall targeting efficiency of LNS in the tumor was increased from 5.96% (free sorafenib) to 7.28% (1.22 times), and the relative targeting efficiency and the maximum concentrations in the tumor were 2.26 and 1.67, respectively. The tumor accumulation property was further verified in the in vivo imaging study.
Table 2 Targeting disposition of sorafenib after intravenous administration of free sorafenib and sorafenib-LNS to mice (n=3)
Figure 7 Distribution of sorafenib in liver and tumor tissues after IV administration of sorafenib or sorafenib-LNS to mice.
Notes: (A) Distribution of sorafenib in liver after IV administration of sorafenib or sorafenib-LNS to mice and (B) distribution of sorafenib in tumor tissues after IV administration of sorafenib or sorafenib-LNS to mice. Data are presented as the mean ± SD (n=3). *P<0.05; **P<0.01.
Abbreviations: IV, intravenous; sorafenib-LNS, sorafenib-loaded lipid-based nanosuspensions.
In vivo real-time imaging
To investigate the in vivo real-time biodistribution and tumor targeting properties of the LNS, the LNS were loaded with NIRF dye, DiR, and then injected into Kunming mice-bearing subcutaneous H22 tumors. Mice were imaged at the predetermined time points with NIRF imaging system. NIRF signals from the free DiR groups of mice were much lower than the signals from the DiR-LNS over the whole period (). Nonspecific biodistribution of fluorescence signals was detected for free DiR groups, and no DiR signal was observed in the tumors at the time points except at 2 hours. By contrast, after administration, the DiR-LNS began to accumulate in the tumor and showed stronger NIRF signals in the tumor. The signals were still visible at 48 hours postinjection, indicating increased accumulation of DiR-LNS in the tumor. This higher tumor targeting property of LNS may arise from the prolonged circulation of the LNS in the blood and by “passive targeting” based on the EPR effect, where the accumulation of NPs in solid tumors relies on the blood circulation and extravasation.
Figure 8 Real-time NIRF images of H22 tumor-bearing mice post-IV injection of free DiR and DiR-LNS.
Notes: At 1 hour, 2 hours, 4 hours, 6 hours, 10 hours, 24 hours, and 48 hours postadministration, mice were anesthetized with 10% chloral hydrate (IP) and then placed on their back in a light-tight chamber. The real-time NIRF images were taken using the Xenogen IVIS Lumina system with an ICG filter (excitation at 745 nm and emission at 835 nm). The tumors are circled in red.
Abbreviations: DiR, 1,1′-dioctadecyl-3,3,3′,3′-tetramethylindotricarbocyanine iodide; DiR-LNS, DiR-loaded lipid-based nanosuspensions; ICG, indocyanine green; IP, intraperitoneal; IV, intravenous; NIRF, near-infrared fluorophore.
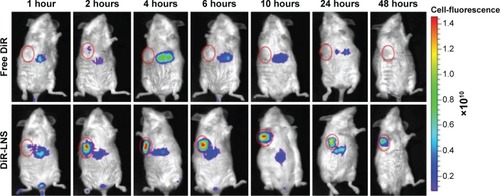
The tumor accumulation of LNS is clear in the imaging study rather than in the biodistribution study. Similar results were reported in the study of Hollis et alCitation46 and Zhao et al.Citation47 The differences between the fluorescent dye and the drug in the biodistribution indicate that using optical imaging to determine the drug distribution may be limited and misleading. This is because of the limitation of light penetration of the NIRF imaging system and the variation in the physicochemical properties of the two molecules.Citation46
In vivo antitumor efficacy study
In vivo antitumor efficacy of sorafenib-LNS on tumor growth was investigated in H22-bearing Kunming mice. illustrates the experimental procedure. The oral sorafenib dosage was twice that of the injection groups, because of the lower oral bioavailability of sorafenib. After 21 days postadministration, the average tumor volumes of mice treated with NS reached ~1,300 mm3 (). For the sorafenib-LNS formulation, the average tumor volume was <300 mm3, which was significantly smaller than that of the sorafenib solution injection group (9 mg/kg) (P<0.05) and of the sorafenib solution oral group at double dosage of sorafenib (18 mg/kg) (P<0.05). These differences were reflected in the T/C ratios of tumor volume. For sorafenib-LNS, sorafenib solution (IV), and sorafenib solution (oral), the tumor volume T/C ratios were 29.4%, 35.2%, and 51.2%, respectively. At the end of the experiment, the animals were sacrificed, and then the solid tumors were dissected, weighed, and compared. As expected, the tumors in sorafenib-LNS group were much smaller than those in the other groups (). The tumor weight in mice after treatment with sorafenib-LNS was 0.25±0.06 g, which was significantly smaller than that of the sorafenib solution oral group (P<0.01) and of the sorafenib solution injection group (P<0.01) (). Overall, these results demonstrated that sorafenib-LNS exhibited better anticancer efficacy in vivo in murine liver cancer model, which was consistent with the in vitro cytotoxicity test results. These results could be explained as follows. First, compared with the oral group, IV sorafenib-LNS retained 100% bioavailability.Citation48 Second, sorafenib-LNS accumulated in the tumor tissue through the EPR effect, maintaining the effective therapeutic concentration for a longer period of time.Citation49 This increased tumor accumulation property was supported by the biodistribution and imaging studies.
Figure 9 Antitumor efficacy of sorafenib in different formulations in H22 tumor-bearing mice (n=5).
Notes: (A) Schematic of in vivo pharmacodynamic experiments in Kunming mice implanted with H22 tumor cells; (B) time-dependent tumor growth profile of tumor-bearing mice administrated with NS, sorafenib solution (18 mg/kg, oral), sorafenib solution (9 mg/kg, IV), and sorafenib-LNS (9 mg/kg, IV); (C) excised tumor images after tumor therapy; (D) tumor weights after the administration of different formulations; and (E) body weight change after the administration of different formulations in H22 tumor-bearing mice. Data are presented as the mean ± SD (n=6). *P<0.05 and **P<0.01.
Abbreviations: IV, intravenous; NS, normal saline; sorafenib-LNS, sorafenib-loaded lipid-based nanosuspensions; sc, subcutaneous injection.
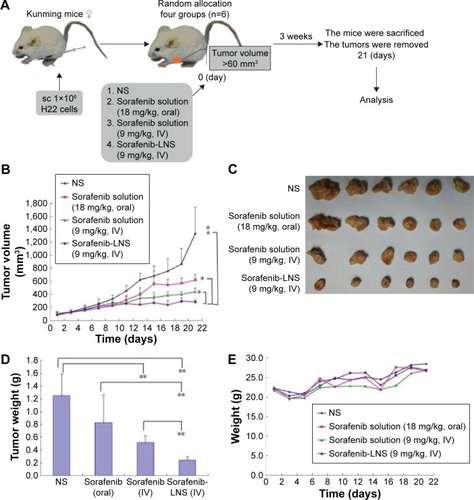
The body weight changes of the mice were monitored as an index of systemic toxicity. As shown in , body weights of the mice in sorafenib-LNS group showed a stable increase rate during the treatment, indicating the lower systemic toxicity of sorafenib-LNS.Citation50
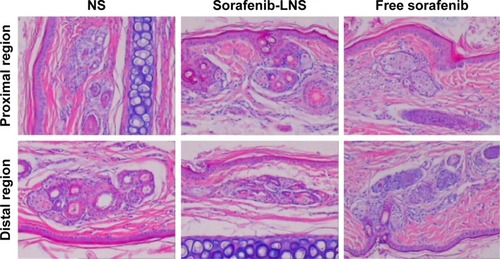
In vivo vascular irritation study
The rabbit vein irritation test was performed to evaluate the vascular irritation potential of sorafenib-LNS, with a solution of sorafenib as the reference and NS as the negative control. The histopathological examination results () showed no observable changes, such as erythrocyte aggregation and inflammatory cell infiltration, at or away from the injection site following the administration of sorafenib solution, sorafenib-LNS, or NS. In addition, none of the groups showed pathological changes, such as thrombosis, necrosis, and hemorrhage, indicating that sorafenib-LNS treatment did not cause IV irritation.
Figure 10 Photomicrographs of pathological sections of rabbit ear-rim vein after different treatments.
Notes: Two parts of the ear vein were obtained for histopathological examination, including the region 1 cm (proximal region) and 2 cm (distal region) from the pinprick. Magnification 100×.
Abbreviations: NS, normal saline; sorafenib-LNS, sorafenib-loaded lipid-based nanosuspensions.
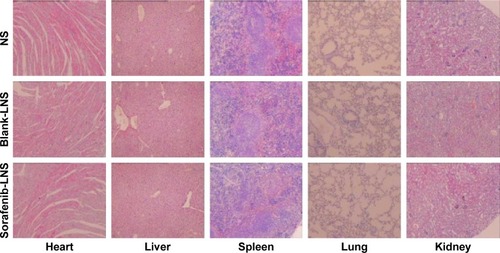
Toxicological analysis
To further confirm the safety of the formulation, histological observation of tissues exposed to blank-LNS and sorafenib-LNS was performed to determine whether or not LNS caused tissue damage, inflammation, or lesions. The cytoarchitecture of the tissue showed no obvious differences (eg, necrosis) between the LNS formulation and the placebo (). The results indicated that both the blank-LNS and sorafenib-LNS formulations showed minor toxicity.
Figure 11 Representative microscopy images of H&E-stained histological sections after treatment with NS, blank-LNS, or sorafenib-LNS.
Note: Magnification 40×.
Abbreviations: blank-LNS, blank lipid-based nanosuspensions; H&E, hematoxylin and eosin; NS, normal saline; sorafenib-LNS, sorafenib-loaded lipid-based nanosuspensions.
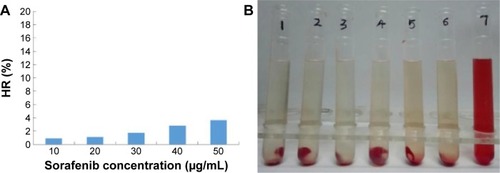
Hemolysis assay
The hemolytic activity of sorafenib-LNS was low and negligible (<5%), within a range of 10–50 μg/mL (). Generally, a hemolysis percentage of <5% is regarded as nontoxic and safe.Citation51 In addition, no hemolysis or aggregation phenomena were observed for the different concentrations of sorafenib-LNS (). These results indicated that sorafenib-LNS had good hemocompatibility under preliminary experimental conditions, and they were suitable for IV administration.
Figure 12 In vitro hemolysis assay of sorafenib-LNS.
Notes: (A) HR of the sorafenib-LNS at different sorafenib concentrations and (B) photograph of hemolysis samples for sorafenib-LNS. Sample 1: negative control (NS); Samples 2–6: five different concentrations of sorafenib-LNS from low to high; and Sample 7: positive control.
Abbreviations: HR, hemolysis ratio; NS, normal saline; sorafenib-LNS, sorafenib-loaded lipid-based nanosuspensions.
Conclusion
In this study, sorafenib-LNS were successfully prepared by nanoprecipitation and showed several attractive features as a drug delivery system, such as spherical particles, uniform size distribution, and sustained drug release. The appropriate particle size of sorafenib-LNS favored the EPR effect, and the narrow particle size distribution ensured the stability of the suspension. In the cytotoxicity activity analysis, sorafenib-LNS showed higher cytotoxicity than sorafenib solution against both HepG2 cells and Bel-7402 cells, and the superiority was further reflected in in vivo pharmacodynamic evaluation. In H22-bearing Kunming mice, sorafenib-LNS (9 mg/kg) exhibited higher antitumor efficacy than the sorafenib oral group (18 mg/kg) (P<0.05) and the sorafenib injection group (9 mg/kg) (P<0.05). In vivo imaging and biodistribution experiments demonstrated that sorafenib-LNS achieved significant accumulation in tumors. The in vivo vascular irritation study, hemolysis assay, and the normal cytoarchitecture of the tissue in the histopathological study indicated the good biocompatibility of sorafenib-LNS in vivo. These results suggest that sorafenib-LNS effectively inhibit tumor growth and provide a promising approach for IV administration of sorafenib. Moreover, the study laid the groundwork for further investigation of LNS for the co-delivery of sorafenib-based combination.
Disclosure
The authors report no conflicts of interest in this work.
Acknowledgments
This work was supported by the Science and Technology Development Project of Shandong Province (2014GSF121032) and the Independent Innovation Foundation of Shandong University (2015GN019).
References
- FornerALlovetJMBruixJHepatocellular carcinomaLancet201237998221245125522353262
- HuynhHMolecularly targeted therapy in hepatocellular carcinomaBiochem Pharmacol201080555056020371362
- BertinoGHepatocellular carcinoma: present and futureChin Clin Oncol2012111425842072
- DiFrancesco C [webpage on the Internet]FDA Approves Nexavar for Patients with Inoperable Liver Cancer2007 Available from: http://www.fda.gov/NewsEvents/Newsroom/PressAnnouncements/2007/ucm109030.htmAccessed April 14, 2016
- BensonAB3rdAbramsTABen-JosefENCCN clinical practice guidelines in oncology: hepatobiliary cancersJ Natl Compr Canc Netw20097435039119406039
- LlovetJMDi BisceglieAMBruixJDesign and endpoints of clinical trials in hepatocellular carcinomaJ Natl Cancer Inst20081001069871118477802
- LeoniSPiscagliaFSerioIAdherence to AASLD guidelines for the treatment of hepatocellular carcinoma in clinical practice: experience of the Bologna Liver Oncology GroupDig Liver Dis201446654955524630947
- LlovetJMBruixJMolecular targeted therapies in hepatocellular carcinomaHepatology20084841312132718821591
- WilhelmSCarterCLynchMDiscovery and development of sorafenib: a multikinase inhibitor for treating cancerNat Rev Drug Discov200651083584417016424
- LlovetJMRicciSMazzaferroVSorafenib in advanced hepatocellular carcinomaN Engl J Med2008359437839018650514
- ChengALKangYKChenZEfficacy and safety of sorafenib in patients in the Asia-Pacific region with advanced hepatocellular carcinoma: a phase III randomised, double-blind, placebo-controlled trialLancet Oncol2009101253419095497
- MancusoAAiroldiAViganoRPinzelloGFatal gastric bleeding during sorafenib treatment for hepatocellular carcinoma recurrence after liver transplantationDig Liver Dis201143975421641889
- ZhangZNiuBChenJThe use of lipid-coated nanodiamond to improve bioavailability and efficacy of sorafenib in resisting metastasis of gastric cancerBiomaterials201435154565457224602567
- LiuYFengLLiuTMultifunctional pH-sensitive polymeric nanoparticles for theranostics evaluated experimentally in cancerNanoscale2014663231324224500240
- Waknine Y [webpage on the Internet]FDA Approvals: Nascobal Nasal Spray, PTC 124, Tocosol Paclitaxel2005 Available from: http://www.medscape.com/viewarticle/498694Accessed January 12, 2016
- ChangEHHarfordJBEatonMANanomedicine: past, present and future – a global perspectiveBiochem Biophys Res Commun2015468351151726518648
- CaiLTShengZHAdvances in cancer nanomedicineCancer Biol Med201512314114226487958
- DuncanRGasparRNanomedicine(s) under the microscopeMol Pharm2011862101214121974749
- WickiAWitzigmannDBalasubramanianVHuwylerJNanomedicine in cancer therapy: challenges, opportunities, and clinical applicationsJ Control Release201520013815725545217
- XuXHoWZhangXBertrandNFarokhzadOCancer nanomedicine: from targeted delivery to combination therapyTrends Mol Med201521422323225656384
- BarrattGBretagneSOptimizing efficacy of Amphotericin B through nanomodificationInt J Nanomedicine20072330131318019830
- BarenholzYDoxil(R) – the first FDA-approved nano-drug: lessons learnedJ Control Release2012160211713422484195
- WangXQFanJMLiuYOZhaoBJiaZRZhangQBioavailability and pharmacokinetics of sorafenib suspension, nanoparticles and nanomatrix for oral administration to ratInt J Pharm20114191–233934621843612
- Lin TsTGaoDYLiuYCDevelopment and characterization of sorafenib-loaded PLGA nanoparticles for the systemic treatment of liver fibrosisJ Control Release2016221627026551344
- ShenJSunHMengQSimultaneous inhibition of tumor growth and angiogenesis for resistant hepatocellular carcinoma by co-delivery of sorafenib and survivin small hairpin RNAMol Pharm201411103342335124495194
- CraparoEFSardoCSerioRGalactosylated polymeric carriers for liver targeting of sorafenibInt J Pharm20144661–217218024607205
- YaoYSuZLiangYZhangNpH-Sensitive carboxymethyl chitosan-modified cationic liposomes for sorafenib and siRNA co-deliveryInt J Nanomedicine2015106185619726491291
- DanhierFUcakarBVanderhaegenMLBrewsterMEArienTPreatVNanosuspension for the delivery of a poorly soluble anti-cancer kinase inhibitorEur J Pharm Biopharm201488125226024859391
- WangLLiuZLiuDLiuCJuanZZhangNDocetaxel-loaded-lipid-based-nanosuspensions (DTX-LNS): preparation, pharmacokinetics, tissue distribution and antitumor activityInt J Pharm20114131–219420121540085
- ZhangJLiMLiuZWangLLiuYZhangNPreclinical studies of N(3)-O-toluyl-fluorouracil-loaded lipid-based nanosuspensions in H(2)(2)-bearing miceInt J Nanomedicine201492741275124920908
- YuWLiuCLiuYZhangNXuWMannan-modified solid lipid nanoparticles for targeted gene delivery to alveolar macrophagesPharm Res20102781584159620422265
- SuZLiangYYaoYPolymeric complex micelles based on the double-hydrazone linkage and dual drug-loading strategy for pH-sensitive docetaxel deliveryJ Mater Chem B2016411221133
- WangLLiMZhangNFolate-targeted docetaxel-lipid-based-nanosuspensions for active-targeted cancer therapyInt J Nanomedicine201273281329422802688
- WangMLiuTHanLGaoWYangSZhangNFunctionalized O-carboxymethyl-chitosan/polyethylenimine based novel dual pH-responsive nanocarriers for controlled co-delivery of DOX and genesPolym Chem201561733243335
- YangCLiuSQVenkataramanSStructure-directing star-shaped block copolymers: supramolecular vesicles for the delivery of anticancer drugsJ Control Release20152089310525813888
- AttiaABYangCTanJPThe effect of kinetic stability on biodistribution and anti-tumor efficacy of drug-loaded biodegradable polymeric micellesBiomaterials201334123132314023380357
- BotellaPAbasoloIFernandezYSurface-modified silica nanoparticles for tumor-targeted delivery of camptothecin and its biological evaluationJ Control Release2011156224625721756949
- ZarrabiAVossoughiMPaclitaxel/β-CD-g-PG inclusion complex: an insight into complexation thermodynamics and guest solubilityJ Mol Liq2015208145150
- AliHSMYorkPAliAMABlagdenNHydrocortisone nanosuspensions for ophthalmic delivery: a comparative study between microfluidic nanoprecipitation and wet millingJ Control Release2011149217518120946923
- LiuFLiMLiuCTumor-specific delivery and therapy by double-targeted DTX-CMCS-PEG-NGR conjugatesPharm Res201431247548824043295
- ZhangHZhangFMYanSJPreparation, in vitro release, and pharmacokinetics in rabbits of lyophilized injection of sorafenib solid lipid nanoparticlesInt J Nanomedicine201272901291022787390
- RewatkarPVPartonRGParekhHSParatMOAre caveolae a cellular entry route for non-viral therapeutic delivery systems?Adv Drug Deliv Rev2015919210825579057
- GaoLZhangDChenMStudies on pharmacokinetics and tissue distribution of oridonin nanosuspensionsInt J Pharm20083551–232132718242896
- PetersKLeitzkeSDiederichsJEPreparation of a clofazimine nanosuspension for intravenous use and evaluation of its therapeutic efficacy in murine Mycobacterium avium infectionJ Antimicrob Chemother2000451778310629016
- WangLLiMZhangNFolate-targeted docetaxel-lipid-based-nanosuspensions for active-targeted cancer therapyInt J Pharm2012732813293
- HollisCPWeissHLLeggasMEversBMGemeinhartRALiTBiodistribution and bioimaging studies of hybrid paclitaxel nanocrystals: lessons learned of the EPR effect and image-guided drug deliveryJ Control Release20131721122123920039
- ZhaoRHollisCPZhangHSunLGemeinhartRALiTHybrid nanocrystals: achieving concurrent therapeutic and bioimaging functionalities toward solid tumorsMol Pharm2011851985199121812439
- BankerGSSiepmannJRhodesCModern PharmaceuticsBoca RatonMarcel Dekker Press2002
- TorchilinVTumor delivery of macromolecular drugs based on the EPR effectAdv Drug Deliv Rev201163313113520304019
- FengLXLiMLiuYJYangSMZhangNSynergistic enhancement of cancer therapy using a combination of ceramide and docetaxelInt J Mol Sci20141534201422024619193
- XiaoYLiuYYangSSorafenib and gadolinium co-loaded liposomes for drug delivery and MRI-guided HCC treatmentColloid Surf B20161418392