
 ?Mathematical formulae have been encoded as MathML and are displayed in this HTML version using MathJax in order to improve their display. Uncheck the box to turn MathJax off. This feature requires Javascript. Click on a formula to zoom.
Abstract
The objective of this work was to prepare an oil/water glimepiride (GM) microemulsion (ME) for oral administration to improve its solubility and enhance its bioavailability. Based on a solubility study, pseudoternary phase diagrams, and Box–Behnken design, the oil/water GMME formulation was optimized and prepared. GMME was characterized by dynamic laser light scattering, zeta potential, transmission electron microscopy, and viscosity. The in vitro drug release, storage stability, pharmacodynamics, and pharmacokinetics of GMME were investigated. The optimized GMME was composed of Capryol 90 (oil), Cremophor RH40 (surfactant), and Transcutol (cosurfactant), and increased GM solubility up to 544.6±4.91 µg/mL. The GMME was spherical in shape. The particle size and its polydispersity index were 38.9±17.46 nm and 0.266±0.057, respectively. Meanwhile, the GMME was physicochemically stable at 4°C for at least 3 months. The short-term efficacy in diabetic mice provided the proof that blood glucose had a consistent and significant reduction at a dose of 375 µg/kg whether via IP injection or IG administration of GMME. Compared with the glimepiride suspensions or glimepiride-meglumine complex solution, the pharmacokinetics of GMME in Wistar rats via IG administration exhibited higher plasma drug concentration, larger area under the curve, and more enhanced oral bioavailability. There was a good correlation of GMME between the in vitro release values and the in vivo oral absorption. ME could be an effective oral drug delivery system to improve bioavailability of GM.
Introduction
Diabetes is a metabolic disease with hyperglycemia, and oral antidiabetic drugs are rapidly being developed to meet the needs of patients.Citation1–Citation3 Glimepiride (GM), a third-generation sulfonylurea drug, is effective for the treatment of type 2 diabetes mellitus and acts by stimulating pancreatic β-cells to produce more insulin and lower the blood glucose level (BGL).Citation4,Citation5 GM has shown several advantages such as being highly protein bound and long acting and allowing for concomitant use with insulin. However, the drawback for the use of GM as oral dosage forms is attributable to its low aqueous solubility (1.6 µg/mL) and slow dissolution rate, which lead to low oral bioavailability.Citation6,Citation7 Hence many studies have tried to enhance its solubility, and several reports including those where nanocrystals,Citation8 cosolvency,Citation9 spray congealing,Citation10 solid self-nanoemulsify,Citation11 solid dispersions,Citation12 micelles,Citation13 and inclusion complexationCitation14,Citation15 were used have been published. These techniques have acquired limited success.Citation16–Citation18
Microemulsion (ME) has recently attracted much attention in pharmaceutical research because of its simplicity of manufacturing, spontaneous formation, solubilization capacity of lipophilic solutes, and improved bioavailability of hydrophobic drugs.Citation19,Citation20 This system could be composed of oil, surfactant, cosurfactant, and aqueous phase and has been used as drug delivery vehicles for oral, transdermal, topical, nasal, intravenous, and other administration routes.Citation20–Citation23 For example, it has been reported that docetaxel ME could improve oral bioavailability and area under the curve (AUC) of the drug in rats, and a five-times larger bioavailability/AUC was obtained than that of orally administrated Taxotere®.Citation24
An attempt has thus been made to design, develop, and characterize a novel oil/water ME system of GM that may improve its oral bioavailability. Glimepiride microemulsion (GMME) was prepared according to pseudoternary phase diagrams and Box–Behnken design and characterized by zeta potential, viscosity, DLS, and transmission electron microscopy (TEM). The in vitro drug release and storage stability of GMME was evaluated. The BGL fluctuation of diabetic mice after administrated GMME was studied. Moreover, compared with the GM suspensions or glimepiride-meglumine (GM-MU) complex solution, the pharmacokinetics of GMME were also assessed. The potential in vitro–in vivo correlation between the in vitro release values and the oral absorption pharmacokinetics was studied.
Materials and methods
Materials
GM was purchased from Kangbaotai Chemical Co., Ltd. (Hubei, People’s Republic of China). Labrafil M 1944 CS, Capryol 90, Lauroglycol 90, and Maisine 35-1, Plurol Oleique CC497 were received as gifts from Gattefossé Co. (Saint Priest, Cedex, France), while Labrasol and Transcutol were purchased from the same company. Cremophor EL and Cremophor RH40 were obtained from BASF Co. (Ludwigshafen, Germany). Oleic acid, Tween 80, Propylene glycol (PG), and PEG 400 were purchased from Sinopharm Group Co., Ltd. (Shanghai, People’s Republic of China). Alloxan was obtained from Sigma Chemical Co. (St Louis, MO, USA). Meglumine was purchased from Suzhou Jingye Medicine and Chemical Co., Ltd (Suzhou, People’s Republic of China). Methanol was HPLC grade and supplied by Kermel Chemical Co., Ltd. (Tianjin, People’s Republic of China). Double-distilled water was used throughout the study. All other chemicals were of analytical grade.
Preparation of ME
To find out appropriate components for the ME, the solubility of GM in various vehicles was measured. An excess of GM was mixed with 2 mL each of oil phase, surfactant and cosurfactant and was then shaken at 37°C for 72 hours. After the suspension was centrifuged for 10 minutes at 10,000 rpm, the supernatant was filtered through a membrane filter (0.45 µm) and the drug concentration was determined by HPLC after appropriate dilution with methanol. A Hypersil BDS C18 column (Thermo Fisher Scientific, Waltham, MA, USA) (4.6×250 mm, 5 µm) and UV detector (λ=227 nm) was used for the HPLC analysis. The mobile phase (CH3OH: 0.025 mol/L NH4H2PO4 =75:25, v/v) was delivered at a flow rate of 1 mL/min.
Pseudoternary phase diagrams were constructed using water titration method. Surfactant and cosurfactant with specific weight ratios (Km) of 1:1, 1:2, 2:1, 5:2, and 3:1 were vortexed vigorously to make the surfactant mixture (Sm). The oil phase was mixed with the Sm at a ratio of 9:1, 8:2, 7:3, 6:4, 5:5, 4:6, 3:7, 2:8, and 1:9 (w/w), then water was added drop by drop under magnetic stirring to obtain a clear and transparent ME.
Based on the results of pseudoternary phase diagrams, GMME with oil, Sm, and water at different ratios was prepared. The excess amount of GM was dissolved into the oil and Sm, the required quantity of water was added, and incubated with shaking at 37°C for 72 hours. Excess GM was removed by centrifugation at 10,000 rpm for 10 minutes, and then the concentration of GM in the MEs was determined by HPLC after appropriate dilution with methanol. The formulation that showed high solubility of GM was finally selected for further investigation.
A three-factor, three-level Box–Behnken design was applied to optimize the formulation factors and evaluate main effects on the solubility of GM in the ME. The 17 experiments involving three factorial points and five replicates at the center points were designed with the Design Expert (Version 8.0, Stat-Ease Inc., Minneapolis, MN, USA). The proportion of oil (X1), Sm (X2), and water (X3) was identified as key factors responsible for the content of GM in the ME. The independent variables were selected according to the results from pseudoternary phase diagrams. The respective responses were observed, and a second-order polynomial equation was given by Design Expert software. In this study, the nonlinear quadratic model shown in EquationEquation 1(1) was used:
Optimal conditions and the maximum predicted solubility of GM in ME were obtained by Box–Behnken design. The practical experimental values achieved under the optimal conditions were quantitatively compared with the predicted values to confirm the validity of model. The optimal GMME that showed high solubility of GM was used in the later experiments.
Preparation of GM-MU complex
GM-MU complex was prepared according to the method described in literature.Citation26 Briefly, the mixture of GM and meglumine (1:3, w/w) was dissolved in 5 mL distilled water at 80°C in a water bath until the mixture was completely dissolved. The solution was lyophilized by using a freeze dryer (FD-1A-50, Beijing Boyikang Laboratory Instruments Co., Ltd, Beijing, People’s Republic of China) until the GM-MU complex powder was obtained.
Characterization of ME
The droplet size and zeta potential of optimized ME or GMME were determined in triplicate using DLS (Malvern Instruments Ltd., Zeta sizer 2000, Worcestershire, UK). The MEs were placed on carbon-coated 400 mesh copper grids and negatively stained with 2% phosphotungstic acid. Then, the morphology of ME and GMME was investigated using TEM (JEM-100 C, JEOL Ltd, Tokyo, Japan) after the grids were dried at room temperature. The viscosity of the system was measured with a NDJ-5S rotary viscosity meter (Shanghai Precision & Scientific Instrument Co. Ltd, Shanghai, People’s Republic of China). The speed of the spindle CPE-4 was adjusted to 30 rpm and a single run was performed at 20°C±0.5°C. To study the stability of GMME, the resulting ME was tightly sealed and stored at 4°C for 3 months. The occurrence of phase separation or precipitation was periodically observed, and the drug content in the ME was determined once a month.
In vitro drug release from ME
The in vitro release of GM from the ME was conducted by dialysis method in pH 7.4 saline solution at 37°C. An aliquot of each GMME was placed into dialysis bags and dialyzed against the release media at 37°C±0.2°C in an air bath shaker at 100 rpm. At predetermined time intervals, the release medium was collected and fresh release media added. The concentration of GM was determined by HPLC. The accumulative release percentage (Q%) of GM released from the ME was calculated by the following EquationEquation 2(2) .
Pharmacodynamic study
Adult male (22–24 g) and female (18–22 g) ICR mice were made diabetic by tail vein injection of alloxan saline solution at a dose of 90 mg/kg body weight of the animals. The control group was treated with single IV dose of normal saline. All animals were allowed to stabilize for 7 days and fed with normal diet and water. Mice were considered diabetic when BGL exceed 16.7 mmol/L, and these mice were used in the study. Diabetic mice were carefully observed for symptoms, and changes in body weight and food intake were monitored. Throughout the study, mice had free access to water and food as per Institutional guidelines. All animal experiments were performed according to project license approved by Institutional Authority for Laboratory Animal Care and Use of Hebei University. The housing and food conditions of the animals used followed a guideline from the same institutional review board.
Pharmacodynamic study was carried out in diabetic mice which were randomly divided into five groups with three male and three female mice per group. Groups I, II, and III were administered GMME by intraperitoneal (IP) at the dose of 750, 375, and 200 µg/kg respectively, whereas groups IV and V were given GMME by (IG) administration at the dose of 375 and 200 µg/kg, respectively. Blood was withdrawn from tail vein at 0, 1, 1.5, 2, 3, 4, 6, 8, 12, and 24 hours in all the groups, and BGL estimated using the FreeStyle Glucometer (Abbott Diabetes Care Inc, Alameda, CA, USA).
Pharmacokinetic study
The pharmacokinetic study was carried out in healthy female Wistar rats weighing between 200 and 250 g that were administered GM at a dose of 5 mg/kg body weight. Before the experiment, the rats were fasted overnight for 12 hours with access to water ad libitum, and no change was made in their natural homeostasis. Animals were randomly divided into three groups, each with six rats, and then were administered the GM suspensions, GM-MU complex solution, and GMME, respectively, via the IG route. All animal experiments were performed according to project license approved by Institutional Authority for Laboratory Animal Care and Use of Hebei University. The blood samples were collected with heparinized tubes at selected times (t=0.167, 0.33, 0.66, 1, 1.5, 2, 3, 4, 6, 8, 12, 24, 36, and 48 hours) and centrifuged at 4,000 rpm for 15 minutes to separate the plasma. The plasma (200 µL) was acidized by adding 1.0 mol/L hydrochloric acid for 10 minutes and then homogenized and extracted with 1.2 mL acetonitrile–dichloromethane (5:1, v/v) on a vortex mixer for 2 minutes. After centrifugation at 10,000 rpm for 10 minutes, the organic layer was transferred and evaporated under nitrogen gas flow at 50°C. The residue was redissolved with 50 µL of anhydrous methanol and mixed for 5 minutes. The solution was centrifuged for 5 minutes at 10,000 rpm, and 20 µL of the supernatant was injected into the HPLC system for analysis. The pH of the mobile phase was adjusted to 3.52. The main pharmacokinetic parameters were calculated.
Statistical analysis
All data were expressed as a mean ± SD. Statistical analysis was performed using the Student’s t-test, and P<0.05 was considered as statistically significant.
Results and discussions
Solubility study
In this study, oil phase was selected according to the drug’s solubility, while the surfactant and cosurfactant were selected according to their microemulsification efficiency and solubility in oil phase. The drug solubility in the oil phase highly influenced the capability of the ME to retain drug. Furthermore, low drug solubility in oil led to the addition of a larger amount of oil so as to attain desired therapeutic doses. To maintain the miscibility when higher amount of oil is used, a higher amount of Sm should be added. Consequently, the toxicity and side effects might increase.Citation27 Therefore, the oil phase selected should mainly be based on the drug solubility in the oil phase. The solubility of GM in various oils, surfactants, and cosurfactants was analyzed, and the results are shown in . GM showed the highest solubility in Capryol 90 (1,614.90±12.87 µg/mL) among six kinds of oils, and this value was at least two-fold larger than that of other oils. It was also reported that Capryol 90 (as a good oil phase) was used in docetaxel or curcumin ME to enhance their bioavailability.Citation24,Citation28 Thus, Capryol 90 was selected as the oil phase for the development of GM ME formulation.
Table 1 Solubility of GM in various mediums (mean ± SD, n=3)
Pseudoternary phase diagram study
Pseudoternary diagrams were utilized for describing the compositional phase behavior and formulating thermodynamically stable MEs. Nonionic surfactant is safe, biocompatible, and nonirritating, and it is less affected by ionic strength and pH. Therefore, different nonionic surfactants, namely, Cremophor EL, Cremophor RH40, Tween 80, and Labrasol were chosen for screening. Moreover, Transcutol, PG, PEG-400, and ethanol were used as cosurfactants. Because of volatile characteristics of ethanol, its application was limited as a cosurfactant. A total of twelve phase diagrams were constructed by pairing four surfactants and three cosurfactants at a 1:1 (w/w) ratio in the preliminary experiment. Only Cremophor EL/Transcutol or Cremophor RH40/Transcuto could form a stable ME. Therefore, it was considered that the ideal ME might be composed of Capryol 90, Cremophor EL/or Cremophor RH40, and Transcutol, but this needs to be further investigated.
The pseudoternary phase diagrams with various weight ratios (Km) of Cremophor RH40 or Cremophor EL to Transcutol are shown in . From , it can be seen that the area of ME decreased as the ratio of cosurfactant increased. Thus, for the following experiments Cremophor EL and Transcutol were used at weight ratios fixed at 5:2 and 2:1, and then two phase diagrams were constructed ().
Figure 1 Pseudoternary phase diagrams of Capryol 90, Cremophor RH40/Transcutol (A–E) or Cremophor EL/Transcutol (F, G) and distilled water.
Note: The oil/water microemulsion should be prepared in the ratios given in the shaded area.
Abbreviation: Sm, surfactant mixture.

Based on the results shown in , five formulations were chosen for further studies. The transparent GMME could be spontaneously formed by gentle agitation following aqueous dilution. As shown in , the higher amount of oil used led to increased drug content in MEs, and there were no significant differences in the drug concentration when using Cremophor RH40 or Cremophor EL as surfactant. However, there was a big difference in the drug solubility capacity between the two kinds of surfactants (see ). The surfactant was selected mainly because of its solubility capacity for oil, and the good solubility capacity for drug was not related to its good affinity for the oil phase.Citation27 The solubility of GM was higher in Cremophor RH40 than in Cremophor EL, which might be the main reason that the solubility of GM in F-2 was greater than that in F-4 and F-5 (see ). Among the five ME formulations, F-2 had the highest solubilization capacity, and Cremophor RH40 as a surfactant used in F-2 led to improve drug solubility. Therefore, the phase diagram containing Capryol 90 as an oil, Cremophor RH40 as a surfactant, and Transcutol as a cosurfactant (Km =5:2) was selected for further optimization.
Formulation optimization by Box–Behnken statistical design
Box–Behnken design is a simple statistical tool to screen the important variables among several variables in the medium. A three-factor, three-level Box–Behnken statistical experimental design was used to optimize the formulation variables. The independent variables and the responses for all 17 experiments are given in and . The contour plots and 3D response surface plots were drawn using Design Expert software and are shown in . Based on the results of the pseudoternary phase diagrams, appropriate ranges of the components were chosen. The oil phase content of the formed ME was found to be 9%–29%. Previous reports revealed that Capryol 90 had low-to-medium HLB (4–5) and could be used in self-emulsifying lipidic formulations, and it had comprehensive regulatory, toxicity, and handling dossiers (including Type IV DMF).Citation24,Citation29 The water content was determined to be between 46% and 70%. The Sm formed clear ME with large area was found to be 15%–31%. Design Expert software was used to optimize the formulation and develop the mathematical (quadratic) equations shown in EquationEquations 1(1) and Equation3
(3) . In our experiments, ( and ) the drug concentration in F-8 was up to 541.3 µg/mL, which was the highest among the other formulations.
Table 2 Observed responses in the Box-Behnken design for microemulsions
Table 3 Variables in the Box-Behnken design
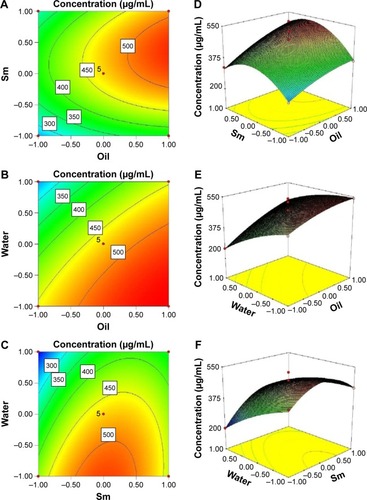
Figure 2 Contour plot and corresponding response surface plot showing effect of oil, Sm, and water on the concentration of GM in ME.
Note: The effects of oil, Sm and water on the concentration of GM in ME showed in (A–C) were similar to those in (D–F).
Abbreviations: Sm, surfactant mixture; GM, glimepiride; ME, microemulsions.
The responses observed in the 17 formulations were fit to quadratic models according to software calculations, and the quadratic polynomial of the response is shown in EquationEquation 3(3) .
The correlation coefficient (R2), adjusted coefficient (Radj2), and predicted coefficient (Rpred2) of the quadratic model were 0.9693, 0.9297, and 0.9089, respectively. A high degree of correlation between the observed and predicted values was observed. Meanwhile, the low variation coefficient (CV, 6.31%) clearly indicated a high degree of precision and reliability of the experimental values.
Statistical testing of the model was performed by ANOVA using Design Expert software, which was required to test the significance and adequacy of the model. The model F-value was significant (P<0.05), and the model was found to be adequate for prediction within the range of experimental variables. The coefficients (X1, X2, X3) and quadratic term coefficient (X22) were highly significant (P<0.01); moreover, the interaction term coefficient (X2X3) was significant (P<0.05). The other term coefficients (X1X2, X1X3, X12, X32 had no significant influence (P>0.05) on response.
As shown in , the contour plots and three-dimensional response surface plots were drawn to evaluate the effects of the independent variables and select the optimal formulation. Each demonstrated the effect of two factors while the third factor was fixed at zero level. From , it can be seen that the concentration of GM rapidly increased when the ratio of the Sm in formula was increased from 15% to 24%, but beyond 24%, increasing Sm led to drug concentration decreasing. From , it can be observed that the maximum concentration of GM could be obtained when oil and water were mixed at a ratio of 29% and 46%, respectively. From , it can be seen that the concentration of GM was decreasing with the water weight increasing; the ideal weight ratio of Sm in formulations was 15%–24%. The model-predicted optimal values (coded) of the three most significant variables were X1=1, X2=0.17 and X3=−0.86. Correspondingly, the values of oil, Sm, and water were 29%, 24%, and 47%, respectively. The maximum predicted concentration of GM was 544.4 µg/mL. To confirm the optimized conditions, three additional experiments were performed using the predicted conditions. The mean value of GM content was 544.6±4.91 µg/mL, which was significantly improved compared to that in aqueous solution (1.6 µg/mL) and agreed well with the predicted value. This result demonstrated the validity of the response model.
Characterization of ME
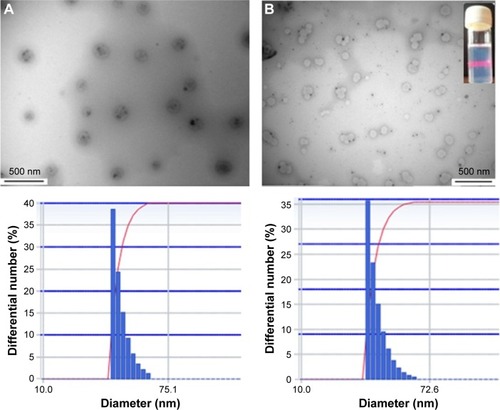
MEs exhibited opalescence, and Tyndall phenomenon was clearly observed; it also appeared sky-blue opalescent as substantially diluted with water (). The morphologies of ME and GMME in the transmission electron microscope photographs are shown in . The ME and GMME were nearly spherical in shape. Particle size distribution is one of the important parameters that affect the in vivo fate of a ME and define the rate of drug release.Citation30 A smaller ME droplet size leads to a larger surface area available for the drug absorption. The average size of optimal GMME was 38.9±17.46 nm, and the polydispersity index value was 0.266±0.057. The prepared ME with a droplet size typically less than 100 nm would enhance solubility and dissolution rate, increase mucosal permeability, and guarantee efficient absorption of drug.Citation31,Citation32 Moreover, the zeta potential of GMME in distilled water was 0.60±1.33 mV. It was observed that there were no significant differences in size and zeta potential between GMME and ME (). The ME state was maintained by a delicate balance between the oil, surfactant, and aqueous phase. Thus, the size and zeta potential of the ME droplet were slightly changed by dilution. Rotary viscosity of the blank MEs and GMME was 257.8±5.1 and 351.5±6.9 mPa⋅s, respectively.
Table 4 Size, PDI and zeta potential of ME and GMME (mean ± SD, n=3)
Figure 3 The TEM images and the particle size distribution of ME (A) and GMME (B).
Abbreviations: TEM, transmission electron microscopy; ME, microemulsion; GMME, glimepiride microemulsion.
The GMME was tightly sealed and stored at 4°C for 3 months to investigate its stability. Previous studies have shown that the stability of ME was affected by the charge, size, surface characteristics, and chemical composition of the ME.Citation33,Citation34 Our formulation showed no precipitation and crystallization during the 3 months of storage. Moreover, there was almost no change in the value of drug content in GMME.
In vitro drug release from ME
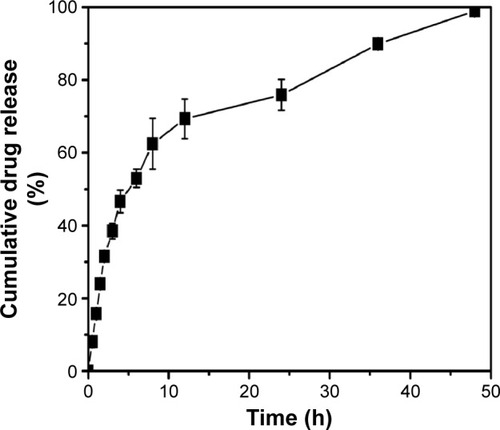
The in vitro release behavior of GM from ME is shown in . The drug released from MEs was about 70% within 12 hours, increasing to 99% at 48 hours. Compared with the literatureCitation26 reported about the GM release profiles in pH 7.4 PBS, there was no initial burst release. Greater release of GM from ME formulations may be attributed to the small spherical size, which increases the surface area for dissolution.
Figure 4 Release profile of glimepiride from microemulsions determined by the dialysis method in a pH 7.4 saline solution at 37°C (mean ± SD, n=3).
Abbreviations: SD, standard deviation; h, hours.
Pharmacodynamic study
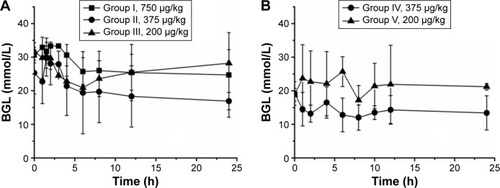
The optimized GMME consisting of 29% Capryol 90, 17% Cremophor RH40, 7% Transcutol, and 47% water (w/w) was prepared and used for in vivo evaluation. shows the BGL curves obtained from diabetic mice after administration of GMME via IP (see ) or IG (see ) routes at different doses. As shown in , there were significant differences in the BGL curves of the five diabetic mice groups that were administered different doses via different administration routes. The higher concentration of the GM was related to the greater viscosity of the GMME – group I administered 750 µg/kg by IP did not show the best BGL curve because the viscosity might prevent the drug from rapid release within 24 hours. Moreover, the absorption of GM within 2 hours was faster on IP administration than by IG administration. Also, diabetic mice groups administered 200 µg/kg (whether by IP or IG) did not show ideal BGL curve within 24 hours, but GMME IG at 375 µg/kg caused a continuous reduction in BGL, which decreased BGL at least 14.2%–37.5%. All these results demonstrated that GMME had the potential to control hyperglycemia whether administered IP or IG
Figure 5 BGL of diabetic mice following IP (A) and IG (B) administration of different doses of GMME (mean ± SD, n=6).
Abbreviations: BGL, blood glucose level; GMME, glimepiride microemulsion; SD, standard deviation; h, hours.
Pharmacokinetic study
Pharmacokinetic study was carried out in healthy female Wistar rats. shows the plasma concentration–time curves of GM after IG administration of the GM suspensions, GM-MU complex solution, and GMME at a dose of 5 mg/kg respectively. The three concentration–time curves were fit with the two-compartment model, and the corresponding PK parameters are summarized in .
Table 5 PK parameters after IG administration of the GM suspensions, GM-MU complex solution and GMME at a dose of 5 mg/kg (n=6)
Figure 6 Plasma concentration–time curves after IG administration of the GM suspensions (-▪-), GM-MU complex solution (-•-) and GMME (-▴-) at a dose of 5 mg/kg in rats (n=6).
Abbreviations: GM, glimepiride; GM-MU, glimepiride-meglumine; GMME, glimepiride microemulsion; h, hours.
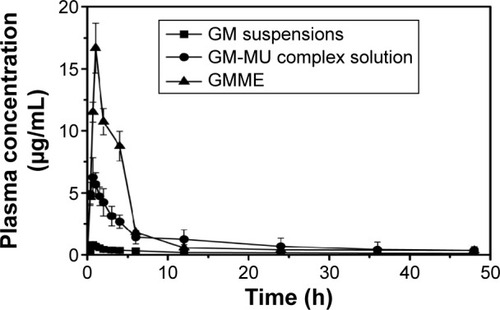
From the pharmacokinetic study of Wistar rats, it was found that GMME demonstrated a higher Cmax (14.84 µg/mL, 17.06 times), a larger AUC0→48 h (6,242.76 µg⋅min/mL, 7.28 times), and a longer t1/2 (4,687.8 minutes, 2.77 times) compared with the control group of GM suspensions, whereas the clearance and volume of distribution of GM was decreased 0.0008 L/kg/min, 7.25 times, in rats. GMME was well absorbed, reaching maximum plasma concentration within 74.6 minutes, whereas it appeared somewhat earlier (37.6 or 36.3 minutes) in GM suspensions or GM-MU complex solution. There was no significant difference in Tmax between GM suspensions and GM-MU complex solution. Moreover, it was evident that the AUC-values for GM-MU complex solution and GMME were higher than the corresponding values of GM suspensions (). The AUC0→48 h value of GMME was approximately 1.84-fold of the GM-MU complex solution, indicating an enhancement of GM’s bioavailability when given orally. Therefore, formulating insoluble GM as GMME had a significant effect on the drug solubility and bioavailability, which guarantee steady therapeutic effect and low side effect.
Based on the Biopharmaceutics Classification System, drug substances are classified into four categories according to their solubility and permeability properties. For the drugs of Biopharmaceutics Classification System Class II, the rate-limiting process of absorption is the drug dissolution step.Citation35 Therefore, even though such compounds have powerful pharmacological activity, the expected clinical efficacy is sometimes not experienced.Citation36 Dosage forms play a major role in determining the rate and extent of absorption of such drugs from the gastrointestinal tract.Citation37 GM exhibits very poor solubility at 37°C (<0.004 mg/mL) in acidic and neutral media and has relatively high permeability (30.4×106 cm/s) in Caco-2 cell monolayers. Thus, GM is categorized as a Class II drug by the Biopharmaceutics Classification System.Citation38,Citation39 Therefore, choosing appropriate pharmaceutical techniques to increase GM’s solubility plays a key role in improving its bioavailability. However, recent studies have shown that enhanced apparent solubility, which is because of micellarization or complexation, does not induce an enhanced permeation rate of a poorly soluble drug in vitro.Citation26,Citation40–Citation44 The solubility–permeability interplay cannot be ignored when using solubility-enabling formulations.Citation45,Citation46 As mentioned earlier, we can draw a conclusion that increasing drug solubility utilizing pharmaceutical techniques does not necessarily lead to improved bioavailability.
In a recent study, we reported that meglumine as a hydrotrope could form a stable complex with GM, thus improving the solubility/bioavailability of GM.Citation26 Because meglumine exhibited extensive H-bonding with all possible H-bond acceptors in the GM molecule, this extensive H-bonding between the two species appears to regulate the mobility of GM molecules in amorphous systems. Unlike other solubilization techniques, it has been shown that using the amorphous form allows to increase both molecularly solubility and drug flux through the membrane. That is, the amorphous state of GM played a significant role in enhancing the solubility/absorption. This result is consistent with the previous literature.Citation43,Citation44 Compared to GM solubility in water (1.6 µg/mL), the solubility of an optimized GMME formulation increased up to 340 times (544.6±4.91 µg/mL). Meanwhile, a noticeable enhancement in GM dissolution was observed in the GM-MU complex – the solubility of GM was found to increase up to 24,000 times.Citation26 It is interesting that the hydrotropy technique improves GM solubility much better than the ME technique, whereas the AUC of GMME is superior to that of GM-MU complex solution. The enhanced bioavailability of GMME was probably attributed to the following effects: first, the solubility of GM in GMME was significantly improved. The higher solubility would increase the drug permeation rate in the intestinal cell. Meanwhile, the nanoscale particles and larger surface area of GMME played a key role in increasing drug release.Citation47 The GMME drops were entrapped easily by many duodenum and jejunum villi. Therefore, the enhanced bioavailability is attributed to direct uptake of dispersed nanoparticles through the gastrointestinal tract. The oil/water ME was efficiently absorbed by lymphoid system of intestine, and the drug of ME could bypass the liver first-pass metabolism.Citation48–Citation50 Moreover, GM-loaded ME prevented its rapid clearance from systemic circulation and provided protection against physicochemical and enzymatic degradation.Citation23,Citation32 Second, the synergistic effect of oil phase and surfactants in the ME could increase cell membrane fluidity and open the tight junctions between cells to enhance the drug absorption.Citation24,Citation51 As already mentioned, the largest AUC among three pharmaceutical techniques was obtained in GMME, mostly due to its unique absorption pathway. Therefore, it is very important to choose an appropriate technique that will improve drug solubility and bioavailability.
In vitro–in vivo correlation
For investigation of in vitro–in vivo correlation of GMME, the accumulative AUC in vivo (y, µg⋅min/mL) was plotted versus the accumulative release amount in vitro (x, µg) at the same time. Based on the regression analysis, the quadratic polynomial equation is shown in EquationEquation 4(4) . The correlation coefficient (R2) was 0.9815, indicating a close correlation between the in vitro release and in vivo absorption of the drug.
Conclusion
The optimized oil/water ME formulation containing Capryol 90, Cremophor RH40, and Transcutol significantly enhanced the solubility of GM up to 544.6±4.91 µg/mL. Additionally, the pharmacokinetic and pharmacodynamic studies in vivo showed that GMME improved the bioavailability of GM and controlled the GBL in diabetic mice. Thus, the developed ME may be an effective vehicle for oral administration of GM.
Disclosure
The authors report no conflicts of interest in this work.
Acknowledgments
This work was supported by Science and Technology Research Projects in Colleges and Universities of Hebei Province (ZD2016102), the Science and Technology Planning Project of Hebei Province (Number 13272705) and the Enhance Comprehensive Strength Special Funds in the Midwest, People’s Republic of China.
References
- NathanDMBuseJBDavidsonMBMedical management of hyperglycemia in type 2 diabetes: a consensus algorithm for the initiation and adjustment of therapyDiabetes Care20093219320318945920
- SheleshJSwarnlataSType 2 diabetes mellitus-its global prevalence and therapeutic strategiesDiabetes Metab Syndr201044856
- XuYWangLMHeJPrevalence and control of diabetes in Chinese adultsJAMA201331094895924002281
- LiuFYWangYJYanMZhangLYPangTLiaoHGlimepiride attenuates Aβ production via suppressing BACE1 activity in cortical neuronsNeurosci Lett2013557909424184877
- MassimoMBGlimepiride in type 2 diabetes mellitus: a review of the worldwide therapeutic experienceClin Ther20032579981612852703
- AmmarHOSalamaHAGhorabMMahmoudAAFormulation and biological evaluation of glimepiride-cyclodextrin-polymer systemsInt J Pharm200630912913816377107
- LangtryHBalfourJAGlimepiride: a review of its use in the management of type-2 diabetes mellitusDrugs1998555635849561345
- DuBShenGPWangDDPangLChenZLiuZYDevelopment and characterization of glimepiride nanocrystal formulation and evaluation of its pharmacokinetic in ratsDrug Deliv201320253323311650
- SeedherNKanojiaMCo-solvent solubilization of some poorly-soluble antidiabetic drugsPharm Dev Technol20091418519219519190
- IlićIDreuRBurjakMHomarMKerčJSrčičSMicroparticle size control and glimepiride microencapsulation using spray congealing technologyInt J Pharm200938117618319446625
- MohdABSankaKBandiSDiwanPVShastriNSolid self-nanoemulsifying drug delivery system (S-SNEDDS) for oral delivery of glimepiride: development and antidiabetic activity in albino rabbitsDrug Deliv20152249950824471856
- RevenSHomarMPeternelLKristlJŽagarEPreparation and characterization of tablet formulation based on solid dispersion of glimepiride and poly(ester amide) hyperbranched polymerPharm Dev Technol20131832333221812524
- SeedherNKanojiaMMicellar solubilization of some poorly soluble antidiabetic drugs: a technical noteAAPS PharmSciTech2008943143618431666
- AmmarHOSalamaHAGhorabMMahmoudAAImplication of inclusion complexation of glimepiride in cyclodextrin–polymer systems on its dissolution, stability and therapeutic efficacyInt J Pharm2006320535716701974
- CarrierRLMillerLAAhmedIThe utility of cyclodextrins for enhancing oral bioavailabilityJ Control Release2007123789917888540
- FasinuPPillayVNdesendoVMKToitLCChoonaraYEDiverse approaches for the enhancement of oral drug bioavailabilityBiopharm Drug Dispos20113218520921480294
- NarendraKJGuptaUApplication of dendrimer-drug complexation in the enhancement of drug solubility and bioavailabilityExpert Opin Drug Metab Toxicol200841035105218680439
- RevenSGrdadolnikJKristlJŽagarEHyperbranched poly(esteramides) as solubility enhancers for poorly water-soluble drug glimepirideInt J Pharm201039611912620600725
- ChenYJInbarajBSPuYSChenBHDevelopment of lycopene micelle and lycopene chylomicron and a comparison of bioavailabilityNanotechnology20142515510224651082
- FanunMMicroemulsions as delivery systemsCurr Opin Colloid Interface Sci201217306313
- DubeyRControlled-release injectable microemulsions: recent advances and potential opportunitiesExpert Opin Drug Deliv20141115917324328888
- SahleFFMetzHWohlrabJNeubertRHLecithin-based microemulsions for targeted delivery of ceramide AP into the stratum corneum: formulation, characterizations, and in vitro release and penetration studiesPharm Res20133053855123135817
- SharmaGWilsonKvan der WalleCFSattarNPetrieJRavi KumarMNVMicroemulsions for oral delivery of insulin: Design, development and evaluation in streptozotocin induced diabetic ratsEur J Pharm Biopharm20107615916920655382
- YinYMCuiFDDocetaxel microemulsion for enhanced oral bioavailability: preparation and in vitro and in vivo evaluationJ Control Release2009140869419709639
- GannuRPalemCRYamsaniVVYamsaniSKYamsaniMREnhanced bioavailability of lacidipine via microemulsion based transdermal gels: Formulation optimization, ex vivo and in vivo characterizationInt J Pharm201038823124120060457
- LiHYMaLLLiXXA simple and effective method to improve bioavailability of glimepiride by utilizing hydrotropy techniqueEur J Pharm Sci20157715416026093052
- Al AboodRMTalegaonkarSTariqMAhmadFJMicroemulsion as a tool for the transdermal delivery of ondansetron for the treatment of chemotherapy induced nausea and vomitingColloids Surf B Biointerfaces201310114315122796784
- HuLDJiaYHNiuFJiaZYangXJiaoKLPreparation and enhancement of oral bioavailability of curcumin using microemulsions vehicleJ Agric Food Chem2012607137714122587560
- New Pharmacopoeia Monographs for Gattefossé Speciality Excipients2007 Available from: http://www.in-pharmatechnologist.com/smartlead/view/199590/4/New-Pharmacopoeia-Monographs-for-Gattefosse-Speciality-ExcipientsAccessed June 16, 2016
- GuptaSChavhanSSawantKKSelf-nanoemulsifying drug delivery system for adefovir dipivoxil: design, characterization, in vitro and ex vivo evaluationColloid Surf A2011392145155
- FengSSMeiLAnithaPGanCWZhouWYPoly(lactide)–vitamin E derivative/montmorillonite nanoparticle formulations for the oral delivery of docetaxelBiomaterials2009303297330619299012
- MeiLZhangZPZhaoLYPharmaceutical nanotechnology for oral delivery of anticancer drugsAdv Drug Deliver Rev201365880890
- MoghimiSMHunterACAndresenTLFactors controlling nanoparticle pharmacokinetics: an integrated analysis and perspectiveAnn Rev Pharmacol Toxicol20125248150322035254
- PavlinMBregarVBStability of nanoparticle suspensions in different biologically relevant mediaDig J Nanomater Bios2012713891400
- TaupitzTDressmanJBKleinSNew formulation approaches to improve solubility and drug release from fixed dose combinations: case examples pioglitazone/glimepiride and ezetimibe/simvastatinEur J Pharm Biopharm20138420821823246797
- KawabataYWadaKNakataniMYamadaSOnoueSFormulation design for poorly water-soluble drugs based on biopharmaceutics classification system: basic approaches and practical applicationsInt J Pharm201142011021884771
- PoutonCWFormulation of poorly water-soluble drugs for oral administration: physicochemical and physiological issues and the lipid formulation classification systemEur J Pharm Sci20062927828716815001
- IwataMFukamiTKawashimaDEffectiveness of mechanochemical treatment with cyclodextrins on increasing solubility of glimepiridePharmazie20096439039419618676
- SemaltyACyclodextrin and phospholipid complexation in solubility and dissolution enhancement: a critical and meta-analysisExpert Opin Drug Deliv2014111255127224909802
- DahanAMillerJMHoffmanAAmidonGEAmidonGLThe solubility-permeability interplay in using cyclodextrins as pharmaceutical solubilizers: mechanistic modeling and application to progesteroneJ Pharm Sci2010992739274920039391
- FischerSMFlatenGEHagesætherEFrickerGBrandlMIn vitro permeability of poorly water soluble drugs in the phospholipid vesicle-based permeation assay: the influence of nonionic surfactantsJ Pharm Pharmacol2011631022103021718285
- FrankKJWestedtURosenblattKMImpact of FaSSIF on the solubility and dissolution/permeation rate of a poorly water-soluble compoundEur J Pharm Sci201247162022579958
- FrankKJRosenblattKMWestedtUAmorphous solid dispersion enhances permeation of poorly soluble ABT-102: true supersaturation vs apparent solubility enhancementInt J Pharm201243728829322951865
- FrankKJWestedtURosenblattKMWhat is the mechanism behind increased permeation rate of a poorly soluble drug from aqueous dispersions of an amorphous solid dispersion?J Pharm Sci20141031779178624764046
- DahanAMillerJMThe solubility-permeability interplay and its implications in formulation design and development for poorly soluble drugsAAPS J20121424425122391790
- MillerJMBeigACarrRAWebsterGKDahanAThe solubility-permeability interplay when using cosolvents for solubilization: revising the way we use solubility-enabling formulationsMol Pharm2012958159022280478
- EstudanteMMoraisJGSoveralGBenetLZIntestinal drug transporters: an overviewAdv Drug Deliver Rev20136513401356
- BurapapadhKTakeuchiHSriamornsakPNovel pectin-based nanoparticles prepared from nanoemulsion templates for improving in vitro dissolution and in vivo absorption of poorly water-soluble drugEur J Pharm Biopharm20128225026122885158
- GaoFZhangZWBuHHNanoemulsion improves the oral absorption of candesartan cilexetil in rats: Performance and mechanismJ Control Release201114916817420951749
- TangTTHuXBLiaoDHLiuXYXiangDXMechanisms of micro-emulsion enhancing the oral bioavailability of puerarin: comparison between oil-in-water and water-in-oil microemulsions using the single pass intestinal perfusion method and a chylomicron flow blocking approachInt J Nanomedicine201384415442624277986
- QiJPZhuangJWuWEnhanced effect and mechanism of water-in-oil microemulsion as an oral delivery system of hydroxysafflor yellow AInt J Nanomedicine2011698599121720510