
 ?Mathematical formulae have been encoded as MathML and are displayed in this HTML version using MathJax in order to improve their display. Uncheck the box to turn MathJax off. This feature requires Javascript. Click on a formula to zoom.
Abstract
Physiological substances pose a challenge for researchers since their optical properties change constantly according to their physiological state. Examination of those substances noninvasively can be achieved by different optical methods with high sensitivity. Our research suggests the application of a novel noninvasive nanophotonics technique, ie, iterative multi-plane optical property extraction (IMOPE) based on reflectance measurements, for tissue viability examination and gold nanorods (GNRs) and blood flow detection. The IMOPE model combines an experimental setup designed for recording light intensity images with the multi-plane iterative Gerchberg-Saxton algorithm for reconstructing the reemitted light phase and calculating its standard deviation (STD). Changes in tissue composition affect its optical properties which results in changes in the light phase that can be measured by its STD. We have demonstrated this new concept of correlating the light phase STD and the optical properties of a substance, using transmission measurements only. This paper presents, for the first time, reflectance based IMOPE tissue viability examination, producing a decrease in the computed STD for older tissues, as well as investigating their organic material absorption capability. Finally, differentiation of the femoral vein from adjacent tissues using GNRs and the detection of their presence within blood circulation and tissues are also presented with high sensitivity (better than computed tomography) to low quantities of GNRs (<3 mg).
Introduction
Extracting optical parameters of turbid medium (eg, tissue) by light transmittance and reflectance signals is of great interest and has many applications in the medical world, life science, material analysis and biomedical optics.Citation1 Recovering tissues’ optical properties, which regularly change according to their physiological state, has been presented and applied for diagnosis purposes such as tumor detection,Citation2,Citation3 optical imaging of brain tissue composition and physiologyCitation4 and DNA and protein changes in human breast tissue.Citation5 The reemitted light from irradiated tissue is affected by the light’s interaction with the tissue components and contains the information about the tissue structure and physiological state. This information can be extracted from the reemitted light profile using analytical models for photon migration within physiological substances (eg, diffusion reflection,Citation6 random walkCitation7 and radiative transfer equation).Citation8 The field of light–tissue interactions has been studied extensively with new techniques emerging constantly,Citation9–Citation13 where each technique has its own advantages as well as limitations and disadvantages. However, Lister et alCitation14 have reviewed some of the leading analyses of human skin’s optical properties, by presenting values of absorption and reduced scattering coefficients (µa and µs′ respectively) published in the literature,Citation15–Citation23 both in vitro and in vivo, and their large dynamic range, concluding that further research should be done.
We have previously presented a theoretical and practical model (ie, the iterative multi-plane optical property extraction (IMOPE)) for reconstructing the optical properties of tissues by computing the standard deviation (STD) of the remitted light phase based on transmission measurements.Citation24,Citation25 In former publications, the transmission based IMOPE has been applied for the detection of organic nanoparticles within tissues in order to promote the use of topical medications instead of injectionsCitation24–Citation26 and for detecting the quantitative signature of milk content (lactose and milk proteins).Citation25 However, transmission techniques are limited by the optical penetration depth (δ), which has to be greater than the sample thickness in order to receive the reemitted light signal, making them less suitable for thick and highly scattering media, such as tissues, and clearly not practical for in vivo measurements. The reflectance based IMOPE presented in this research uses a simple experimental setup composed of a laser and CMOS camera in order to detect the reflected light phase changes. The theoretical model is based on Gerchberg-Saxton (G–S) algorithmCitation27 which is known for its phase retrieval and beam shaping applications for image reconstruction.Citation28,Citation29 The algorithm uses known light intensity images at known distances and the propagation of light between them in order to reconstruct the light phase that was lost once the image was captured. We, however, have demonstrated a novel concept of examining the light phase STD, not the phase itself, in order to extract the optical properties and thereby the desired information of tissues. Hence, following the phase reconstruction its STD is calculated and examined for extracting the tissues’ scattering properties.Citation24,Citation25 The STD together with the image location (which is known from the experimental setup) can provide the reduced scattering coefficient estimated value by a database.
As mentioned above the reemitted light phase from an irradiated substance, which is reconstructed by the iterative G–S algorithm, has a strong connection to its optical properties. When light, as an electromagnetic wave, propagates through a substance, it is affected by the substance’s optical properties and can be described as written below (EquationEquation 1(1) ):
In this paper, the application of the new nanophotonics reflection based IMOPE on both ex vivo and in vivo experiments is presented. Ex vivo experiments were conducted on mice ears examining optical effect of thin tissue viability. In vivo experiments were conducted on mice, with gold nanorods (GNRs) intravenously injected, for examining the reflectance based IMOPE ability to differentiate the femoral vein from tissues in its environment following GNRs injection.
Materials and methods
IMOPE
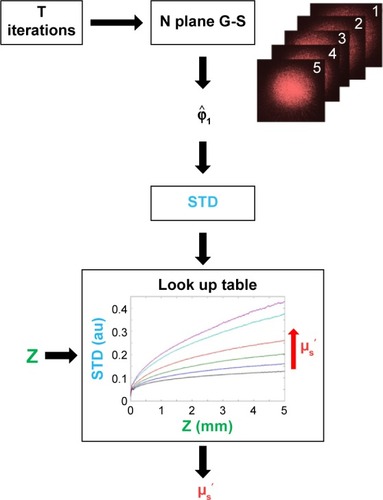
The IMOPE model is composed of two parts that combine a tissue simulation (part 1) with an experimental setup for recording light intensity images for calculating the STD of the reemitted light phase based on G–S algorithm (part 2). The tissue simulation generates a database (ie, look up table) that connects the three main variables, the STD which is calculated in the IMOPE second part, the location within the irradiated tissue, Z which is known, and the reduced scattering coefficient, µs′.
Tissue simulation
In order to understand the influence of the tissue’s optical properties on the STD of the light phase, a MATLAB simulation was performed. The model is based on a more simplistic modelCitation31,Citation32 where in an event of scattering the light direction is simply changed by cos−1 (g). Free space assumes propagation in the z direction, while direction changes are expressed in the phase of the electromagnetic field. While propagating a distance of dz, a change in the direction will create an added optical path of dz/g. In the reflection simulation the detector is located at the same side as the light source, both adjacent to the tissue. The tissue is divided into small slices (dz) and we assume that the light can only scatter in known positions which are separated by a distance dz where the light free space propagates.Citation31,Citation32 In the planes where the light can scatter, the probability (p) of each pixel (within a 1,025×1,025 matrix) to scatter was calculated according to Wang et al and Welch et al,Citation33,Citation34 as follows:
Using these assumptions, the STD for different tissue thicknesses and different reduced scattering coefficients was calculated in order to create a look up table.
IMOPE algorithm
The algorithm used for reconstructing µs′ is described in . In order to reconstruct the reemitted light phase,
, first a multiple measurement G–S algorithm is used with N intensity images, as described in Yariv et al,Citation24 and T iterations. Then, as the phase
is an image of many pixels, with normal distribution, the phase’s STD is calculated. Given the tissue thickness Z, the estimated value for the reduced scattering coefficient can be extracted from the look up table (that was built as described previously).
Figure 1 A schematic description of the algorithm for reconstructing µs′.
Notes: After running T iterations of multi-plane G–S algorithm, the estimated phase
is retrieved. The calculated phase’s STD together with the tissue thickness, Z, produces an estimation for µs′ using a look up table (that was built as described above).
Abbreviations: G–S algorithm, Gerchberg-Saxton algorithm; STD, standard deviation.
Experimental setup
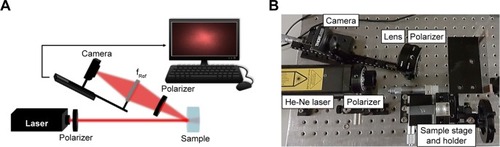
The algorithm detailed in the previous section (IMOPE algorithm) uses light’s intensity images for reconstructing the reemitted light phase. In order to achieve that, a noninvasive reflection based experimental setup was designed. The setup is composed of a helium neon (He-Ne) gas laser with a wavelength of λ=632.8 nm and power of 3.4 mW, polarizers for optical clearing purposes,Citation35,Citation36 lens (focal length of fRef=75 mm) in order to focus the light beam and CMOS camera (DCC1545M, Thorlabs, Japan). The lens and camera were set on a micrometer plate for recording the light’s intensity images at different distances. The samples were held by a 3 axis micrometer stage for fine-tuning during experiments. The setup was built for light reflectance measurements as shown in .
Figure 2 The experimental setup for recording light intensity images.
Notes: (A) A schematic image of the setup. (B) An image of the setup and its components in the lab. The camera records images at multiple planes with equal intervals between them. The experimental setup was designed for reflection measurements. The light source is a helium neon (He-Ne) gas laser with λ=632.8 nm, the focal length of the reflection lens is 75 mm; polarizers were added for optical clearing purposes. The sample is set on 3 axis micrometer plates and can be adjusted in the x-y-z directions.
For each sample, the intensity images were recorded at multiple planes, where the distance between each two planes was the same. The recorded intensity images (1,025×1,025 pixels) were then processed by the algorithm, as explained in IMOPE algorithm section, using MATLAB in order to receive the STD of the sample.
GNRs preparation
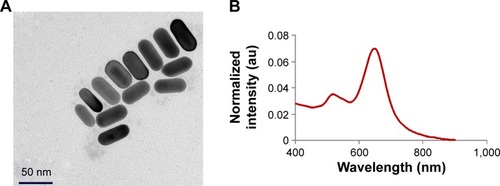
GNRs were synthesized using the seed mediated growth method.Citation37 Their size, shape and uniformity were characterized using transmission electron microscopy (TEM) and the resultant shape was 25×65 nm, with narrow size distribution (10%), TEM images are presented in .Citation2,Citation3,Citation38 In order to prevent aggregation, to stabilize the particles in physiological solutions and to improve blood circulation time, a layer of polyethylene glycol (mPEG-SH, MW 5,000 g/mol) (creative PEGWorks, Winston Salem, USA) was conjugated to the GNR. A solution of GNRs suspended in cetyltrimethylammonium bromide (CTAB) (Sigma-Aldrich Co., St Louis, MO, USA) was centrifuged at 7,000×g for 30 minutes, decanted and resuspended in water to remove excess CTAB. mPEG (200 ml of 5 mM) was added to 1 mL of GNR solution. The mixture was stirred for a few hours at room temperature and was dialyzed for three days. The absorption spectrum of PEGylated GNR solution presented a strong peak at 645 nm, as can be seen in .
Figure 3 The synthesized PEGylated GNRs.
Notes: (A) TEM image of the GNRs. (B) The absorption spectrum of the GNRs, presenting a strong peak at 645 nm.
Abbreviations: PEG, polyethylene glycol; GNRs, gold nanorods; TEM, transmission electron microscopy; au, arbitrary units.
Ex vivo experiments
Two nude mice (age 5 weeks) were anesthetized using 100 µL of a mixture of ketamine 10 mg/mL + xylazine 2 mg/mL injected intraperitoneally. A few days following anesthesia, the mice were sacrificed and for each one both ears were taken for measurements under room temperature. In order to examine thin tissues’ viability, the ears were divided into two groups: group 1 – two ears were measured at the same day and group 2 – two ears were measured after 6 days of being kept under 4°C refrigeration. Following these control measurements, for each group, 5 µL of aqueous 2 mM Methylene blue (MB) solution (Sigma-Aldrich Co.) was applied to the ears and reflection signals were measured again after 24 hours. The ears were placed in the experimental setup on a vertical polycarbonate mount fixed by Sellotape® (polypropylene-based tape). Three measurements of reflection signals were obtained from adjacent different segments of each ear.
In vivo experiments
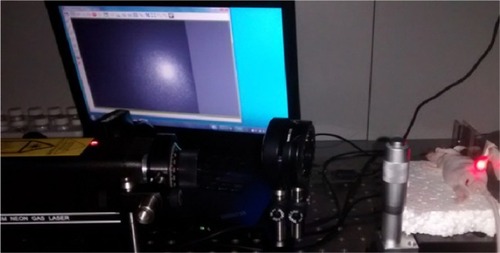
A nude mouse (age 5 weeks) was anesthetized using 100 µL of a mixture of ketamine 10 mg/mL + xylazine 2 mg/mL injected intraperitoneally. The femoral vein was measured before (control) and after it was injected with 150 µL (20 mg/mL gold) of GNRs by tail vein injection in two time periods (t=0.25 h, 24 h postinjection). The tissues next to the femoral vein were measured postinjection as well, for investigating the GNR effect on the femoral vein environment. The mouse was laid on a flat surface with its inner thigh facing the laser; it was placed on the sample holder in the experimental setup and fixed to the polycarbonate mount, as shown in . Computed tomography (CT) scanning was performed before GNRs injection to determine the CT baseline, as well as postinjection in two time periods (4 h and 8 days postinjection).
Figure 4 The experimental setup during in vivo measurements.
The CT scans were performed using a micro-CT scanner (Skyscan High Resolution Model 1176) with nominal resolution of 35 µm, 0.2 mm aluminum filter and tube voltage of 45 kV. Reconstruction was done with a modified Feldkamp47 algorithm using the SkyScanNRecon software accelerated by GPU.48 Ring artifact reduction, Gaussian smoothing (3%) and beam hardening correction (20%) were applied. Volume rendered three-dimensional images were generated using an RGBA transfer function in SkyScan CT-Volume (“CTVol”) software and in SkyScan CT-Voxel (“CTVox”) software. The contrast enhancement was quantitatively determined according to the differential contrast in CT numbers (in Hounsfield units), compared to that of the same mouse before injection. All CT scans were performed under appropriate anesthesia. Up to 8 days post-intravenous injection, mouse behavior was normal and without any evidence of toxicity.
This study received institutional approval from the Bar Ilan Institute for Nanotechnology and Advanced Materials Institutional Animal Care and Use Committee. All ex vivo and in vivo measurements were performed under appropriate anesthesia: the mice barrier-controlled facility followed the Bar Ilan’s Institute for Nanotechnology and Advanced Materials Animal Care and Use Committee guidlelines. The mice were inspected daily by the veterinarian, who handles the appropriate tests and treatment protocols, as required. All research protocols were followed closely by the veterinarian. All major procedures were performed in the surgical facilities using general anesthesia and standard, aseptic surgical techniques.
Results and discussion
Tissue viability examination
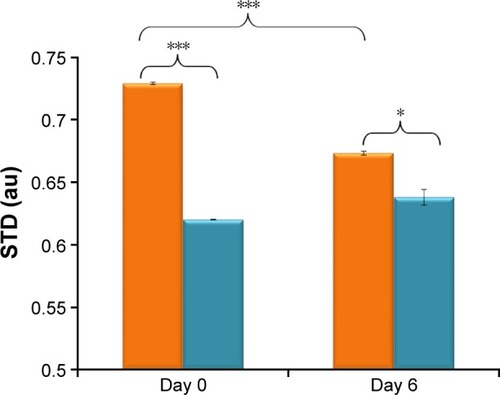
Ex vivo experiments were conducted according to the procedure detailed above for examining the effect of tissues at different states on the light phase STD. The computed STDs for group 1 (experiments were conducted on the same day as sacrifice, ie, day 0) and group 2 (experiments were conducted 6 days following sacrifice, ie, day 6) before and after applying MB (control and MB respectively) are presented in in the orange (control) and blue (MB) bars. The results in show a change in the STD when comparing the control tissue (orange bars) at day 0 and day 6, an 8% decrease in the STD (***P<0.001) indicating a change in the tissue composition that decreases the scattering properties of the tissue. An additional test was conducted on the tissues at their different states by applying MB and examining their effect on the light phase STD. The results presented in show that the STD decreases as the MB has a strong absorption ability. Hence less photons can be scattered resulting in a decreased reemitted light phase STD for both tissues. However, the decrease in the STD for the older tissue (day 6) is much smaller (0.05% with *P<0.05) than the one obtained for the tissue immediately following injection, ie, day 0 (0.15% with ***P<0.001).
Figure 5 The STD obtained for ex vivo experiments.
Notes: The experiments were conducted on two groups: 1) two ears were measured on the same day as sacrifice, ie, day 0; 2) two ears were measured 6 days following sacrifice, ie, day 6. Following control (orange bars) measurements, 5 µL of 2 mM MB was applied to the ears and reflection signals were measured again 24 h later (blue bars). The algorithm parameters were: 8 recorded images (64 iterations) with 1.27 mm distance between them. (*P<0.05, ***P<0.001).
Abbreviations: STD, standard deviation; MB, Methylene blue; au, arbitrary units.
Differentiation between femoral vein and its environment
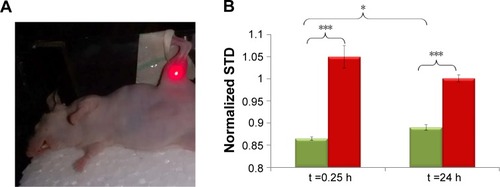
GNRs have been used extensively as contrast agents and are very popular due to their physicochemical and anisotropic shape properties.Citation39 They have previously been suggested as a great candidate for CT contrast agents with 5 mg injected GNRs being the detection threshold in mice.Citation2,Citation3,Citation40,Citation41 Wishing to differentiate the femoral vein from its environment and detect the blood flow effect on the light phase STD, GNRs were used as contrast agent and in vivo experiments were conducted. shows the irradiated mouse femoral vein during the in vivo experiments. The results for the femoral vein and adjacent tissue experiments post-GNRs injection (red and green bars, respectively) are presented in and were normalized to the STD value of the control measurements. The normalized computed STD of the femoral vein 0.25 h post-GNRs injections is 1.05±0.025 demonstrating the presence of GNRs within the femoral vein, as they increase the scattering properties of the femoral vein. However, 24 h later, the GNRs were mostly cleared from the blood circulation, resulting in the normalized STD (decrease back to approximately the control STD value (1.001±0.008)). This indicates the clearance of the GNRs from the femoral vein. Examining the tissues in the femoral vein environment, we have observed an increase in the normalized STD following GNRs injection (*P<0.05). The normalized STD, 15 minutes (0.25 h) postinjection, of adjacent tissues (green bar) is lower than the one measured in the femoral vein since tissues have lower scattering properties than blood vessels.Citation14 In addition, the GNRs have yet to reach the tissues adjacent to the femoral vein (as some of the GNRs, while being cleared from the blood circulation, will diffuse into adjacent tissues) resulting in normalized STD of 0.865±0.005 (***P<0.001). Approximately, 24 h postinjection, the GNRs were cleared from the blood circulation and some were diffused into adjacent tissues resulting in a higher scattering ability which increases the STD, as shown in , to 0.89±0.006 (***P<0.001). The mouse was scanned before and after GNRs injection using CT (as described in Material and methods section).
Figure 6 Femoral vein and adjacent tissues effect on the light phase using GNRs.
Notes: (A) The experimental setup during in vivo experiments. The mouse was laid on a flat surface with its inner thigh facing the laser. It was set on the sample holder on a 3 axis micrometer stage which enables fine-tuning during experiments. The center of the light beam was directed exactly to the femoral vein. (B) The obtained STD in the in vivo measurements. The mouse’s femoral vein (red bars) and tissues in its environment (green) were irradiated following GNRs injection (0.25 h and 24 h postinjection). The algorithm parameters were: 9 recorded images (81 iterations) with 1.27 mm distance between them. (*P<0.05, ***P<0.001).
Abbreviations: GNRs, gold nanorods; STD, standard deviation.
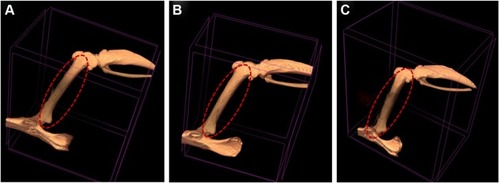
The CT images pre- and 4 h and 8 days postinjection are presented in , respectively. When using CT scanning, in order to observe the GNRs in the image, the common injection amount is more than 5 mg,Citation40,Citation41 the injected GNRs in the presented experiments were only 3 mg. Therefore, looking at the CT images (), no differences can be observed between pre and post injection although, while using the reflectance based IMOPE the presence of the GNRs was observable.
Figure 7 CT images of the femoral vein and its environment pre- and post-GNRs injection.
Notes: (A) Pre-GNRs injection; (B) 4 h post-GNRs injection; (C) 8 days post-GNRs injection. No differences can be observed between the three images.
Abbreviations: CT, computed tomography; GNRs, gold nanorods.
Conclusion
Extracting optical properties of physiological substances (eg, tissues) has many applications and various techniques have been developed, as was described previously. Examination of tissues noninvasively can be achieved by different optical methods, practically all of which are based on light reflectance measurements. In the present paper, we have applied, for the first time, the reflectance based IMOPE for tissue optical properties extraction. The basics of the reflectance based IMOPE were described combining a simple experimental setup for recording light intensity images with an iterative G–S algorithm for reconstructing the reflected light phase and computing its STD. The results presented in this work show that the reflectance based IMOPE was able to differentiate between the viability of different tissues and their MB absorption capability by the computed reflected light phase STD. In addition, by combining a very small amount of injected GNRs with the IMOPE we were able to distinguish between the femoral vein and other tissues adjacent to it, obtaining a higher STD for the femoral vein, as was expected. The GNRs presence within the femoral vein and its environment during 24 h postinjection was detected as well. With the total quantity of injected GNRs being 3 mg, much less has been diffused to the femoral vein environment. The reflectance based IMOPE was applied successfully in the ex vivo and in vivo measurements detailed above, indicating significant potential in clinical medicine. Nonetheless, further quantification of the technique’s sensitivity and efficiency should be performed along with the application of parallel computation in order to enhance accuracy and decrease computational time of the technique. Yet, the reflectance based IMOPE has presented a high sensitivity for the GNRs presence, being able to detect a very low amount of GNRs within tissues adjacent to the femoral vein while the CT imaging system did not manage to do so.
Acknowledgments
This study was partially supported by European Cooperation in Science and Technology (COST) Action MP1403 “Nanoscale Quantum Optics”.
Disclosure
The authors report no conflicts of interest in this work.
References
- TuchinVVTissue Optics: Light Scattering Methods and Instruments for Medical Diagnosis13BellinghamSPIE Press2007
- AnkriRDuadiHMotieiMFixlerDIn-vivo Tumor detection using diffusion reflection measurements of targeted gold nanorods – a quantitative studyJ Biophotonics20125326327322234916
- AnkriRPeretzVMotieiMPopovtzerRFixlerDA new method for cancer detection based on diffusion reflection measurements of targeted gold nanorodsInt J Nanomed20127449455
- LinAJKoikeMAGreenKNSpatial frequency domain imaging of intrinsic optical property contrast in a mouse model of Alzheimer’s diseaseAnn Biomed Eng20113941349135721331663
- YangYCelmerEJKoutcherJAAlfanoRUV reflectance spectroscopy probes DNA and protein changes in human breast tissuesJ Clin Laser Med Surg2001191353911547817
- JacquesSLPogueBWTutorial on diffuse light transportJ Biomed Opt200813404130219021310
- BonnerRNossalRHavlinSWeissGModel for photon migration in turbid biological mediaJ Opt Soc Am A1987434234323572576
- PattersonMSWilsonBCWymanDRThe propagation of optical radiation in tissue I. Models of radiation transport and their applicationLasers Med Sci199162155168
- PrahlSVitkinIBruggemannUWilsonBAndersonRDetermination of optical properties of turbid media using pulsed photothermal radiometryPhys Med Biol199237612031626021
- PickeringJWPrahlSAVan WieringenNBeekJFSterenborgHJVan GemertMJDouble-integrating-sphere system for measuring the optical properties of tissueAppl Opt199332439941020802704
- JohnsMGillerCGermanDLiuHDetermination of reduced scattering coefficient of biological tissue from a needle-like probeOpt Express200513134828484219498468
- KimAWilsonBCMeasurement of ex vivo and in vivo tissue optical properties: methods and theoriesOptical-Thermal Response of Laser-Irradiated Tissue2011267319
- FixlerDDuadiHAnkriRZalevskyZDetermination of coherence length in biological tissuesLasers Surg Med201143433934321500229
- ListerTWrightPAChappellPHOptical properties of human skinJ Biomed Opt20121799090190901123085902
- JacquesSAlterCPrahlSAAngular dependence of HeNe laser light scattering by human dermisLasers Life Sci198824309333
- PrahlSALight transport in tissueUniversity of Texas at Austin1989
- GraaffRDasselAKoelinkMDe MulFAarnoudseJZijlstraWOptical properties of human dermis in vitro and in vivoAppl Opt199332443544720802709
- ChanEKSorgBProtsenkoDO’NeilMMotamediMWelchAJEffects of compression on soft tissue optical propertiesIEEE J Select Topics Quant Electron199624943950
- SimpsonCRKohlMEssenpreisMCopeMNear-infrared optical properties of ex vivo human skin and subcutaneous tissues measured using the Monte Carlo inversion techniquePhys Med Biol1998439246524789755939
- MeglinskiIVMatcherSJQuantitative assessment of skin layers absorption and skin reflectance spectra simulation in the visible and near-infrared spectral regionsPhysiol Meas200223474175312450273
- SalomatinaEJiangBNovakJYaroslavskyANOptical properties of normal and cancerous human skin in the visible and near-infrared spectral rangeJ Biomed Opt200611606402617212549
- ZoniosGDimouAModeling diffuse reflectance from semi-infinite turbid media: application to the study of skin optical propertiesOpt Express200614198661867419529247
- BosschaartNMentinkRKokJHVan LeeuwenTGAaldersMCOptical properties of neonatal skin measured in vivo as a function of age and skin pigmentationJ Biomed Opt201116909700321950938
- YarivIRahamimGShliselbergEDetecting nanoparticles in tissue using an optical iterative techniqueBiomed Opt Express20145113871388125426317
- YarivIKapp-BarneaYGenzelEDuadiHFixlerDDetecting concentrations of milk components by an iterative optical techniqueJ Biophotonics2015811–1297998425727334
- FixlerDYarivINew method to detect organic nanoparticles in live tissueSPIE Proceedings93392015
- GerchbergRWSaxtonWOA practical algorithm for the determination of phase image and diffraction plane picturesOptik197235237246
- FienupJRPhase retrieval algorithms: a comparisonAppl Opt198221152758276920396114
- ZalevskyZMendlovicDDorschRGGerchberg-Saxton algorithm applied in the fractional Fourier or the Fresnel domainOpt Lett1996211284284419876177
- MaierJSWalkerSAFantiniSFranceschiniMAGrattonEPossible correlation between blood glucose concentration and the reduced scattering coefficient of tissues in the near infraredOpt Lett199419242062206419855740
- DuadiHFixlerDPopovtzerRDependence of light scattering profile in tissue on blood vessel diameter and distribution: a computer simulation studyJ Biomed Opt2013181111140823887384
- DuadiHFederIFixlerDLinear dependency of full scattering profile isobaric point on tissue diameterJ Biomed Opt201419202600724522807
- WangLJacquesSLZhengLMCML – Monte Carlo modeling of light transport in multi-layered tissuesComput Methods Programs Biomed19954721311467587160
- WelchAvan GemertMJStarWMWilsonBCDefinitions and overview of tissue opticsOptical-Thermal Response of Laser-Irradiated Tissue19951546
- TuchinVVWangLZimnyakovDAOptical Polarization in Biomedical ApplicationsSpringer Science & Business Media2006
- TuchinVOptical properties of tissues with strong (multiple) scatteringTuchinVTissue optics: light scattering methods and instruments for medical diagnosisBellinghamSPIE Press2007
- NikoobakhtBEl-SayedMAPreparation and growth mechanism of gold nanorods (NRs) using seed-mediated growth methodChem Mater2003151019571962
- FixlerDAnkriRSubcutaneous gold nanorods [corrected] detection with diffusion reflection measurementJ Biomed Opt20131866122623389735
- ShiloMReuveniTMotieiMPopovtzerRNanoparticles as computed tomography contrast agents: current status and future perspectivesNanomedicine (Lond)20127225726922339135
- MeirRShamalovKBetzerONanomedicine for cancer immunotherapy: tracking cancer-specific T-cells in vivo with gold nanoparticles and CT imagingACS Nano2015966363637226039633
- MotieiMDreifussTBetzerODifferentiating between cancer and inflammation: a metabolic-based method for functional computed tomography imagingACS Nano20161033469347726886076